HAL Id: hal-01882499
https://hal.archives-ouvertes.fr/hal-01882499
Submitted on 27 Sep 2018
HAL is a multi-disciplinary open access
archive for the deposit and dissemination of
sci-entific research documents, whether they are
pub-lished or not. The documents may come from
teaching and research institutions in France or
abroad, or from public or private research centers.
L’archive ouverte pluridisciplinaire HAL, est
destinée au dépôt et à la diffusion de documents
scientifiques de niveau recherche, publiés ou non,
émanant des établissements d’enseignement et de
recherche français ou étrangers, des laboratoires
publics ou privés.
A green supply chain network design framework for the
processed food industry: Application to the orange juice
agrofood cluster
Marco Augusto Miranda Ackerman, Catherine Azzaro-Pantel, Alberto A.
Aguilar-Lasserre
To cite this version:
Marco Augusto Miranda Ackerman, Catherine Azzaro-Pantel, Alberto A. Aguilar-Lasserre. A green
supply chain network design framework for the processed food industry: Application to the
or-ange juice agrofood cluster. Computers & Industrial Engineering, Elsevier, 2017, 109, pp.369-389.
�10.1016/j.cie.2017.04.031�. �hal-01882499�
OATAO is an open access repository that collects the work of Toulouse
researchers and makes it freely available over the web where possible
Any correspondence concerning this service should be sent
to the repository administrator:
tech-oatao@listes-diff.inp-toulouse.fr
This is an author’s version published in: http://oatao.univ-toulouse.fr/20444
To cite this version:
Miranda-Ackerman, Marco Aaugusto
and Azzaro-Pantel, Catherine
and
Aguilar-Lasserre, Alberto A. A green supply chain network design framework for the
processed food industry: Application to the orange juice agrofood cluster. (2017)
Computers & Industrial Engineering, 109. 369-389. ISSN 0360-8352
Official URL:
https://doi.org/10.1016/j.cie.2017.04.031
A green supply chain network design framework for the processed food
industry: Application to the orange juice agrofood cluster
Marco A. Miranda-Ackerman
a,b, Catherine Azzaro-Pantel
b,⇑, Alberto A. Aguilar-Lasserre
caCONACYT-El Colegio de Michoacán, Sede La Piedad: Cerro de Nahuatzen 85, Fracc. Jardines del Cerro Grande, C.P. 59370 La Piedad, Michoacán, Mexico bLaboratoire de Genie Chimique, Université de Toulouse, CNRS, INP, UPS, Toulouse, France
cTecnológico Nacional de México, Instituto Tecnológico de Orizaba, DEPI, Av. Instituto Tecnológico 852, Col. Emiliano Zapata, 94300 Orizaba, Veracruz, Mexico
a b s t r a c t
Food production has put enormous strain on the environment. Supply chain network design provides a means to frame this issue in terms of strategic decision making. It has matured from a field that addressed only operational and economic concerns to one that comprehensively considers the broader environmental and social issues that face industrial organizations of today. Adding the term ‘‘green” to supply chain activities seeks to incorporate environmentally conscious thinking in all processes in the supply chain. The methodology is based on the use of Life Cycle Assessment, Multi-objective Optimization via Genetic Algorithms and Multiple-criteria Decision Making tools (TOPSIS type). The approach is illustrated and validated through the development and analysis of an Orange Juice Supply Chain case study modelled as a three echelon GrSC composed of the supplier, manufacturing and market levels that in turn are decomposed into more detailed subcomponents. Methodologically, the work has shown the development of the modelling and optimization GrSCM framework is useful in the context of eco-labelled agro food supply chain and feasible in particular for the orange juice cluster. The proposed framework can help decision makers handle the complexity that characterizes agro food supply chain design decision and that is brought on by the multi-objective nature of the problem as well as by the mul-tiple stakeholders, thus preventing to make the decision in a segmented empirical manner. Experimentally, under the assumptions used in the case study, the work highlights that by focusing only on the ‘‘organic” eco-label to improve the agricultural aspect, low to no improvement on overall supply chain environmental performance is reached in relative terms. In contrast, the environmental criteria resulting from a full lifecycle approach is a better option for future public and private policies to reach more sustainable agro food supply chains.
1. Introduction agriculture is the main contributor to other important
environ-mental impacts, noticeably eutrophication with roughly a 50% share (Tukker & Jansen, 2006). Modern agricultural production sys-tems use agrochemicals like fertilizers and pesticides, and fossil fuels for power machinery, that have increased the environmental footprint of food production. Further, energy and water demand for food processing systems also play an important part. In addition, food production is setup as a globally distributed network of sup-pliers, manufacturers and consumers. Transportation of the raw materials and food products around the world in order to satisfy global demands has also played a large role on the environmental impact. These factors combine to form the economic and environ-mental profile of most food products consumed in developing and advanced economies.
Most of the research works on improving the environmental performance of agro food productions systems has been done by Society has currently evolved to understand that the human
activities, including food production, are damaging the natural
environment. According to Vermeulen, Campbell, and Ingram
(2012), 19–29% of global emissions of greenhouse gases come from agriculture and food production systems. Looking closer to the European Union this same pattern stands - where agriculture and food production are main contributors to emissions related to Glo-bal Warming Potential (GWP). In contrast, the EU is one of the most responsive markets to environmentally conscious food prod-ucts (Ruiz de Maya, López-López, & Munuera, 2011). Furthermore,
Nomenclature Acronyms
AVUC Average Variable Unit Cost
DC Distribution Centre
FCOJ From Concentrate Orange Juice
GrSCM Green Supply Chain Management
GSCND Green Supply Chain Network Design
GWP Global Warming Potential
HHP High Hydrostatic Pressure
KEPI Key Environmental Performance Indicators
KPI Key Performance Indicators
LCA Life Cycle Assessment
MINLP Mixed Integer Nonlinear Programming
MS Multiple Strength
NFCOJ Not From Concentrate Orange Juice
NLP Nonlinear Programming
NPV Net Present Value
PEF Pulse Electric Field
PfS Partnership for Sustainability
SC Supply Chain
SCM Supply Chain Management
SCND Supply Chain Network Design
SP Sales Price
SS Single Strength
VUC Variable Unit Cost
Index & Set
f fabrication steps or stages performed to product F
i label denomination I
p fabrication technology P
r supplying regions in R
r0 market region R0
s suppliers in S
t agricultural practice type used to produce fruit in T
Parameters
br;t average yield per unit of land using agro practice t in re-gion r (kg/ha)
x
r;s land surface available for each supplier s in region r (ha)dr;t average cost per unit of agricultural output in region r
using agricultural practice t ($/kg)
u
r;t average environmental impact per unit of agriculturaloutput in region r using agricultural practice t (kg CO2 eq/kg)
e
r,e average cost of resource type e (electricity, gas, water)per region r and r0
c
p concentration ratio in Brix for raw materials type giventechnology p
ar,e average environmental impact emissions due to
con-sumption of resource e in region r
q
average output of raw juice per unit of fruit (i.e. 2.29 kgorange " 1 L of juice)
kf ;e;p average quantity of resource e needed to operate fabri-cation stage f using technology p
e
r0;e cost of resource type e (electricity, gas, water, materials)in region r0
StdCapp standard capacity of equipment of technology p
StdCCf,p standard capital cost of equipment of technology p Decision variables
BRr binary variable to select the sourcing region r (Mexico,
Brazil)
BSr,s binary variable to select suppliers s {0, 1} in region r
(Mexico, Brazil)
Di,f,m,r0 integer variable to define the quantity of demand that
will be targeted of product label type i processing type f for market m in region r0
ILr0 integer variable to select the location for bottling plant
in region r0{1, 6}
IPf technology for fabrication step f {0, 1} {1, 3}
ITs integer variable to select the agro practice at
orchard/-supplier s {1, 4}
ISs integer variable to define the percentage of land surface
contracted {50–100} Problem variables
Aj amortization per period j
AOCf,p annual operations cost for manufacturing step f using
technology p
ASCt annual supplier (operation) cost per type of agro
prac-tice t
ASEIt annual supplier environmental impact emissions per
type of agro practice t
BMCp bottling operations cost per type of bottling technology
p
BMEIp bottling operations environmental impact emissions per
type of bottling technology p CapfIN intake capacity of fabrication step f CapfOUT output capacity of fabrication step f
Cj total variable cost in period j
Di,f,m,r0 demand targeted of product label type i processing type
f for market m in region r
fL lang factor
InvCostf capital cost installed capacity for fabrication step f LandArear,s land area contracted of supplier s in region r LLDi,f,m,r0 demand lower limit for product label type i processing
type f for market m in region r0
OpCostr,s,t
annual operations cost of each supplier s in region r using agro practice t
OpEIr,s,t annual operations environmental impact measurement for each supplier s in region r using agro practice t Q A ? Bi,f,m,r0 quantity of intermediate product label type i
pro-cessing type f for market m in region r0to be sent from
location A to location B
RMibatt quantity of bottled final product required of label type i RMiconct quantity of concentrated juice intermediate product
re-quired of label type i
RMijuice quantity of raw juice intermediate product required of label type i
RMiorangequantity of orange raw material required of label type i
RMipast quantity of pasteurized juice intermediate product
re-quired of label type i RMUCibatt
bottled final product variable unit cost of label type i
RMUCiconct concentrated juice intermediate product variable
unit cost of label type i
RMUCiorange orange raw material variable unit cost of label type i RMUCipast
pasteurized juice intermediate product variable unit cost of label type i
SPi,f,m,r0 sales price per unit of product label type i processing
type f for market m in region r0
TotalCapacityt total orange raw material production capacity per type of agro practice t
parts, this is to say, many LCA studies have been performed to mea-sure and study alternatives in the agricultural and food manufac-turing process designs (Roy et al., 2009). Other studies have been carried out comparing scenarios or technological alternatives from an environmental point of view (Sonesson et al., 2016). Moreover, economic and operational improvements have been studied exten-sively from tactical, operational and strategic point of views for agro food SCs (Ahumada & Villalobos, 2009; Apaiah & Hendrix, 2005; Miranda-Ackerman, Fernández-Lambert, Azzaro-Pantel, & Aguilar-Lasserre, 2014). Green supply chain management, and more specifically Green Supply Chain Network Design (GSCND) provide a powerful tool to integrate these two complementary
strategies (Eskandarpour, Dejax, Miemczyk, & Péton, 2015;
Seuring & Muller, 2008; Srivastava, 2007).
Supply chains are viewed as networks of elements that involve suppliers, manufacturers, distributors among other stakeholders and reflect materials, information and economic flows. They are physically constructed of natural resource extraction facilities, pro-cessing facilities, manufacturing plants, trucks, sea vessels, ware-houses, etc. . ., that are located in different locations around the world. Supply Chain Network Design (SCND) involves a decision and model framework that searches ‘‘through one or a variety of metrics, for the ‘‘best” configuration and operation of all of these (SC network) elements” (Garcia & You, 2015). Some of the most impor-tant challenges that SCND holds reflect the issues that complex real systems faces including for example decisions at multiple scales, multiple levels, multiple periods, multiple objectives and undoubt-edly multiple stakeholders.
SCND consists in formulating the SC network as nodes and arcs that connect, featured in layers for each echelon that constructs the SC of interest. In each layer, several alternatives are presented that can represent differences in modes of transport, technologies used, geographical locations of sites, among many other choices, while the arcs may represent attributes and criteria of interest such as distances, costs, time periods, etc. The process of optimizing the SCND is to find the best configuration of the network, this is to say, the best route of arcs and nodes that fulfil the single or multi-ple objectives that are of interest to the decision maker. It is impor-tant to highlight that the ‘‘green” reference in GSCND is related to the fact that conventional SCND problem formulations exclude environmental performance measurements and criteria in the design processes; GSCND encompasses the supply chain scope
with environmental performance metrics (Farahani, Rezapour,
Drezner, & Fallah, 2014; Sharma, Chandna, & Bhardwaj, 2017) at early design stage, in the case of this study it is Global Warming
Potential (GWP) measured in CO2equivalent emissions.
This paper is organised as follows. In Section2, we present the work position among the state-of-the-art literature review on green supply chain optimization and its application to food.
Sec-tion3provides the methods and tools used. Section4, which
pre-sents the GSCND framework and scope is then followed in
Section5by its mathematical formulation. In Section6, we apply
the proposed framework to the case study of orange juice cluster.
The obtained results and discussion are developed in Section7.
Finally, in Section8, we close with a summary of the main results and some perspectives.
2. Work position and literature review
Although much progress has been made in this field, some of the key advantages and possible applications of the SCM model have not yet or only scarcely been included in GrSCM body of research (Eskandarpour et al., 2015): especially, the development of efficient multiobjective models that adequately addresses the different dimensions of sustainable development is considered as a cornerstone to tackle the problem.
The GSCND approach that is targeted in this work is the formu-lation of supply chain design as a network of interconnected possi-ble configurations of items for each echelon in the context of an agro-food supply chain. It is formulated as a pure integer non-linear problem with multiple objective functions in order to find the optimal trade-off configuration considering not only opera-tional or economic criteria, but also environmental ones. In order to handle the complexity of the model structure and its compo-nents, a multiobjective genetic algorithm is proposed to find the so-called Pareto optimal solutions. Such strategies have proven to
be powerful tools to solve SCND problems (Altiparmak, Gen, Lin,
& Karaoglan, 2009; Costa, Celano, Fichera, & Trovato, 2010). Let us recall that the concept of ‘‘optimality” does not apply directly in the multiobjective setting so that the concept of Pareto optimal-ity is particularly efficient. A solution vector is said to be Pareto optimal for a multiobjective problem if all other potential solution vectors have a higher value for at least one of the objective func-tions or have the same value for all the objective funcfunc-tions. This allows the model to overcome the combinatorial nature of the problem formulation. In addition, a multiple criteria decision mak-ing tool is used as a means to find the ‘‘best” trade-off solutions. This technique allows the decision maker to categorize the best solutions through a comprehensive method without bias.
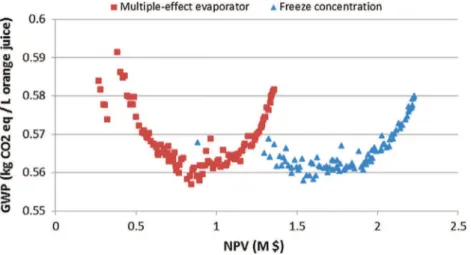
The main contribution of this proposal is that it considers three main factors that have not been yet integrated into a model in the context of GSCND to our knowledge: (1) Organic vs. conventional raw materials: the evaluation of parallel flows of raw materials based on different agricultural practices used and final product outputs based on the use of concentration process is studied in this work; this is important because of the implication on final product quantities to be produced of each type of product and its relation to economic incentives to produce one or another type of product; (2) Green consumer behaviour: the model allows for the evaluation of different pricing strategies based on consumer willingness to pay different prices given specific attributes of the final product, specifically the different product types based on organic labelling have been rarely explored in GSCND problems; (3) Technology selection: given the nature of food production and transformation to be highly energy intensive, indirectly through agrochemical pro-duction and directly through high pressure and heat unit opera-tions, the model provides a strategic decision framework that includes the evaluation of the environmental and economic effect of non-traditional capital investments: for example, the case study evaluates conventional high temperature multi-effect evaporation for the concentration stage of orange juice production vs. more unconventional technologies that can operate with reduced heat requirements such as freeze concentration and reverse osmosis. TUC A ? Bi,f,m,r0 variable unit cost of transporting for
intermedi-ate product from location A to location B
TUEI A ? Bi,f,m,r0 variable unit environmental impact emissions of
transporting for intermediate product from location A to location B
ULDi,f,r0,mdemand upper limit for product label type i processing
type f for market m in region r
Vj total sales income in period j
VUCi,f,m,r0variable unit cost for final product label type i
2.1. Organic vs. conventional raw materials
Issues related to farming have been considered in recent multi-objective optimization models for food products. Recently (Mohammed & Wang, 2017) have proposed a fuzzy multiobjective distribution plan for meat products, and a multiobjective optimiza-tion approach in terms of sustainable supply chain optimizaoptimiza-tion applied to a chemical production supply chain case study has been
reported in Zhang, Shah, Wassick, Helling, and van Egerschot
(2014). But no mention of eco-labelling restrictions or product dif-ferentiation at market based on consumer preference for greener product is considered.
One of the most widely used technique is Life Cycle Assessment (LCA) to aid in the decision making process by providing a means to evaluate the impacts on human health, the ecosystem and the natural resource depletion at some or all the stages in the life span of a product, service or system (Jolliet, Saadé, & Crettaz, 2010). By integrating these two approaches, the scope of SCM is extended to include key criteria offered by EA, thus allowing for the classical economic and operational objectives to be evaluated at the same time as social and environmental issues, when trying to holistically design or improve the overall performance of a production system in a sustainable viewpoint.
In the approach presented here, attention is given to the pecu-liarities that food supply chains have since raw materials sourcing is fundamental for agricultural systems and their environmental performance (Cerutti, Bruun, Beccaro, & Bounous, 2011). It also highlights the principles and use of organic eco-labelling in the food product industry. It finalizes with the introduction of the orange juice case study, the reasoning behind its illustrative selec-tion and the possible ramificaselec-tions of the technique to similar cases.
2.2. Green consumer behaviour
The work presented inCoskun, Ozgur, Polat, and Gungor (2016)
takes this last point as central and the evaluation of consumer pref-erence to three types of products based on the attribute of ‘‘green-ness” is modelled within a supply chain decision framework. The limitation of the modelling approach yet lies in the decision vari-ables being evaluated: no operational or tactical decisions are for-mulated such as technologies to be used, instead different levels of ‘‘green production capability” without further detail form the deci-sion components related to production greenness. Furthermore, the study is a generalized model assuming no specific characteris-tics of the product being produced. This is a good first step in tak-ing into account consumer preference for green products vs conventional ones, but in the context of food products this is lim-ited by eco-labelling rules related to farming practices for many
marketed countries and their labelling regulations (Czarnezki,
2011). It is important to highlight that including green consumer
behaviour within a supply chain design process is a new field based on knowledge that has been gathered within the marketing
field (Brindley & Oxborrow, 2014; Chan, He, & Wang, 2012;
Rousseau & Vranken, 2013). This leads to many research opportu-nities to further develop given that drivers for market share for green products and the related competitive pressures are some of the important issues recently detected in review studies on green
supply chain and their indicators in agrofood industries
(Bloemhof, van der Vorst, Bastl, & Allaoui, 2015; Eskandarpour et al., 2015).
2.3. Technology selection
The aim of the proposed framework is the optimization of the agro-food supply chain design, planning and operations through
the implementation of appropriate green supply chain manage-ment and green logistics principles. In the current literature there have been works that integrate this GHG emission minimization in a multiobjective modelling strategy. Some of the most seminal pro-posals of this modelling strategy take into account technology selection among other supply chain network design decision mak-ing.Guillén-Gosálbez and Grossmann (2009)propose a bi-criteria stochastic mixed integer nonlinear program that maximize Net Present Value (NPV) and minimizes environmental impact mea-sured through Eco-indicator 99. The strategy is applied to chemi-cals production supply chain model with Plant-Warehouse-Market echelons applied to a set of case studies. This work was
an improvement of the proposal of Hugo and Pistikopoulos
(2004) that also took into account technology selection within a multiobjective modelling framework. They proposed a mixed-integer programming approach to model the selection, allocation and capacity applied to chemicals production supply chain. In the recent review on sustainable supply chain network design from
Eskandarpour et al. (2015)the selection of technology is noted on nine articles but most are related to waste management and
chem-ical production. Seminal review papers from Seuring and Muller
(2008) and Srivastava (2007) do not categorize the selection of technologies, within the framework of the supplier selection prob-lem. One outlier is (Amin & Zhang, 2013) that proposed the use of parameter selection as a means to evaluate cleaner technologies and environmentally friendly materials use. The modelling approach examines multiple plants, collection centres, demand markets and products in a closed-loop supply chain network framework. Although it does consider technology selection, it focuses on recycling and remanufacturing. In the context of the research focus of this paper, the integration of greener technologies and organic raw materials use for final products that can be carbon minimized and/or labelled as organic food is proposed.
3. Methods and tools 3.1. General consideration
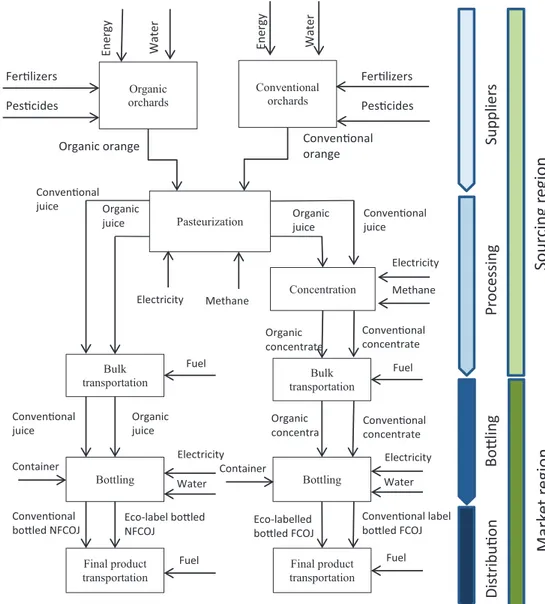
The GSCND for agro-food industry problem targeted in this paper focuses on finding the optimal configuration of a four-echelon supply chain for orange juice, made up by the supplier, processing plant, bottling (packaging) plant and market as shown in; in addition, it has nested decisions at each echelon related to agricultural practice selection, technology selection, product mix (e.g. organic, conventional, from concentrate and non from concen-trate orange juice) and market demand to be satisfied.
Each supply chain echelon has a set of control variables that affects the performance of each component that defines it. These control or decision variables of integer type are: (A) Supplier Ech-elon Decision Variables (81): Raw materials sourcing region loca-tion, Supplier selecloca-tion, Agro practice selecloca-tion, Land area contracted (Agricultural output capacity); (B) Processing Echelon Decision Variables (2): Processing technology selection; (C) tling Echelon Decision Variables (4): Bottling plant location, Bot-tling technology selection; (D) Market Echelon Decision Variables (80): Demand coverage (product mix and system wide capacity).
These variables are subject to two main sets of constraints. The first set involves lower and upper bounds of the values that the decision variables can take during the optimization process. These bounds represent the operational capabilities or value limits eval-uated during the optimization process. The second set of con-straints represent the feasibility of the network, in other words the interdependencies and operational limitations of the process
system under consideration, encompassing mass balance
constituted by a set of equations describing the system decom-posed into three groups: (1) Operational and economic functions; (2) Environmental impact functions; (3) Transportation functions. These constraints and set of function systems are developed in Section3.2. The general objective of this modelling approach is to capture all the complex interdependencies between the variables. The objective functions that will be considered are the following ones: (1) Maximization of the Net Present Value (NPV), defined as an indicator of the economic performance of a project as mea-sured by the cumulative cash flows over time. It allows measuring the economic performance of the system in its full life cycle; (2) Minimization of Global Warming Potential (GWP): GWP is a mea-surement index that integrates the overall climate impact of an
activity or system measured in a standardized form by CO2
emis-sions equivalency; (3) Minimization of Variable Unit Cost (VUC): VUC is defined as the cost incurred to produce and deliver a pro-duct to a store or retailer; (4) Minimization of investment: this capital cost is related to the purchase and installation of processing equipment and facilities.
3.2. Modelling approach
The modelling approach proposed here is based on a multiob-jective integer nonlinear formulation in agro-food systems. The final product is a discrete packaged product (i.e. 1 L of bottled orange juice, 1 can (320 mL) of tomato concentrate, etc.) and pro-cess capacity is thus estimated accordingly to the discrete final quantity of product that will be marketed. A formal definition in an abstract form is presented in(1). The set of minimization objec-tive functions from 1 to n represents the set criteria (related to
eco-nomic and environmental performance) that must be
simultaneously optimized, subject to inequality and equality con-straints represented by g and h functions. They represent the model framework via the interconnected and interdependencies between decision variables, dependent variables and parameters with respect to the feasibility of the system. The decision variables that are used are of binary and integer type represented by y and x respectively. min½f1ðx; y; zÞ; f2ðx; y; zÞ; . . . ; fnðx; y; zÞ& s:t: gðx; y; zÞ 6 0 hðx; y; zÞ ¼ 0 y 2 f0; 1gm; x2 Zn ð1Þ
Following the problem statement and abstract formulation, the formal mathematical model is proposed, using the general struc-ture of the four-echelon supply chain. For the sake of illustration, a mathematical formulation is developed for each link in the chain and constructed in the abstract representation by using the case study of the orange juice production company as a support instance.
The historical and bibliographical data used for model imple-mentation and validation is offered in the Appendices and through-out the case study description. The information that is provided is based on literature review from past and recent data on orange fruit
and orange juice production (Curti-Díaz et al., 1998; Doublet,
Jungbluth, Flury, Stucki, & Schori, 2013; Knudsen, de Almeida, Langer, de Abreu, & Halberg, 2011; Spitzley, Keoleian, & McDaniel,
1997). Additional data for environmental impact estimations are
provided by using Simapro!
software and EcoInvent 2.2 database. 3.3. Solution approach
The problem formulation is based on a two-stage process: Mul-tiobjective Optimization (MOO) and Multiple Criteria Decision Making (MCDM) process.
3.3.1. Multiobjective optimization
The former stage, MOO, can be solved through a limited number of techniques. The weighted sum method, utility method,
lexico-graphic, epsilon-constraint (De-León Almaraz, Azzaro-Pantel,
Montastruc, Pibouleau, & Senties, 2013) are among the most cited MOO solving methods. A very interesting alternative is to use
metaheuristic methods, in particular genetic algorithms (Cortez,
2014; Yang, 2008). These techniques allow to find feasible heuristic solutions (Collette & Siarry, 2003; Cortez, 2014). For a monocrite-rion viewpoint, the main disadvantage is that when using these techniques there is no guarantee of finding solutions that are near the global optimal. The quality of the solution is generally depen-dent on the implementation, analysis and intuition of the modeller to overcome local optima. Some Mixed Integer Programming tech-niques implemented in modern solvers, such as CPLEX and GUROBI could also be used for solving this problem once it has been con-verted into an MILP. The GA strategy has yet proven to be valuable
when modelling complex SCND problems (Miranda-Ackerman
et al., 2014) involving nonlinear formulation. In order to have a generic formulation that could be applied to nonlinear problems, a GA has been selected in this work. Recent publications in the con-text of green chain design show a recurrent use of GA (Ahumada & Villalobos, 2009; Arkeman & Jong, 2010; Yeh & Chuang, 2011). The solving method used here is based on a multiobjective genetic algorithm through the Non-dominated Sorting Genetic Algorithm II (NSGA-II) (Deb, Pratap, Agarwal, & Meyarivan, 2002). This algo-rithm is a population based stochastic search algoalgo-rithm that pro-duces Pareto non-dominated solutions. In contrast to other techniques such as weighted sum or lexicographic methods, that are a priori technique (i.e. a weight or order of the objectives as a matter of choice prior to the execution is needed), multiobjective GA referred as an a posteriori method produces a set of solutions (the so-called Pareto front) to choose fromCortez (2014), this is to say, without prior judgment or decision making. The NSGA-II is implemented through the so-called MULTIGEN library developed byGomez et al. (2010)that allowed to perform evaluations, data analysis and visualization for the case study presented.
The use of NSGA-II as the stochastic search algorithm with the
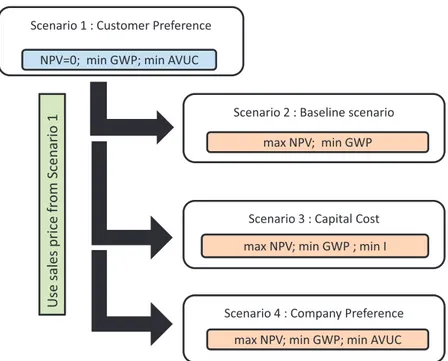
values used for these parameters is summarized inTable 1. They
are fixed based on both empirical trial-and-error experience and
on sensitivity analysis (Dietz, Azzaro-Pantel, Pibouleau, &
Domenech, 2006). A higher number of individuals in the popula-tion associated with a higher number of generapopula-tions used for sce-nario 1 compared to that used for scesce-narios 2–4 (i.e. a double value) is used to overcome the difficulties encountered in stochas-tic search methods involving equality constraints. It must be high-lighted that a relatively high value for mutation rate (i.e. 0.5) was adopted which can be considered inconsistent compared to what occurs in natural evolution. This phenomenon was already observed in mixed integer problems similar to the pure integer
problem treated in this work (Dietz et al., 2006; Gomez et al.,
2010).
3.3.2. Multicriteria decision making strategy
Since GA is a guided random search method, its application can give us an idea of where the Pareto front lies. These solutions rep-resent SC network design configurations that produce comparably
Table 1
Parameter set for multiobjective GA.
Scenario 1 Scenario 2–4
Population size 200 400
Nr. of generations 400 800
Cross-over rate 0.9 0.9
good outcomes in terms of the multiple objectives, this is to say trade-off between the objectives is made in order to find solutions. The aim of MCDM is to aid the decision-maker to select the best alternative. The objectives and preferences of the decision makers and stakeholders play a role in choosing the model structure and characteristics, but a non-bias and systematic approach should be taken when choosing the final solution alternative. This is espe-cially important in multiobjective formulations, also known as, multicriteria decisions, because it is difficult to make judgments on complex higher dimensional solution alternatives. To aid the decision maker, a wide range of MCDM tools including methods such as ELECTRE, PROMETHEE, AHP, TOPSIS, thoroughly evaluated byZanakis and Solomon (1998), provide a systematic and dimen-sion independent ranking framework to compare and rank solu-tions based on multiple criteria.
TOPSIS (Technique for Order of Preference by Similarity to Ideal Solution), according to (Eraslana, 2015; Kim, Park, & Yoon, 1997) has advantages over the other main methods, mainly: (1) it pro-vides a scalar value that accounts for best and worst alternatives concurrently; (2) a logical approach that represents the human choice process; (3) the performance measurements for all alterna-tives can be visualized on a polyhedron, at least for any two dimen-sions; (4) simple to implement algorithm. In addition we use the
M-TOPSIS a modified version of the M-TOPSIS method outlined byRen,
Zhang, Wang, and Sun (2010). This method helps overcoming some evaluation failures that occur in the original TOPSIS method such as top rank reversal (Eraslana, 2015; Zanakis & Solomon, 1998).
The implementation of M-TOPSIS as an algorithm was coded through the Excel!
environment. Because the GA output is given as Excel!
worksheet tables, it was natural to couple the optimiza-tion output to the decisions analysis technique through this environment.
The interest of using GA at the first step of the methodology is that no weight is assigned to influence the search so that the whole Pareto front can be generated in one run. GA results are sets of trade-off solutions in the solution space, that have been found based on the criteria being evaluated. At the second step, the preferences of the decision maker via M-TOPSIS can be reflected based on the previ-ously obtained optimal solutions by only ranking these solutions: it does not change the location of the solutions being found during the optimization process. Unless explicitly mentioned, the same weight is allocated to each criterion. It must be yet highlighted that different values can also be used reflecting the preference of a stake-holder under real world decision-making environment.
4. GSCND framework & scope
Although the proposed approach has the ambition to be generic enough to be applied to a wide range of agro-food systems that have similar characteristics, the problem formulation is supported here by the case study of the orange juice supply chain previously introduced.
4.1. Supplier echelon
Sourcing Region Selection models the selection of a single sup-plying region (e.g. a country). This decision level reflects the selec-tion of the supplier set selecselec-tion and processing plant locaselec-tion. The supplying region guarantees that suppliers are located near one another and share similar characteristics and behaviour such as yield, resources, quality, etc., so that average values shared by clus-ters of suppliers, for long term planning purposes are considered. This selection level is rooted on the principles of developing a Part-nership for Sustainability with the suppliers that integrates life cycle assessment, environmental collaborations, and contract
farming in order to gain the social and environmental benefits related to these paradigms to get closer to a sustainable supply
chain (Miranda-Ackerman, 2015).
By only selecting one region, information and technological resources are concentrated as a long-term planning project. This regional limitation also narrows the list of potential suppliers to those that can share a single initial processing plant (limiting cap-ital investment). This condition is necessary because initial pro-cessing of food is carried out to minimize or eliminate spoilage of the raw material during handling and transportation. It becomes then a de facto plant location decision with its own components and connections to other decision levels. This is to say that other forces such as regional cost of resources (e.g. energy, water, etc.) needed to operate the processing plant and the distance of sour-cing region to market regions are also connected. Resources have an effect on the processing plant location decision, because depending on the location site, local energy and water cost will be more or less expensive.
Supplier selection, agro practice & raw materials capacity. The choice in this level is a three-part nested decision, involving: (1) The choice of suppliers: a set of suppliers with fixed land capac-ities are preselected to be considered within the region selected in the supplier echelon; (2) The definition of capacity that will be con-tracted: once suppliers are selected, a portion or the full land capacity for each one can be contracted to guarantee raw material requirements for downstream processing; (3) And the agricultural practice that will be used: the contract is formulated as a capacity guarantee contract-farming scheme. This contract scheme allows the Focal Company to define not only the land surface under con-tract but also the type of agricultural practice that is to be used. In the SCM paradigm as in the GrSCM, a central or focal company (FC)
as proposed inSeuring and Muller (2008)is characterized by being
the designer or owner of the product or service offered, governing the supply chain, and having contact with all SC stakeholders including the customers. The FC can also sometimes be the pro-cessing or manufacturing company, as in the case study.
In the case study the agricultural practice defines the quality and yield of the product output. The agricultural practices for the case study are divided into four categories based on the classifica-tion proposed byCurti-Díaz et al. (1998): (1) Organic, where agro-chemicals are not used; (2) Green or quasi-organic, where the use of agrochemical such as pesticides or fertilizers is limited; (3) Stan-dard use of conventional types and quantities of agrochemicals; (4) Intensive use of agrochemicals and other agricultural technolo-gies that enhance performance. This family of 4 types of products will be considered in what follows.
4.2. Processing echelon
Technology selection involves a choice among discrete values from a set of alternatives. For Pasteurization process two alterna-tives are proposed: (1) High Hydrostatic Pressure (HHP), (also known as High Pressure Processing (HPP)) is a non-thermal pas-teurization technique by applying high isotactic pressure; (2) Pulse Electric Field (PEF), a non-thermal pasteurization process based on applying high voltage pulsed electric fields. For the Concentration Process three alternatives are proposed: (1) Multi-effect evapora-tors, that involve a thermal method that by heat evaporates water from the food product; (2) Freeze (concentration), is a separation method that removes heat from a mixture during which a compo-nent crystallizes; (3) Reverse Osmosis, is a pressure driven mem-brane process that separates water from the food mixture by physically filtering.
The technology selection choice is interconnected with the selection of the supplying regions, because depending on the region the economic and environmental cost of resources will be
different. Each technology alternative involves distinctive opera-tional requirements in addition to capital cost (e.g. pulse electric field pasteurization technology is more electricity intensive and thus lower electric environmental and economic costs region would be a better choice. In region A, electricity is produced from nuclear energy (low GWP burden), and region B from coal burning (high GWP). Region A would be more attractive to install a plant if the technology selected is electricity intensive (in terms of GWP). In addition, the operational performances of the processes are dependent on the technology used (e.g. orange juice can reach 66"Bx1concentration with evaporators, but only 44"Bx with freeze
or reverse osmosis concentration). The different concentration levels will then induce different transport costs.
Capacity setting influences other decision levels. It is not explicitly modelled as a decision variable, but depends on the demand coverage that is targeted in the Market Echelon. For the case study, two attributes are allocated to the family of the above-mentioned 4 types of products, referring to label and process. The label can be either Organic or Conventional (connected to Sourcing Echelon); the process can involve either the concentration of orange juice (it will be denoted ‘‘From Concentrate Orange Juice”, FCOJ or FC) or no concentration (it will be denoted ‘‘Not From Con-centrate Orange Juice”, NFCOJ or NFC). The Processing Echelon is influenced by the Market Demand coverage that is targeted in the Market Echelon.
It must be highlighted that one of the most important applica-tions of the supply chain network design problem formulation is to determine logistical routes. Although it is possible to evaluate many distribution routing issues related to the distance between farmers and processing plants on the one hand and to the one between the processing plant and the port of departure on the sec-ond hand, these distances are not considered here as well as the selection of alternative ports of departure or arrival. This could yet easily be changed to accommodate different logistical distribu-tion networks. This assumpdistribu-tion is yet valid since their contribudistribu-tion is assumed to be low compared to those related to: (1) from port of departure to port of arrival; (2) from port of arrival to bottling plant; and (3) from bottling plant to market.
4.3. Bottling echelon
At this level two main issues are considered: (1) Packaging/bot-tling plant location and (2) packaging/botPackaging/bot-tling technology selection.
For the plant location issue, a set of possible packaging/bot-tling plant locations is considered, either as potential new installa-tions or as capacity expansion of an existing plant. From this set of potential locations, only one can be chosen to serve all of the dis-tribution centres located in major cities within the regional mar-ket. As abovementioned, the distances from the Port of Arrival to the Bottling Plant, as well as, the distances from the Bottling Plant to Markets are considered. The evaluation of distances between the chosen bottling plant location in relation to the port of arrival and to the distribution centres is reflected through the economic and environmental cost given the distance and quantity of raw mate-rial and product being distributed.
Furthermore, the packaging/bottling technology is evaluated as a technology selection problem similar to that described in the Processing Echelon section. The case study evaluates three differ-ent bottling technologies, i.e., glass bottles, plastic bottles and asce-tic carton container, that are selected based on cost and environmental impact taken from Life Cycle Design study by the
United States Environmental Protection Agency (Spitzley et al.,
1997).
4.4. Market echelon
The modelling approach is based on a market driven supply chain. Market decision framework focuses mainly on market demand coverage, this is to say, production capacity allocation to satisfy each markets’ needs of each product type. A set of targeted markets that represents the main cities in a region is considered.
Demand is defined as a decision variable that can take values between upper and lower demand constraints for each city. The demand variables are used as production planning targets that define the capacities that are required in terms of raw materials production capacity, processing capacity and bottling capacity. By optimizing these demand coverage variables not only is the capac-ity set at each production stage defined, but also the allocation of the installed resources, since the planned production mix ratio between organic labelled and conventional label products as well as from FCOJ and NFCOJ is defined through these variables. Fur-thermore, these will condition the global environmental impact that the SC network design will yield.
In summary, the network design model is characterized by con-sidering a long-term time horizon, lower and upper demand bounds, variable product pricing for each product type, fixed and variable investment costs associated with capacity installation or expansion of processing and packaging/bottling plants, variable transport costs on the economic side. In addition, the
environmen-tal impacts of each stage are captured through the GWP (kg CO2
eq) measurement provided the agro practice, land use, energy con-sumption, water and material use. The objective is then to
deter-mine the optimal supply chain network considering
simultaneously economic benefit and environmental impact. 5. Mathematical model
This section presents the mathematical formulation of the sup-ply chain model related to materials flows and demand satisfac-tion. The case study serves here as a support of the methodology and each component and decision level is presented in detail. 5.1. Mass balance and demand constraints
In terms of materials flow, the network of suppliers, production plants and markets are reflected in a set of constraints that insure production capacities at each level in the supply chain can meet market demand requirements.
5.1.1. Supplier echelon
First, production output has to match market demand. For this purpose, a necessary condition is the procurement of the raw materials from the suppliers, divided in our case study into organ-ically and conventionally grown orange orchard fields. The first two echelons, i.e. supplier and processing are displayed in order to visualize the flow of raw materials along the two links inFig. 2. The TotalCapacitytvariable refers to the total capacity of the supplier network and sums the total capacity of all suppliers capacities QCr,s,tgiven the agricultural practice used t.
TotalCapacityt¼
X s
QCr;s;t;
8
r; s; t ð2ÞThe capacity contracted from each supplier is QCr,s,t, as a func-tion of the LandArear,sand the average output yield per land sur-face unit br;t
QCr;s;t¼ LandArear;s, br;t;
8
r; s; t ð3Þ1 "Bx or degrees Brix refers to the measurement of the sugar content of an aqueous
Table A1summarizes the average output, cost and environmen-tal impact relative to the region and the agricultural practice being used for the case study. They have been established from the
infor-mation given inConsejo Citrícola Poblano (2004)for Mexico and in
Knudsen et al. (2011) and Oelofse et al. (2010)for Brazil.
The LandArear,s(4)is defined by the selection of the region r
through the BRrbinary variable, the land size parameter
x
r;sofeach possible supplying orchard (in ha) (seeTable A2), the binary variable BSr,sto be selected the suppliers s, part of the subset of S that are located in region r, and through the ISsinteger variable that defines the percentage of the total land area to be negotiated in the contract scheme.
LandArear;s¼ BRr,
x
r;s, BSr;s, ISs;8
r; s; t ð4ÞEq.(4)imposes that only one region can be selected for the rea-sons detailed in point 4.1:
X r
BRr¼ 1 ð5Þ
An explicit lower limit of the land being considered of at least 50% of the total land is set in the case study to ensure a fair contract with newly selected partners.
5.1.2. Processing echelon
Two flows of types of oranges that come out of the Supplier Ech-elon enter the first process box (e.g. pasteurization). In our case study these are oranges to be passed through pasteurization pro-cess where the raw material requirements are denoted by RMorange
i¼org and RM orange
i¼conv. They are used in (6)and (7)respectively to constrain the lower and upper limits of the contracted produc-tion capacity from the suppliers to be equal or 10% more than the raw materials required in order to guarantee sufficient raw materials for the production capacity to be installed.
RMorange i¼org 6TotalCapacityt61:1RM orange i¼org; when t ¼ 1 ð6Þ RMorangei¼conv6 X4 t¼2 TotalCapacityt61:1RM orange i¼conv; when t ¼ 2; 3; 4 ð7Þ RMorange
i oranges are needed for juice extraction processing RM
juice i
defined in(8)defined by the constant
q
representing the averageyield of raw juice extracted per unit of oranges. Negligible or no mass loss during the pasteurization process is assumed.
RMjuice i ¼
q
- RM orange i ¼ RM past i ð8Þ Distinctly RMPasti represents the quantity of pasteurized juice
required for outgoing product given that pasteurized juice is sent as a raw material to the bottling plant as-is (Pasteurized Not for Concentrate or PNFC); it is also used as an input raw material for the following processing step, concentration (Pasteurized For Con-centrate or PFC), as shown in(9). It involves raw materials targeted at different destinations. RMpasti ¼ RM past i;f ¼NFCþ RM past i;f ¼FC ð9Þ
RMconcti is the raw material requirement by the bottling plant to produce From Concentrate Orange Juice (FCOJ). It is defined in
(10)by the constant
c
pfor concentration ratio based on the average level of concentration that can be achieve using the selected tech-nology p.RMconct
i ¼
c
p, RM pasti;f ¼FC ð10Þ
Table A3presents the two concentration levels that are reached by different equipment technologies being evaluated for the con-centration process for the case study. It shows the quantity of sin-gle strength orange juice (i.e. with the natural concentration level of the juice /11"Bx) needed to produce a unit (measured in volume and weight) of multi-strength orange juice concentrate (i.e. orange juice that is concentrated to multiple times its Brix concentration, usually 44"Bx and 66"Bx).
5.1.3. Bottling echelon
Within the Packaging/Bottling and Market echelons, there are a series of characteristics that are modelled for the case study. Look-ing at the demand side, there are two market regions r0France and Germany, this is denoted by the dotted line boxes inFig. 3. Within each region, a single bottling plant is located and sized to satisfy the demand Di;f ;r0;mcorresponding to a market of the 10 most pop-ulated cities m in each region r0denoted by the Distribution Cen-tres (DC) boxes. A variable demand is allocated to each market within upper and lower limits. The demand to be covered by pro-duction capacity will be set as a decision variable. This allows the model to allocate the production output capacity to the most prof-itable and least environmentally damaging product types and mar-kets (e.g. marmar-kets closer to a bottling plant may be more attractive). The lower limit for demand means that there is a min-imum level to be satisfied while the upper limit represents an esti-mation of the market potential.
Four flows of bottled products from the bottling plant are con-nected to the market DC. The total capacity of the bottling plant is determined by the sum of the demands to be satisfied. These demands are divided by product type, based on the initial raw material sourcing i and on the fabrication steps it has gone through notably if it has been concentrated or not as indicated through f index.
More precisely, within the packaging/bottling plant, the input of raw materials coming from the market r0port of arrival is available in two forms, either single strength (or NFCOJ) form or multi-strength (or FCOJ) form for each raw material sourcing type i that is transformed using a given technology p. For the case of NFCOJ, no mass change is assumed, while for FCOJ, the addition of water serves to reconstitute the orange juice to its single strength form.
Mathematically these echelons involve RMbott
i , i.e. the quantity of bottling juice required by the market DC; it is equal to the
demand(11). The demand coverage is denoted by the integer
deci-sion variable Di;f ;r0;m that represent the number of final product
units that are planned to be sold to the distribution centre in mar-ket m within the region r0of products type based on concentration f, where f can be either NFCOJ or FCOJ, as well as based on the type of raw materials used i.
RMbott
i;f ;r0¼
X m
Di;f ;r0;m;
8
r0 ð11ÞThe demand is restricted by an upper and lower bound
expressed in(12), these limits are viewed as the minimum
accept-able market demand satisfaction and the maximum market demand saturation limits.
LLDi;f ;r0;m6Di;f ;r0;m6ULDi;f ;r0;m ð12Þ
The demand is satisfied by the inputs coming from the pasteur-ization process as RMpast
i;f ¼NFCOJ(13)and through the reconstitution
step by adding water to the concentrated raw material RMconst
i;f ¼FCOJ
(14).
RMbotti;f ;r0¼ RM
past
RMbotti;f ;r0¼ 1
c
p RMconcti;f þ 1 01c
p RMconcti;f ! , Qwater; when f ¼ FCOJ ð14Þ5.2. Operational and economic functions 5.2.1. Supplier echelon
In order to evaluate the economic performance, we need to determine the cost at each stage of the production process. The production cost of each type of product is dependent on the condi-tions and costs that are relative to each echelon of the network. A similar nomenclature is used to the one adopted for the demand and mass balance constraints: a super-index is used to denote the stage in processing of the materials (e.g. orange to raw juice to pasteurize and so on) and the sub-index is used to denote the sourcing of raw material and the processing steps.
The raw materials unit cost RMUCorange
i represents the cost that
is necessary to produce 1 kg of oranges based on which agricultural practice category i was used (organic or conventional). It is esti-mated by dividing the sum of the annual supplier operating cost ASCtof all orchards that use technologies t that are in the i technol-ogy category (see materials flows inFig. 2) and divided by the sum total of capacity contracted TotalCapacitytfor agro practice t that are in the i label category:
RMUCorangei ¼ P tASCt P tTotalCapacityt ;
8
t 2 i ð15Þ ASCt¼ X s OpCostr;s;t8
t ð16Þ OpCostr;s;t¼ LandArear;s, dr;t;8
r; s; t ð17ÞThe calculation for each product flow (i.e. organic and conven-tional) is allocated through(18)and(19)
RMUCorangei¼org ¼ P
tASCt
TotalCapacityt
; when t ¼ 1 2 i ¼ Organic
1 T ð18Þ
RMUCorangei¼conv¼ P tASCt TotalCapacityt ; when t ¼ 2; 3; 4 2 i ¼ Con
v
entional 1 T ð19Þ 5.2.2. Processing echelonThe raw material unit cost (RMUC) is used to compute the unit variable costs in the processing of the materials along the next pro-cessing steps. The propro-cessing of the materials is firstly carried out near the raw materials source that usually consists of pasteurization.
RMUCpast i;f ¼past¼ AOCf ¼past;p CapOUT f ¼past;p þ RMUCorangei ;
8
i ð20Þ AOCf ¼past;p¼ X eð
e
r;e, kf ;e;p, CapINf Þ ð21ÞThe capacity needed to operate(22)defines the capital
invest-ment(23):
CapINf ¼past¼ CapOUTf ¼past,
StdCapINf ;p StdCapOUTf ;p ! ð22Þ In
v
Costf ¼ StdCCp Cap OUT f StdCapp !3=5 ;8
f ð23ÞThe next process is the concentration process for the case study. It is located at the same plant location than the pasteuriza-tion process. The concentrapasteuriza-tion process consists of removing water through a selected concentration technology p from a list of candi-dates: evaporation, freezing, osmosis. Each technology has a differ-ent energy consumption profile defined by the type and quantity of energy resource used with a specific operation cost. The output of the system is constituted of two flows, organic and conventional FCOJ for the bottling plants. And its raw materials unit cost is defined in(24).
RMUCconsti;f ¼const¼AOCf ¼const;p
CapOUTf ¼const;pþ ð
c
p- RMUC pasti Þ ð24Þ
5.2.3. Bottling echelon
The final processing step is to bottle the product to be shipped. It is defined for the production flow of non-from concentrate
orange juice in(25) and for the reconstitution process of
from-concentrate orange juice in(26)
RMUCbotti;f ¼NFCOJ¼ BMCpþ RMUCpasti;f ¼past ð25Þ RMUCbotti;f ¼FCOJ¼ BMCpþ RMUCconsti;f ¼const
þ 1 01
c
p ! ,e
r0;e¼water- kf ;e;i " # ð26Þ5.3. Environmental impact functions
The same basic modelling structure is used for the definition of the environmental impact functions. The environmental impact is
focused on global warming potential as expressed in kgCO2eq/kg.
For the orchard production stage the raw material unit
envi-ronmental impact is defined by(27)–(29)
RMUEIorange i ¼ P tASEIt P tTotalCapacityt ;
8
tji ð27Þ ASIEt¼ X s OpEIr;s;t;8
t ð28Þ OpEIr;s;t¼ LandArear;s;t, wr;t;8
r; s; t ð29ÞFor the pasteurization process this is defined through(30)
RMUEIpasti;f ¼past¼AOEIf ¼past;p
CapOUT
f ¼past;p
þ ð
q
, RMUEIorangei Þ ð30Þwhere the annual operating environmental impact is defined in(31)
AOEIf ;p¼
X e
ð
u
r;e, kf ;e;p, Cap INf Þ ð31Þ
Concentration unit environmental impact is calculated in(32)
RMUEIconst
i;f ¼const¼
AOEIf ¼const;p
CapOUTf ¼const;p þ ð
c
p, RMUEI pasti Þ ð32Þ
And the two flows of bottled final product based on the concen-tration step criteria are defined in(33) and (34)
RMUEIbotti;f ¼NFCOJ¼ BMEIpþ RMUEIpasti;f ¼past ð33Þ
RMUEIbott
i;f ¼FCOJ¼ BMEIpþ RMUCconsti;f ¼const
þ 1 01
c
p ! , /r0;e¼water- kf ;e;i " # ð34Þ5.4. Transportation functions
The transportation activities involved through the supply chain have an economic and environmental cost. The four intermediate product types, i.e., pasteurized single strength (NFCOJ) organic and conventional orange juice, and concentrated multiple strength (FCOJ) organic and conventional orange juice differ from their pro-duction cost, related to their operations but share the same trans-portation cost in terms of kilogram kilometer (kg km) per mode of transport. These intermediate products are transported in bulk by different modes and route; for our case study, transport is limited to sea freight transport from the port of departure of the region r selected, with two arrival port destinations. These ports service two main market regions, mainly France and Germany, the two lar-gest consumers of fruit juice in Europe. Within each market region, a set of markets (10 in the case study) made up of the most popu-lated cities (10 in the case study). This configuration is shown in
Table A7where the economic cost from one location to its destina-tion is denoted by hA?Bwhere A is the current location and B is the destination for each echelon connection in the network in $/kg km;
while
w
A?Brepresents the environmental impact of each transporttrajectory measured in kg of CO2eq/kg km (as abovementioned).
Table A7presents the values that are used for the case study for the sea freight transport concerning economic and environmental impact constants used to measure the performance of the
trans-portation activities from r ? r0. Tables A3–A6 present in more
detail the values for the two other main transportation trajectories that are included in the case study model, mainly port of arrival to bottling plant and bottling plant to market city.
The general mathematical representation of the transport cost is through the multiplication of the intermediate product quantity
to be transported QA!B that is a measurement in kg of material
equivalent to the weight needed to produce one unit of the final product and the standard cost hkfrom location A to B in $/kg km.
TUCA!B
i;f ;m;r0¼ QA!Bi;f ;m;r0, hA!B;A initial location and B final location
ð35Þ
For the environmental impact the coefficient involves the stan-dard emission wkfrom location A to B in kgCO2eq/kg km.
TUEIA!Bi;f ;m;r0¼ QA!Bi;f ;m;r0, wA!B;A initial location and B final location
ð36Þ
5.5. Objective functions
In order to evaluate the performance of the supply chain net-work, different criteria are developed. Initially one needs to empir-ically or through an ‘‘objectives and preferences study” choose a set of criteria of interest, which reflect the economic and environ-mental performance of the SC. The model considers four possible objectives NPV, GWP, average VUC and I.
5.5.1. NPV and investment
One of the most widely used KPIs is the Net Present Value (NPV) of a project. The advantage of this indicator is that it looks at the long-term plan taking into consideration the effect of time. Addi-tionally, it considers the operational and the fixed capital cost within a single framework in contrast to single facets of a project such as Sales Revenue, Project Cost, among others KPIs. It is defined in its objective function form as follows
max NPV ¼ 0I þX
nj
j¼1
½Vj0 Cj0 Aj& - ½1 0
a
& þ Ajð1 þ irÞj ð37Þ
Investment I is calculated by summing the equipment cost and multiplying by the Lang factor (fL) for the type of production system
I ¼ fL
X
f
In
v
Costf ð38ÞSales revenue (Vj) in a period is the product of sales price by the demand and satisfies:
Vj¼ X i X f X m X r0 ðSPi;f ;m;r0, Di;f ;m;r0Þ;
8
i; f ; m; r0; j ð39ÞThe Sales Price (SP) is calculated in function of the variable unit cost VUCi;f ;m;r0, a sales margin Mi.
SPi;f ;m¼ VUCi;f ;m;r0- Mi;
8
i; f ; m; r0 ð40ÞThe Cost C is defined by sum of the products planned to be pro-duced defined by the product of the demand coverage (D) for each product at each market by its unit Variable Unit Cost (VUC)
Cj¼ X i X f X m X r0
ðVUCi;f ;m;r0, Di;f ;m;r0Þ;
8
i; f ; m; r0 ð41ÞThe variable unit cost is defined by the sum of all the opera-tional cost incurred to produce and deliver each final product to each market. In general it considers raw materials, processing and bottling costs, and transport variable costs for each product based on the type of product type and the market it is sent to (for the case study 80 VUCs are estimated in total: 2 labels (i) ⁄ 2 process routes (f) ⁄ 10 markets (m) ⁄ 2 regions (r0))
VUCi;f ;m;r0¼ X i X f X m X r0
ðRMOCbottli;f ;m;r0þ TUCr!r
0
i;f ;m;r0þ TUC
r0!b
i;f ;m;r0
þ TUCb!mi;f ;m;r0Þ;
8
i; f ; m; r0 ð42ÞThe investment, previously defined, is used to estimate the amortization A by dividing I by n periods of operation (i.e. strength line method).
Aj¼
I
n ð43Þ
For the case study, a time period n equal to 10 years, an interest rate of 12% and a tax rate
a
equal to 0.322 and fL¼ 2:02 for Orange Juice Concentration equipment (Saravacos & Maroulis, 2007) are considered.5.5.2. GWP
Simultaneously environmental impact measurements are also developed for each optimization instance. The proposed approach takes into account the GWP indicator. It is defined as the sum of the environmental impact output per unit given the type of pro-duct and market to which it is transported to (i.e. each of the 20 market destinations demanding the 4 types of products, 80 unique UnitEnvImp) times the number of product produced to cover each demands min Global GWP ¼X i X f X m X r0 ðUnitEnvImpi;f;m;r0 , Di;f;m;r0Þ;
8
i; f; m;r0 ð44Þ UnitEnvImpi;f;m¼ X i X mðRMEIbottli;f;mþ TUEI
r!r0
i;f;m;r0þ TUEI
r0!b
i;f;m;r0
þ TUEIb!mi;f;m;r0Þ;
8
i; f; m;r0 ð45Þ5.5.3. Average variable unit cost
The sum of the product of each VUC times the quantity that is produced (D) for each type of product given i label, f fabrication
the production output planned for all products to all markets gives the average variable cost.
AVUC ¼ P i P f P m P
r0ðVUCi;f;m;r0, Di;f;m;r0Þ
P
iPfPmPr0Di;f;m;r0
;
8
i; f; m;r0 ð46Þ6. Case study
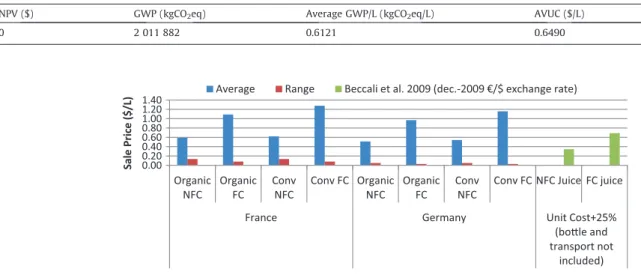
The GSCND approach provides special attention to materials and information flows and other logistics issues, some operations are aggregated into higher-level black-box operations in order to manage the SC scope. Indeed, compared to the study performed byBeccali, Cellura, Iudicello, and Mistretta (2010), that is used as a reference for the case study design, transportation operations are included in more detail than inBeccali et al. (2010)life cycle assessment study alone.
The case study considers the 1 L of bottled orange juice as the functional unit in its 4 variations (based on labelling). The essential oil and other by-products are excluded from the scope.
In contrast to the approach used in Beccali et al. (2010), the
model proposed here addresses many important supply chain design issues. First, two types of raw materials (i.e. organically and conventionally grown orange fruit) based on the agricultural practices applied (i.e. use of agrochemicals), are considered (see
top ofFig. 1). These two materials flows are segregated throughout the product life cycle in order to evaluate a differentiated pricing policy based on this quality attribute. Besides, the type of agro practices that can be selected during production, this can range in the level of intensity with which agrochemicals are used. Four levels, ranging from organic agro practice to intensive are consid-ered. The organic practice uses no agrochemicals. In return, the production yield per hectare is very low but is assumed as the only type of production that allows the use of organic eco-labels. The intensive case, and all other in-between levels, use fertilizers and pesticides in order to achieve better production yields but are pro-hibited to be marketed as organic.
InBeccali et al. (2010), the primary process consisted in the sorting, cleaning and extraction operations, that are aggregated in the pasteurization process in our case study. The detailed study of these operations could be considered in future work but was excluded to delimit a more manageable scope in terms of data col-lection. Pasteurization process, concentration and bottling are con-sidered here as the three main process steps that are the focus of the SCND problem formulation. These steps and the relationship to their relative supply chain echelons are presentedFig. 1.
The Focal Company that manages a globally distributed orange juice supply chain needs to select a project to increase capacity. The potential market demand is assumed to be known. The main
E
n
e
rg
y
W
a
te
r
E
n
e
rg
y
W
a
te
r
Organic juice Organic orchards Pasteurization Concentration Bulk transportation Bottling Bottling Bulk transportation Final product transportationSu
p
p
lie
rs
Conventional orchardsP
ro
ce
ss
in
g
B
o
)
lin
g
D
is
tr
ib
u
,
o
n
Organic orange Conven,onal
orange Conven,onal juice Final product transportation Organic concentrate Conven,onal concentrate Organic juice Conven,onal juice Organic concentra Eco-labelled bo)led FCOJ Conven,onal label bo)led FCOJ Conven,onal concentrate Conven,onal juice Organic juice Conven,onal bo)led NFCOJ Eco-label bo)led NFCOJ Electricity Methane Electricity Methane Fuel Electricity Water Container Fuel Electricity Water Container Fuel Fuel