Competitive Impacts of Continuous Pricing
Mechanisms in Airline Revenue Management
by
Alexander Papen
B.Sc., Electromechanical Engineering, KU Leuven (2015)
M.Sc., Mechanical Engineering, KU Leuven (2017)
Submitted to the Department of Civil and Environmental Engineering
in partial fulfillment of the requirements for the degree of
Master of Science in Transportation
at the
MASSACHUSETTS INSTITUTE OF TECHNOLOGY
May 2020
c
○ Massachusetts Institute of Technology 2020. All rights reserved.
Author . . . .
Department of Civil and Environmental Engineering
May 20, 2020
Certified by . . . .
Peter P. Belobaba
Principal Research Scientist in Aeronautics and Astronautics
Thesis Supervisor
Accepted by . . . .
Colette L. Heald
Professor of Civil and Environmental Engineering
Chair, Graduate Program Committee
Competitive Impacts of Continuous Pricing Mechanisms in
Airline Revenue Management
by
Alexander Papen
Submitted to the Department of Civil and Environmental Engineering on May 20, 2020, in partial fulfillment of the
requirements for the degree of Master of Science in Transportation
Abstract
Traditionally, airlines have been limited to a set of fixed price points to distribute their fare products. The advent of IATA’s New Distribution Capability (NDC), however, will soon enable airlines to quote any fare from a continuous range. In theory, such continuous pricing could increase revenues by extracting more of the consumer sur-plus, through its ability to offer fares closer to the customer’s willingness-to-pay. This thesis examines the impacts of continuous pricing in competitive airline networks through simulation in the Passenger Origin-Destination Simulator (PODS). To this end, both class-based and classless RM methods for continuous pricing are presented. Class-based continuous RM relies on the same underlying forecasting and optimiza-tion models as tradioptimiza-tional RM, while quoting a single continuous fare. Classless RM, on the other hand, completely abandons the notion of pre-specified fare classes, but instead forecasts and optimizes over a temporal dimension.
Simulations show that the improved pricing granularity from continuous pricing re-sults in revenue gains of 1-2% when adopted by all airlines, while the gain for the first-mover might be as high as 10-15%. These revenue gains are driven by the ability of continuous pricing to generate lower fares, in-between existing price points, towards the end of the booking horizon. These lower fares, in turn, result in the stimulation of new demand and capture of high-yield business passengers from competitors. We conclude by showing that an airline with traditional RM can reduce, or even reverse, the impact of a competitor moving to continuous pricing by inserting addi-tional price points, adjusting its own RM system settings, or discounting its upper fares. Compared to the current general practice of fare matching, these less transpa-rent competitive responses could have negative impacts on revenues throughout the industry when airlines repeatedly respond to each other’s pricing actions.
Thesis Supervisor: Peter P. Belobaba
Acknowledgments
First and foremost, I would like to express my sincere gratitude to my research advisor, Dr. Peter Belobaba, for his continuous guidance and support throughout my journey at MIT. I cannot thank him enough for introducing me to the inspiring world of revenue management and providing me the opportunity to work at the forefront of this exciting research area as part of the MIT PODS Consortium. His extensive availability, wealth of experience in revenue management, honest feedback and quick turnaround times on draft chapters have contributed tremendously to this thesis. His unmatched passion and never-ending enthusiasm for this topic have made it a true joy to attend every one of his lectures, and I would recommend any MIT student to take his courses. Finally, I admire his professional response and his transparent communication during these uncertain times of the ongoing Coronavirus outbreak. It has been an honor working together with Peter and I am truly thankful for everything he has taught me.
I would also like to commemorate Craig Hopperstad, who developed and implemented the continuous pricing methods presented in this thesis. My research would not have been possible without his major programming contributions to PODS.
The constructive feedback and financial support provided by the members of the MIT PODS Consortium have been invaluable to both my personal and academic development. In particular, I would like to thank my future colleagues at Amadeus, Thomas Fiig, Mike Wittman and Jean-Michel Sauvage for offering me the opportunity to kick-start my professional career within this exciting field.
I am also grateful to the Belgian American Education Foundation and the Sofina & Boël Platform for Education and Talent for their generous donation, making my attendance at MIT possible.
Over the past two years, I was fortunate to be surrounded by the bright minds of Adam Bockelie, Nicholas Liotta, Akash Raigangar, Kevin Wang, Yuxuan Lu and Bazyli Szymański. I would like to give special thanks to Adam and Nick for their patience and effort in helping me set up my very first PODS simulation runs and going through every detail of the .IN and .SOT files. It was a great pleasure passing on my knowledge to Bazyli, who not only has become a life-long friend, but hopefully also co-author of one of our future papers on continuous pricing in airline RM. Of course, there is more to life than pricing airline tickets. I am grateful for all the beautiful moments I have shared with my friends along the way: sailing on the Charles with Robbert, running along the river esplanade with Matthieu and Justine, bursting out in laughter while watching “Het Eiland” with June, and winning the intramural soccer tournament with the CEE crew are memories at the heart of my MIT experience.
I would never have been at this point in my life without the lifelong support of my parents, who have always supported me in chasing my dreams. Thank you.
Contents
1 Introduction 19
1.1 Overview of Airline Revenue Management and Pricing . . . 19
1.2 Legacy Distribution Systems: Limitations for Airline RM . . . 25
1.3 Potential of IATA’s New Distribution Capability . . . 27
1.4 Research Objectives and Contributions . . . 28
1.5 Thesis Outline. . . 30
2 Literature Review 31 2.1 Independent Demand Revenue Management . . . 32
2.1.1 Leg-Based Optimization . . . 33
2.1.2 Origin-Destination Control . . . 35
2.1.3 Demand Forecasting and Unconstraining . . . 37
2.1.4 RM Methods for Unrestricted Fare Structures . . . 38
2.2 Dynamic Pricing in Airline RM . . . 40
2.3 Towards Competitor-Aware Revenue Management . . . 45
2.4 Summary . . . 47
3 Forecasting and Optimization Models for Continuous Pricing 49 3.1 Framework for Continuous Pricing Mechanisms . . . 50
3.2 Traditional Class-Based Revenue Management . . . 52
3.2.1 Q-Forecasting for Unrestricted Fare Structures . . . 53
3.2.2 Fare Adjustment for Class-Based Methods . . . 57
3.2.4 Class-Based Unbucketed Dynamic Programming (UDP). . . . 61
3.3 Class-Based Continuous Revenue Management . . . 64
3.4 Classless Revenue Management . . . 65
3.4.1 Classless Probabilistic Bid Price (ProBP). . . 67
3.4.2 Classless Unbucketed Dynamic Programming (UDP) . . . 68
3.5 Summary and Extensions of Continuous Pricing Algorithms . . . 70
4 Overview of the Passenger Origin-Destination Simulator 73 4.1 PODS Architecture . . . 74
4.1.1 Passenger Generation and Customer Choice Model . . . 75
4.2 PODS Simulation Networks . . . 80
4.2.1 D11 Network . . . 81
4.2.2 U10 Network . . . 83
4.3 Summary . . . 85
5 Simulation Results: Impacts of Continuous Pricing 87 5.1 Network D11 . . . 88
5.1.1 Impacts of Symmetric Continuous Pricing (All ALs) . . . 88
5.1.2 Impacts of Asymmetric Continuous Pricing (AL1 Only) . . . . 97
5.2 Network U10 . . . 104
5.2.1 Impacts of Symmetric Continuous Pricing (All ALs) . . . 104
5.2.2 Impacts of Asymmetric Continuous Pricing (AL1 Only) . . . . 106
5.3 Summary . . . 108
6 Competitive Responses by Airline Using Traditional RM 111 6.1 Increasing Pricing Granularity by Adding Price Points . . . 113
6.2 Reducing Willingness-to-Pay Estimates . . . 118
6.3 Discounting Business-Oriented Fare Classes . . . 122
6.4 Summary . . . 127
7 Conclusion 129 7.1 Review of Key Contributions and Implications . . . 131
List of Figures
1-1 Schematic overview of indirect distribution channels (Bockelie, 2019) 26
1-2 Framework for traditional and continuous pricing methods developed in the Passenger Origin-Destination Simulator (Liotta, 2019) . . . 29
2-1 Dynamic pricing mechanisms in the airline industry (Wittman and Belobaba, 2019) . . . 42
3-1 Framework of class-based and classless continuous pricing mechanisms 50
3-2 Exponentially distributed willingness-to-pay 𝑃 (WTP ≥ 𝑓 ) with 𝑓𝑄 =
$100 and 𝐹 𝑅𝐴𝑇 5 = 1.5, 2.0 and 2.5 . . . 54
3-3 Standard FRAT5 curves used in PODS . . . 56
3-4 Interaction between inputs used for Q-forecasting and Fare Adjustment 58
3-5 Schematic overview of the iterative class-based ProBP algorithm . . . 59
3-6 Graphical illustration of the example in Table 3.2 . . . 61
3-7 Schematic overview of the class-based UDP algorithm . . . 64
3-8 Maximization of the expected net contribution under classless RM . . 66
3-9 Schematic overview of the iterative classless ProBP algorithm . . . . 71
3-10 Schematic overview of the classless UDP algorithm . . . 71
4-1 Schematic representation of the PODS Architecture (Wittman (2018)) 75
4-2 Example of booking arrival curves for leisure and business demand used in PODS . . . 76
4-3 Comparison of actual WTP-distribution in Network D11 with those assumed by the airline RM system for various FRAT5 curves . . . 78
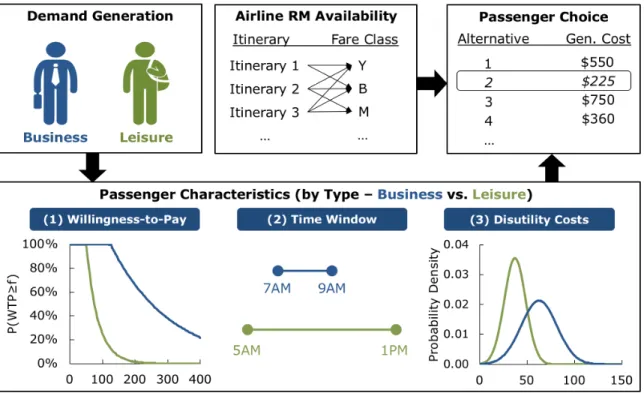
4-4 Schematic overview of the passenger generation and choice process . . 80
4-5 Structure of PODS Network D11 . . . 81
4-6 Available seat miles and fleet mix by airline in Network D11 . . . 82
4-7 Average and range of fare ratio 𝑓𝑖/𝑓11 in network D11 . . . 82
4-8 Structure of PODS Network U10 . . . 83
4-9 Available seat miles and fleet mix by airline in Network U10 . . . 84
4-10 Average and range of fare ratio 𝑓𝑖/𝑓10 in network U10 . . . 84
5-1 Revenue results when both airlines adopt continuous pricing symme-trically (either ProBP or UDP) in Network D11 . . . 89
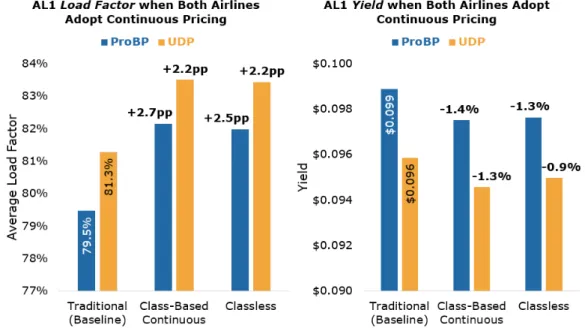
5-2 AL1 load factor and yield when both airlines adopt continuous pricing symmetrically in Network D11 . . . 90
5-3 AL1 average fare paid by time frame when both airlines adopt conti-nuous pricing (ProBP) symmetrically in Network D11 . . . 90
5-4 Change in AL1 bookings and % change in AL1 cumulative revenue when both airlines adopt continuous pricing (ProBP) symmetrically in Network D11 . . . 91
5-5 AL1 revenue when both airlines adopt continuous pricing symmetri-cally (ProBP) for different number of fare classes in Network D(11-16-21) 92 5-6 AL1 % change in revenue and percentage points change in load factor of class-based continuous RM versus traditional RM with same number of fare classes . . . 93
5-7 AL1 percentage points change in load factor and % change in yield when both airlines adopt continuous pricing symmetrically in Networks D11-16-21 . . . 94
5-8 AL1 % change in revenue compared to traditional baseline (ProBP and UDP) for different demand levels (±10%, ±20%) . . . 96
5-9 AL1 change in load factor (in pp) and % change in yield compared to traditional baseline (ProBP and UDP) for different demand levels (±10%, ±20%) . . . 96
5-10 AL1 average fare paid by time frame when both airlines adopt continu-ous pricing symmetrically in high-demand scenario (+20%) in Network D11 . . . 97
5-11 Revenue results when only AL1 adopts continuous pricing asymmetri-cally (either ProBP or UDP) in Network D11 . . . 99
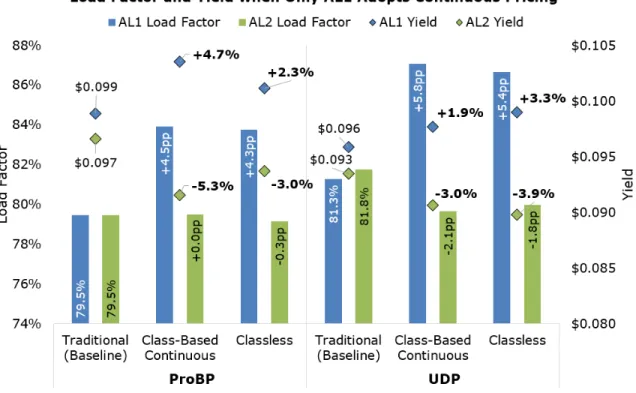
5-12 Load factor and yield when only AL1 adopts continuous pricing asym-metrically (either ProBP or UDP) in Network D11 . . . 99
5-13 Average fare paid by time frame when AL1 adopts class-based conti-nuous ProBP asymmetrically in Network D11 . . . 100
5-14 Change in bookings and % change in cumulative revenue when AL1 adopts class-based continuous ProBP asymmetrically in Network D11 101
5-15 Change in AL2’s bookings by fare class when AL1 adopts continuous pricing (ProBP) asymmetrically in Network D11 compared to traditi-onal RM baseline . . . 101
5-16 % Revenue change compared to symmetric baseline when AL1 adopts continuous pricing (ProBP) for various demand levels in Network D11 102
5-17 Percentage points load factor and % yield change when AL1 adopts continuous pricing (ProBP) for various demand levels in Network D11 103
5-18 Average fare paid by time frame when AL1 adopts classless ProBP asymmetrically in high-demand scenario (+20%) in Network D11 . . 104
5-19 % Revenue change compared to symmetric traditional RM baseline when all airlines adopt continuous pricing in Network U10 . . . 105
5-20 Percentage points load factor change compared to symmetric traditio-nal RM baseline when all airlines adopt continuous pricing in Network U10 . . . 105
5-21 % Yield change compared to symmetric baseline when all airlines adopt continuous pricing in Network U10 . . . 106
5-22 % Revenue change compared to symmetric baseline when only AL1 adopts continuous pricing in Network U10 . . . 107
5-23 Percentage points load factor change compared to symmetric baseline when only AL1 adopts continuous pricing in Network U10 . . . 107
5-24 % Yield change compared to symmetric baseline when only AL1 adopts continuous pricing in Network U10 . . . 108
6-1 Comparison of traditional class-based and continuous pricing . . . 111
6-2 Distribution of fare ratios 𝑓𝑖/𝑓𝑄 for 11, 16 and 21-class fare structures 113
6-3 Revenue when AL1 adopts class-based continuous ProBP compared
to the symmetric traditional RM baseline for various numbers of fare classes (11-16-21) . . . 115
6-4 Revenue when AL1 adopts classless ProBP compared to the symmetric traditional RM baseline for various numbers of fare classes (11-16-21) 115
6-5 Percentage points change in load factor and % change in yield when only AL1 adopts continuous pricing (ProBP) for various numbers of fare classes. . . 116
6-6 Average fare paid by time frame when AL1 adopts class-based conti-nuous ProBP asymmetrically in Network D(11-16-21) . . . 117
6-7 Change in AL2 bookings and % change in cumulative revenue by time frame when AL1 adopts class-based continuous ProBP in Network D(11-16-21) . . . 117
6-8 Revenue compared to symmetric traditional RM baseline when AL1 adopts continuous pricing (ProBP) and AL2 responds by lowering WTP-estimates . . . 119
6-9 Percentage points change in load factor and % change in yield when AL2 responds to continuous pricing (ProBP) by lowering its WTP-estimates. . . 120
6-10 Average fare paid by time frame when AL1 adopts class-based continu-ous ProBP and AL2 responds by lowering its WTP-estimates (FRAT5c-d-e) . . . 121
6-11 Revenue compared to symmetric traditional RM baseline when AL1 repeatedly matches AL2’s lower WTP-estimated in Network D11. . . 122
6-12 Average fare ratio 𝑓𝑖/𝑓𝑄of the original fare structure and three discount
schemes in Network D11 . . . 123
6-13 Revenue compared to symmetric traditional RM baseline when AL1 adopts continuous pricing (ProBP) and AL2 responds by discounting FC1-FC4. . . 124
6-14 Percentage points change in load factor and % change in yield when AL1 adopts class-based continuous ProBP and AL2 responds by lowe-ring FC1-FC4 fares . . . 125
6-15 Average fare paid by time frame when AL1 adopts class-based conti-nuous ProBP and AL2 responds by lowering FC1-FC4 fares . . . 126
6-16 Revenue compared to symmetric traditional RM baseline when AL1 repeatedly matches AL2’s discounted fares (FC1 - FC4) . . . 126
List of Tables
1.1 Boston-Detroit fare structure for Delta Air Lines (September 2013) (Belobaba, 2016a) . . . 21
3.1 Illustration of Q-forecasting method for FRAT5 = 1.5 and 𝑓𝑄= $100 55
3.2 Calculation of the critical EMSR or EMSRc value (capacity 𝑐𝑙 = 100) 61
5.1 Summary of symmetric PODS simulation runs in Network D11. . . . 88
5.2 Summary of asymmetric PODS simulation runs in Network D11 . . . 98
6.1 Summary of PODS simulation runs where AL1 asymmetrically adopts continuous pricing for various numbers of fare classes . . . 114
6.2 Summary of PODS simulation runs where AL1 adopts continuous pri-cing and AL2 responds by redupri-cing its WTP-estimates . . . 118
Chapter 1
Introduction
1.1
Overview of Airline Revenue Management and Pricing
Prior to the deregulation of the US airline industry in the late 1970s, the Civil Aero-nautics Board (CAB) enforced airlines to charge the same price for air travel between each origin and destination city-pair. These government-mandated fare levels were set using a mileage-based scheme, such that two O-D markets with equal distance would be charged the exact same price (Belobaba, 2016a). Due to the lack of com-petition in this highly regulated era, this mileage-based pricing approach ensured airlines to remain profitable by quoting the few privileged travelers the same high fares. Such mileage-based pricing schemes completely ignored the fact that different origin-destination (O-D) markets can have distinct demand and cost characteristics. Each O-D market serves a variety of passenger types, each with their own price elasti-city, time sensitivity and maximum “willingness-to-pay” (WTP). Before deregulation, airlines were limited in their ability to target specific customer segments as they were only allowed to offer two price levels corresponding to first and economy class.
Deregulation revolutionized the airline industry as it led to a wide range of new products, fares and schedules in the marketplace. Airlines overhauled their business models and the number of available itineraries increased as point-to-point systems
were replaced by hub-and-spoke networks. Not only did this intensify competition among airlines, the emergence of lower fares also opened up air travel to a whole new segment of the population that could previously not afford to fly. In an attempt to target this new demand segment while maximizing revenue, airlines started practicing differential pricing.
Within each origin-destination market and service cabin (e.g. economy, business and first class), airlines began to offer different fare products, each with their own price point, advance purchase requirement and additional fare restrictions. Typically, such fare restrictions include a round trip purchase requirement, a minimum stay requirement, cancellation or change fees and non-refundability conditions (Wittman,
2018). These restrictions or fare fences enable airlines to segment demand: the most expensive fare class generally has no restrictions, while the lowest fare class is typically heavily restricted.
Table 1.1 provides an example of such a restricted fare structure offered by Delta Air Lines in the Boston-Detroit market in September 2013. The restrictions help to “force” restriction-averse business passengers with a high willingness-to-pay to buy-up to more expensive fare classes, while still offering discounted fares to restriction-tolerant leisure passengers with a lower willingness-to-pay (Bockelie, 2019). For example, a passenger who wants to book a seat in the Boston-Detroit market one week before departure and does not want to spend a Saturday night at the destination will have to spend at least $603, while a passenger who books one month in advance and is willing to meet all the restrictions can travel at the lowest fare of $205.
The pricing department of an airline frequently revises their fare products for each market based on the competitive landscape. Once these updated fare structures are re-filed with a central distribution agency, such as the Airline Tariff Publishing Company (ATPCO), they generally become visible to all other airlines. Since the marginal cost of accommodating an additional passenger is typically very low in this capital-intensive industry, airlines have historically focused on retaining market share
by responding to any competitor’s pricing actions. For this reason, it has become the norm rather than the exception for airlines to “match” their competitors’ fare structures. Due to the enormous volume of new fare filings each day, IT vendors such as Sabre have developed automated fare management systems which detect changes in fare structures and allow pricing analysts to respond at the click of a button ( Vi-nod, 2010). In the earlier Boston-Detroit example (Table 1.1), Delta relaxed its fare structure effective the same day JetBlue introduced non-stop service in this market: the Saturday night minimum stay requirement was eliminated and the lowest V-class fare dropped significantly from $205 to $69 in response to JetBlue’s entry.
Fare Class One Way Fare Advance Purchase Minimum Stay Change Fee Refund Round Trip Required
Y $936 None None None Yes No
B $794 None None $200 No No
M $603 None None $200 No No
H $501 14 days None $200 No No
K $365 None Sat. Night $200 No Yes
T $249 7 days Sat. Night $200 No Yes X $215 14 days Sat. Night $200 No Yes V $205 21 days Sat. Night $200 No Yes
Table 1.1: Boston-Detroit fare structure for Delta Air Lines (September 2013) ( Belo-baba, 2016a)
Differential pricing enables airlines to charge different fares to different passengers for the same physical seat on a flight leg. However, differential pricing by itself is not sufficient to maximize revenue as capacity on a flight leg is constrained. Leisure travellers typically plan their trips several months in advance, while business passen-gers could book up to the day before departure to make it to a last-minute meeting. Without the intervention of a “seat inventory control” mechanism, leisure travellers purchasing discount fares could displace business passengers who would be willing to pay much more for the same seat. Even though this would result in very high load factors, this first-come first-serve approach is clearly suboptimal from a revenue
perspective. On the other hand, an airline’s inventory is perishable in the sense that every empty seat will go unsold once the aircraft takes off. Given the low marginal cost of accommodating an additional passenger, airlines are often incentivized to fill as many seats as possible, even at the deep-discount fares.
It is in making this trade-off between minimizing the spill of high-fare late-arriving business passengers to competitors and minimizing the opportunity cost of spoiled seats that revenue management (RM) systems have become indispensable. RM sys-tems “protect” seats for high-fare passengers by closing down lower fare classes, while limiting the number of perished seats on the day of departure. American Airlines attributed an annual revenue benefit of $500 million to their first in-house RM sy-stem, DINAMO (Smith et al.,1992), while empirical studies and simulations results have shown consistent gains of 4-6% (Belobaba, 1989). Modern revenue management systems consist of two main building blocks: a forecasting module and an optimizer. Based on historical booking data, a demand forecast is generated for each origin-destination itinerary fare class (ODIF) combination for every future departure date. These forecasts are then fed into a mathematical optimization model to determine the revenue-maximizing fares to offer at each point in time throughout the booking period.
The earliest RM systems in the 1980s and 1990s were built around the highly re-stricted fare structures of that time (Belobaba, 2011). The forecasting and optimi-zation techniques were designed based on the assumption of “independent” demand for each fare class, not accounting for potential sell-up or buy-down of passengers between fare classes. Even though this assumption never really held in reality, it pro-ved to be accurate enough when restrictions preventing diversion across fare products were in place. However, with the rise of low-cost carriers (LCCs) in the 2000s and the movement towards simplified fare structures, without round-trip and minimum stay requirements, legacy carriers were no longer able to effectively segment busi-ness and leisure demand. Furthermore, the proliferation of online travel agents and low-cost meta-search websites provided increased transparency of the available travel
options, reducing the conditional willingness-to-pay of travellers. The long-standing assumption of independent demand broke down, demand forecasts “spiralled-down” to lower fare classes and revenues plummeted as RM systems faltered. This shortco-ming of traditional RM systems triggered researchers to develop new forecasting and optimization techniques for unrestricted fare structures.
In the extreme case of a fully unrestricted fare structure, where the only differentiating factor between fare products is their price, rational passengers will always choose to purchase the lowest available fare. For the airlines, this essentially reduces the RM problem to determining which single price point out of the set of pre-filed fares to offer at each point in time. In recent years, airlines have raised the question what the potential revenue gain could be from offering any fare from a continuous range of prices, rather than being bound to a discrete number of pre-specified price points.
Even though airlines can update their fares several times per day, the true revenue-maximizing price might still fall in-between the gap or outside the range of these published fares (Fiig et al.,2016). Theoretically, one would expect continuous pricing to increase revenues by improving pricing granularity. One might wonder what the role of pre-filed fares will be and whether or not airlines will entirely abandon the concept of fare classes if continuous pricing breaks through.
The reasons why these continuous pricing mechanisms have not yet been widely adop-ted in today’s risk-averse airline industry are twofold. First, the performance and practical implications of these novel pricing methods remain yet to be understood in realistic competitive scenarios and require further exploration in simulation environ-ments. RM practitioners have expressed some concerns that continuous pricing could eventually trigger a “race-to-the-bottom”, hurting the industry as a whole.
Even if these new methods were shown to outperform traditional RM systems, in-corporating them within today’s rigid legacy distribution systems would remain a challenge. Continuous pricing would affect several of the airline’s downstream
com-mercial processes that were originally designed around the concept of pre-specified booking classes: pricing, ticketing, revenue management, revenue accounting, revenue integrity and interline settlement (Fiig et al.,2016).
However, the advent of IATA’s New Distribution Capability (NDC) could alleviate these barriers to adoption of continuous pricing. With NDC, a novel distribution standard, prices will no longer need to be associated with booking classes, but can be generated on-the-fly for each individual booking request (Westermann,2013). As an intermediate step, airlines are likely to extend their existing RM systems to allow for the distribution of continuous prices, while still relying on pre-filed fares. In the future, the concept of fare classes might eventually become obsolete as airlines adopt so-called classless revenue management systems.
Before airlines become scientifically and technologically capable of fully abandoning the concept of pre-defined price points, researchers first need to adapt existing “class-based” forecasting and optimization techniques to their “classless” counterparts. Since these methods no longer optimize based on fixed pre-defined fares, the additional degrees of freedom from selecting any continuous price will likely increase the mathe-matical complexity of these algorithms. Some industry stakeholders remain skeptical whether the added value from classless RM will outweigh the associated reduction in computational tractability.
Furthermore, classless RM will introduce new practical challenges for airlines, such as integration of the pricing and revenue management business processes (Westermann,
2006). Instead of determining the optimal inventory control policy given a set of dis-crete fare classes, RM and pricing analysts will need to determine one (unsegmented) or multiple (segmented) continuous price points based on willingness-to-pay forecasts of each passenger segment. Since the willingness-to-pay of passengers is generally conditional on the available travel alternatives, incorporating competitive informa-tion such as fares and schedules could increase the benefit of classless RM.
1.2
Legacy Distribution Systems: Limitations for Airline RM
Travelers can purchase air fares both through the airline’s own direct channels, as well as through a variety of third-party indirect channels. The direct channels consist of the airline’s website, call center and sales offices. When a booking request comes in through one of these direct channels, the airline’s own reservation system (or passenger service system) is queried to determine the available travel alternatives. Indirect channels such as brick-and-mortar travel agencies, online travel agents (OTAs) and meta-search websites typically connect to an intermediate content aggregator, such as the Global Distribution Systems (GDS), to make travel bookings.
When a booking request is placed through the GDS, information is retrieved from three distinct sources of data, as shown in Figure 1-1. Schedules and filed fares are exchanged through different third-party data sources, such as the Official Airline Guide (OAG) and ATPCO, while “seamless connectivity” between GDS networks and the airline reservation systems provides real-time fare class availability. This limited information exchange with the traveller essentially caused airlines to compete primarily on price and travel time and has resulted in further commoditization of air travel (Westermann,2013).
Global distribution systems record availability in each of up to 26 possible reservation booking designators (RBDs), represented by the alphabetic characters A through Z. Even though multiple fare products with different prices can be associated with the same RBD (Fiig et al., 2018), the traditional GDS systems do not allow for distribution of continuous prices. The direct channels, which are not tied to the rigid GDS framework, provide more flexibility for the airlines to quote any continuous price, as well as display “bundled” offers of flights and ancillary services. In 2016, approximately 50% of all global air bookings were made through GDS-based channels (Taubmann, 2016), but airlines increasingly attract more passengers to their direct or “GDS-bypass” channels to avoid additional distribution charges.
tra-vel agents and airline reservation systems using the EDIFACT communication stan-dard. The EDIFACT framework dates back to the pre-internet era when data trans-mission was much more expensive than today. Through a series of highly standardized request-and-response messages, individual pieces of information are transmitted bet-ween the airline and a third-party travel retailer (Wittman, 2018). For example, the GDS retrieves fare class availability for a specific itinerary by sending out a product availability offering request (PAOREQ), to which the airline’s system returns a PA-ORES response message. Once availability has been determined, prices are obtained using the itinerary pricing request and response (ITPREQ/ITPRES) messages. This standardized communication protocol limits the amount of information that can be disseminated through GDS-based channels to a pre-specified number of fields. For example, personalized information on the traveler making the request (e.g. frequent flyer status) is generally not visible to the airline. This, in turn, limits the airline’s ability to generate customized dynamic prices on a transactional basis. With tradi-tional indirect distribution channels, airlines can only “guess” the trip purpose based on certain characteristics of the request, such as days to departure, point of com-mencement (POC) and the number of days spent at the destination (Westermann,
2013).
1.3
Potential of IATA’s New Distribution Capability
The up-and-coming New Distribution Capability (NDC) provides the technological capability to overcome several of the aforementioned hurdles and could potentially trigger a new wave of innovation in airfare distribution. NDC is a modern communica-tion protocol based on the Extensible Markup Language (XML), originally developed in 2010 by Farelogix and standardized by the International Air Transportation Asso-ciation (IATA) in 2012.
Under IATA’s NDC, airlines can gain full control over the offer generation and pricing process, rather than working with GDS systems as content aggregators (Westermann,
2013). Instead, the GDS will simply transfer a shopping request from a travel agent to the airline, which then determines the best possible offer(s) and price(s) to quote based on the available information for that specific request. This will allow airlines to break loose from the rigid request-and-response framework of EDIFACT, which has become the main barrier to innovation in revenue management and pricing.
Unlike with EDIFACT, an NDC shopping request is no longer limited to itinerary and travel date, but can include additional features including ancillary services, and even optional identifying information, such as trip purpose and frequent flyer number. The more information the passenger chooses to provide, the more personalized the offer can be. Furthermore, the NDC shopping requests and generated offers no longer need to be tied to a distinct booking designator. This, in turn, eliminates the need for airlines to file fare products with pre-defined restrictions and prices in advance with ATPCO.
Clearly, IATA’s NDC could potentially pave the way towards real-time continuous pricing and dynamic offer generation. The goal of this thesis is to assess the compe-titive impacts of continuous pricing applied to the flight only (i.e. in the absence of ancillary services).
1.4
Research Objectives and Contributions
This thesis provides a comprehensive overview of the performance of various continu-ous pricing mechanisms in realistic competitive settings. Previcontinu-ous studies have shown that these methods generally result in revenue gains when adopted by all competing airlines, i.e. under symmetric competition (Liotta, 2019). Since the adoption rate of NDC-enabled technologies will vary among different air carriers, special attention is devoted to analyzing the “first-mover advantage” of continuous pricing mechanisms in this thesis: What happens under asymmetric competition when only one air car-rier adopts continuous pricing, while all other airlines in the industry stick to their traditional class-based RM systems? How does this impact the performance of both the first-mover and the remaining traditional RM airlines in terms of revenue, load factor, yield and fare class mix? How can the traditional airlines change the settings of their class-based RM systems or their fare structures as to counteract the effects induced by their continuous pricing competitor? These are some of the urgent que-stions posed by several RM executives that remain relatively unanswered to date. The main contributions of this thesis can be summarized through the following four topics:
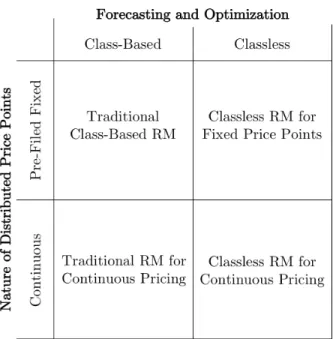
1) First, this thesis presents a complete mathematical walk-through of the conti-nuous pricing methods implemented in the Passenger Origin-Destination Simu-lator (PODS). Depending on whether or not the forecasting and optimization techniques rely on a discrete number of fare classes, these methods are referred to as either class-based continuous or classless RM, as depicted in Figure 1-2. The extension of traditional class-based RM systems to class-based continuous pricing is rather straight-forward, since the underlying mathematics remains untouched. Nevertheless, these methods are of more practical interest to airli-nes in the short-term as they can be easily integrated with existing traditional RM systems. The classless algorithms, on the other hand, are fundamentally different from today’s class-based heuristics and would require a major overhaul of several internal and external business processes.
Figure 1-2: Framework for traditional and continuous pricing methods developed in the Passenger Origin-Destination Simulator (Liotta,2019)
2) All of the considered methods result in a single continuous price offered at each point in time, regardless of whether the customer is travelling for leisure or bu-siness purposes. These methods are said to be unsegmented in the sense that they are blind to the passenger’s characteristics. Another weakness of these methods is that they do not acknowledge that customers can choose between different airlines, but instead assume a monopolistic setting in which all cus-tomers are loyal. Some initial suggestions are made to extend these classless techniques to multiple segmented price points and to incorporate competitive fare information.
3) The continuous pricing methods are tested in a wide range of duopolistic and oligopolistic competitive scenarios in the Passenger Origin-Destination Simu-lator (PODS). PODS is a complex agent-based simulation model, originally developed at Boeing, that mimics the interactions between passenger choice be-havior and airline revenue management systems. It is shown that continuous pricing methods generally result in revenue gains over their traditional counter-parts, with the benefit being largest for the first-mover. Similar to the PFDyna
heuristic (Wittman et al., 2018), the mechanisms driving these revenue gains are driven by forecast spiral-up through stimulation and capture of high-yield passengers from competitors.
4) Finally, several countermeasures for traditional RM airlines to respond to a continuous pricing competitor are explored. For example, a traditional class-based airline could increase its number of fare classes to reduce the gap between successive price points, improving its pricing granularity. Similarly, it could adjust its pre-filed fares or lower its conditional willingness-to-pay estimates in response to the fares offered by the continuous pricing airline. The effectiveness of these actions are analyzed in this thesis.
1.5
Thesis Outline
The remainder of this thesis is organized into the following six chapters. Chapter 2
provides a literature review of previous revenue management developments relevant to this thesis. Special attention is devoted to dynamic pricing mechanisms and the recent trend towards “competitor-aware” RM systems. Even though the RM methods covered in this thesis do not directly account for competitive information, integrating other airline’s fares into the continuous pricing methods could further enhance their performance. A detailed overview of both the class-based ands classless continuous pricing mechanisms is given in Chapter 3. Chapter 4 discusses the architecture of the PODS simulation software as well as the passenger generation and choice model. Furthermore, the competitive airline networks used for testing purposes are presen-ted. The performance of the continuous pricing heuristics, developed in Chapter 3, are analyzed in Chapter 5 for both the symmetric (when used by all airlines) and asymmetric (when used by one airline) configurations. Several competitive respon-ses for traditional RM airlines to counteract the effects of their continuous pricing competitor are explored in Chapter 6. Finally, Chapter7 provides a summary of the research findings and suggests possible next steps to extend the continuous pricing heuristics.
Chapter 2
Literature Review
In this chapter, we present the literature describing the most important breakthroughs within airline revenue management relevant to this thesis. We begin by reviewing the earliest revenue management models, which were based on the assumption of independent demand across fare classes. We discuss the evolution from leg-based optimization to origin-destination control as airlines shifted from pure point-to-point to hub-and-spoke networks. Leg-based RM systems control availability for each flight leg individually, while network RM systems set availability at the more granular origin-destination path level. We also provide an overview of several forecasting and unconstraining techniques used in this thesis. Next, we review how the forecasting and optimization models based on the independent demand assumption were adapted once low-cost carriers introduced unrestricted fare structures in the 2000s, causing passengers to buy-down to the lowest available fare class.
Finally, we present the most recent literature on dynamic pricing and competitor-aware RM. More specifically, we present a definitional framework for three types of dynamic pricing mechanisms: assortment optimization, dynamic price adjustment and continuous pricing. Competitor-aware RM models, on the other hand, take into the full passenger’s choice set by considering the competitors’ available alternatives, whereas traditional RM typically assumes a monopolistic environment.
2.1
Independent Demand Revenue Management
The earliest practical models for seat inventory control date back to the 1970s, when several airlines introduced discount fares in an attempt to increase revenue from seats that would otherwise go unsold. This idea of selling a shared pool of inventory within the same physical aircraft cabin to both discount and full fare passengers presented airlines with a new problem: Given a demand forecast for both segments, how does one determine the revenue-maximizing number of seats to sell to early arriving, low fare passengers, while protecting the remaining capacity for later booking, full fare passengers? Too aggressive protection would result in empty seats on the day of departure, while too little protection would result in the spill of full fare passengers to competing airlines.
This seemingly easy question has ever since received considerable attention in the operations research literature, especially post-deregulation when the number of fare products increased rapidly and competition fiercened. Initially, revenue management models were based on the assumption of independent demand for each fare class. Under this assumption, a passenger would either decide to fly with a competing ai-rline ot not fly at all if the desired fare product were unavailable, but would never buy-up to a higher or buy-down to a lower fare class. While this proved to be a sufficiently adequate approximation in the presence of stringent restrictions preven-ting diversion between fare classes, the independent demand assumption broke down when LCCs adopted less restricted fare structures in the 2000s. Furthermore, the earliest models optimized seat availability for each leg individually, not accounting for the dependencies between legs. When airlines transitioned from point-to-point to hub-and-spoke systems, “leg-based” systems were extended to “network O-D” models, which maximized revenue over the network as a whole. This chapter provides an overview of the most influential literature within the field of revenue management, ranging from the simplest independent demand leg-based models to more complex O-D control with less restricted fare structures. Recent work on “dynamic pricing” and “competitor-aware” RM are also discussed.
2.1.1
Leg-Based Optimization
Littlewood (1972) devised the very first leg-based booking policy for the case of two nested booking classes. Littlewood’s rule suggests to accept bookings from low fare passengers as long as their fare value exceeds the expected revenue from protecting that seat for future full fare passengers. This has been shown to be a theoretically optimal policy when all discount demand arrives before the full fare passengers in the booking process. Belobaba (1987, 1989) extended this approach to the more general case of multiple nested booking limits by developing a heuristic decision rule, which became widely known as the Expected Marginal Seat Revenue (EMSR) method.
Curry(1990),Wollmer(1992) andBrumelle and McGill(1993) independently derived Optimal Booking Limits (OBL) approaches for the single-leg multiple nested fare class problem, still under the assumption of a low-to-high fare arrival pattern. Belobaba
(1992) further refined the EMSR heuristic to better approximate the characteristics of the OBL solutions. The revised EMSRb heuristic determines “joint” protection levels by aggregating demand distributions across fare classes.
Unlike EMSR, the Optimal Booking Limits (OBL) approaches gained little traction in the industry since they relied on computationally complex convolutions of demand distributions. According toBelobaba(2016b), airlines were practically constrained in terms of computing power in the 1990s and preferred frequent re-optimization of the booking limits with the more tractable EMSRb heuristic over OBL. By simulating their performance in more realistic RM environments with interspersed fare class arrivals, Belobaba (1992) demonstrated that the expected revenue under EMSR and OBL lies within +/− 0.10 percent of each other. As such, mathematically optimal solutions do not necessarily outperform heuristics once the simplifying assumptions which they are based on break down in the stochastic environment airlines operate in. Weatherford and Belobaba (2002) argue that the accuracy of the data inputs to the optimization model, such as mean fare values and demand forecasts by fare class, can have a more critical impact than the actual RM optimization model itself. For example, forecast errors of 25% for each fare class, which are not uncommon in
reality, are shown to result in an expected revenue decrease of 1-2%.
EMSR and OBL are both static methods, in the sense that they determine one set of booking limits based on a forecast of total demand-to-come for all fare classes at a given point in the booking process. Since uncertainty generally decreases as the day of departure approaches, re-forecasting and re-optimizing at certain data collection points (DCP) further improves the revenue performance of these static methods. Dynamic application of these static methods also allows to more closely capture the actual arrival pattern of demand.
In order to fully overcome the limitations of the low-to-high fare arrival assumption,
Lee and Hersh (1993) and Lautenbacher and Stidham (1999) developed optimal dy-namic program (DP) formulations. Unlike the static models, these dydy-namic methods require a forecast of demand by time frame (between successive DCPs) and fare class to account for the interspersion of arrivals. By breaking the booking process into time slices such that the probability of having two or more arrivals within one slice is negligible, these dynamic programs assume a Poisson demand arrival process. The dynamic program solves a recursive Bellman equation backwards from the last day of the booking process to the first, resulting in a matrix of booking limits for each state (𝑥, 𝑡), where 𝑥 corresponds to the remaining capacity on the flight leg and 𝑡 the time slice. Using such DPs in a practical setting has only become feasible with the recent increase in computation power, since they require substantially more arithme-tic operations than the aforementioned staarithme-tic models. Even though DPs theorearithme-tically provide optimal booking limits throughout the whole booking process, they too bene-fit from frequent re-optimization due to imperfect forecasts (Belobaba, 2016b).
Apart from the longer computation time, the DP approach inherently assumes that the variance of the forecasted fare class demand is equal to its mean. As a result, the assumed standard deviation is typically lower than what is observed in practice such that the DP has more certainty of high-fare demand materializing. Diwan(2010) pre-sented a comparative analysis of Lautenbacher’s DP approach and the static EMSRb
method. In the case of low actual demand variability, DP was shown to marginally outperform EMSRb. However, this revenue advantage completely eroded when the actual demand variance increased to more realistic levels.
2.1.2
Origin-Destination Control
The models discussed in the previous section optimize protection levels for each flight leg individually. In a pure point-to-point network without any connecting passengers, these models suffice as there are no interdependencies across legs. However, applying leg-based controls to hub-and-spoke systems, where connecting passengers occupy seats on multiple legs, does not maximize total revenue across the network. Belo-baba(2016a) identifies two reasons why leg-based optimization results in suboptimal solutions from a network perspective:
1. Under leg-based inventory control, a connecting passenger can only book in fare classes that are available on all the legs traversed in the itinerary. As a result, high-demand short-haul flights with no availability in lower fare classes could act as “bottlenecks” to connecting itineraries using that leg. This could lead to potential revenue losses when long-haul connecting passengers, with a higher network contribution than local passengers in higher fare classes, are unable to obtain their desired fare class.
2. Even within the same fare class, leg-based systems are unable to distinguish requests from passengers travelling in different origin-destination itineraries. An airline using leg-based RM cannot control whether two seats are sold to a connecting passenger (A-B-C) or to two individual local passengers (A-B and B-C). Since the sum of two local fares is generally higher than the connecting fare in the same fare class, two local passengers would generate more revenue.
These limitations of leg-based models triggered the development of more complex systems which control availability for each origin-destination itinerary and fare class (ODIF) separately. In 1983,Smith and Penn(1988) from American Airlines designed
one of the first O-D heuristics by mapping ODIFs into “virtual buckets” based on their total network revenue value. An existing leg-based method, such as EMSR, is then applied to determine booking limits for each of these virtually nested buckets. By grouping ODIFs based on total revenue, connecting itineraries are generally mapped into higher virtual buckets. This heuristic is therefore known as “Greedy Virtual Nesting” (GVN) since it tends to prioritize connecting itineraries over local passengers, even when the latter would generate more revenue.
The original greedy approach was further refined by incorporating the displacement cost of connecting passengers on other legs (Smith and Penn, 1988). This “Displace-ment Adjusted Virtual Nesting” (DAVN) method thus optimizes based on actual net-work contribution instead of the total fare value. Williamson (1992) presents several approaches to calculate these displacement costs in practice. A common approach relies on solving a deterministic network linear program (LP), originally proposed by Glover et al. (1982), to calculate an optimal seat allocation based on forecasts of bookings-to-come and fare values by ODIF. Since this deterministic LP does not account for demand variability, the resulting seat allocation policy does not perform particularly well when used to directly control ODIF availability. However, the shadow prices of the capacity constraints, which are a by-product of the LP optimization, can be used to estimate the displacement cost for each flight leg. The shadow price of a leg, alternatively known as the marginal cost of capacity or bid price, corresponds to the decrease in network revenue if one unit of capacity were removed from that leg. In other words, it represents the threshold value a passenger must pay to secure the next seat on a flight leg. Another way to approximate the displacement cost is simply by calculating the expected marginal seat revenue of the last seat, also called the critical EMSR or EMSRc value.
This eventually gave rise to a new type of OD-control, based on bid prices, as opposed to the traditional booking limit approaches. Under additive bid price control, an ODIF is available as long as its fare value exceeds the sum of the bid prices of all traversed legs. Bratu (1998) developed a Probabilistic Bid Price (ProBP) method
which accounts for demand variability, unlike the deterministic LP. ProBP iteratively prorates the ODIF fares to the traversed legs based on the ratio of their bid prices, and applies EMSR to determine a new set of bid prices within each iteration. Once the bid prices converge, additive bid price control is used.
Talluri and van Ryzin(1998) present a general dynamic programming formulation for the network RM problem. However, exact network DPs are of little practical relevance since they suffer from the “curse of dimensionality” (Lapp and Weatherford, 2014). As the state space grows exponentially with the vector 𝑥 = (𝑥1, 𝑥2, . . . , 𝑥𝐿) of leg
capacities, the problem becomes unsolvable for any decently sized network. For this reason, several heuristic approaches have been proposed which decompose the network DP into solvable single-leg DPs by introducing displacement costs for connecting itineraries (Rauch et al., 2018; Talluri and Van Ryzin, 2004). By considering the displacement costs on other legs, the DPs calculate the expected maximum network contribution for each state (𝑥𝑙, 𝑡), where 𝑥𝑙 denotes the remaining capacity on flight
leg 𝑙 and 𝑡 time time slice. By solving these independent DPs, a bid price matrix is obtained for each flight leg in the network.
2.1.3
Demand Forecasting and Unconstraining
Even though most of the literature in revenue management has been devoted to optimal inventory control methods, the performance of these mathematical models heavily relies on accurate demand forecasts in practical settings. A forecasting mo-del estimates future demand based on historical booking data, either at the flight leg/fare class level or the OD itinerary/fare class level depending on the granularity of the inventory controls (leg-based vs. network optimization). Under the assumption of independent demand across fare classes and itineraries, a standard pick-up fore-casting technique has proven to work effectively, as described by Littlewood (1972). The pick-up model calculates the expected demand-to-come until departure from the average incremental number of bookings observed on similar historical departure days of the same flight. This pick-up is then added to the current number of
bookings-in-hand to obtain an estimate of total demand. L’Heureux (1986) refined this approach by calculating a separate pick-up for each time frame independently, instead of one aggregate pick-up. As such, the most recent available booking data from flights that have not yet departed can be used, enabling the forecast to better follow trends and seasonality patterns.
Since the observed number of bookings in a fare class can be constrained by the corre-sponding RM booking limits, actual demand will often be greater than the observed bookings. When a fare class is closed down, the remaining demand for that particu-lar class is turned away and is not recorded in the historical booking data. In such cases, the booking data does not truly reflect actual demand, but rather serves as a lower bound. In order to convert the observed bookings into an estimate of actual demand, the historical booking data needs to be unconstrained or detruncated prior to forecasting. Weatherford and Pölt (2002) provide a comprehensive comparison of six different unconstraining techniques, ranging from naïve approaches to statistical methods such as projection detruncation (PD) and expectation maximization (EM). Their simulation results show that the revenue benefit from the more robust PD or EM detruncators can be as significant as that of moving from a leg-based to a network optimizer.
2.1.4
RM Methods for Unrestricted Fare Structures
Both the optimization and forecasting methods discussed so far were built around the assumption of independent demand across fare classes. Under traditional fare structures with effective restrictions in place, each fare product was purchased by a particular passenger segment and diversion between fare classes was limited. With the introduction of less restricted fare structures by LCCs in the 2000s, fare fences such as the Saturday night minimum stay were relaxed and business passengers no longer had an incentive to sell up to more expensive fare products. As a result, fewer bookings were recorded in the upper fare classes, demand at these higher fares was underforecasted and more seats were made available to less expensive fare classes.
This cycle of diversion became well-known as the spiral-down effect (Cooper et al.,
2006): revenues plummeted and load factors sky-rocketed as airlines filled their planes with low-yield passengers. With passengers relentlessly buying down to the cheapest available fare class, the independent demand assumption broke down and standard forecasting and optimization techniques were no longer effective.
As a short-term solution, airline RM analysts contained the damage by manually overriding booking limits to counteract the spiral down effect. Several decades of scientific research were suddenly questioned as airlines resorted back to “rule-based” RM from the 1980s (Belobaba, 2011). Researchers from academia, software vendors and airlines united their forces to develop new RM models that explicitly accounted for demand dependence between fare classes. Instead of simply forecasting demand based on what passengers purchased in the past, forecasts for unrestricted fare structures had to consider what passengers would be willing-to-pay.
Belobaba and Hopperstad(2004) developed the “Q-forecasting” methodology for fully unrestricted fare structures, which incorporates a WTP-distribution of passengers ar-riving over the booking horizon. Passengers booking far in advance generally have a lower WTP, and thus a lower probability of sell-up to higher fare classes, than passengers arriving closer to departure. Q-forecasting first determines the total po-tential demand at the lowest published fare (termed Q-fare) by dividing the number of observed bookings at each fare by a sell-up probability to that fare. The obtai-ned “Q-equivalent” bookings thus represent the total estimated demand that would be willing to purchase the lowest filed fare. The same sell-up probabilities are then used to repartition the Q-equivalent demand into the original fare classes to obtain a demand forecast by class, conditional on each lower class being closed. While Q-forecasting has widely been accepted among RM practitioners, the estimation of passengers’ WTP remains an active research area due to the sparseness and volatility of sell-up behavior in actual booking data. Boyer (2010) developed several methods to estimate sell-up probabilities from historical booking observations by aggregating data across markets.
In reality, fare structures are never completely unrestricted but maintain some de-gree of segmentation power. In such “semi-restricted ” fare structures, a fraction of yieldable passengers will buy-up to higher fares to avoid restrictions on lower clas-ses, while the remaining priceable demand continues to purchase the lowest available fare class. Boyd and Kallesen (2004) proposed a “hybrid forecasting” (HF) approach which produces separate forecasts for both priceable (or price-oriented) and yieldable (or product-oriented) demand. Standard independent demand forecasting methods can be used for the yieldable portion, while priceable demand is estimated with a Q-forecast. Carrier and Weatherford (2015) implemented a choice-based forecasting methodology using a multinomial logit (MNL) model and tested its performance in PODS. The MNL forecaster outperformed standard forecasting techniques in simula-tion tests, but fell short of Hybrid Forecasting in a semi-restricted fare structure.
Even if the forecaster is able to accurately capture the interdependencies of demand across fare classes, the optimizer needs to be adjusted to account for the propensity of passengers to buy-down to the lowest available fare class. Fiig et al. (2010) and
Walczak et al. (2010) developed the marginal revenue (MR) transformation which converts the fares and demands of a general discrete choice model into an equivalent independent demand model. As such, the traditional static and dynamic optimization methods developed under the assumption of independent demands could continue to be used in less restricted fare structures. Through a process known as fare adjust-ment, the optimizer is fed with the expected marginal revenue per incremental unit of demand from opening an additional fare class. By considering the marginal re-venue rather than actual filed fare value, fare adjustment accounts for the potential buy-down effect when opening lower fare classes.
2.2
Dynamic Pricing in Airline RM
In recent years, the term “dynamic pricing” has frequently been used in the airline RM literature, often in different contexts with incongruous meanings. Fiig et al. (2016) define it as the “dynamic calculation of the optimal price, taking into account the
airline’s strategy, customer-specific information, and real-time alternatives”, while
Kumar et al. (2018) refer to it as “dynamically varying prices over a continuous interval rather than opening and closing fare classes”. In order to fill in the lack of a clear and consistent definition,Wittman and Belobaba(2019) proposed a definitional framework for dynamic pricing mechanisms in the airline industry. Wittman and Belobaba (2018) define dynamic pricing as “charging different customers different prices for the same product, as a function of an observable state of nature”.
As illustrated in Figure 2-1, a firm can choose from three mechanisms to practice dynamic pricing: assortment optimization, dynamic price adjustment and continuous pricing. These mechanisms may be used to adjust prices less frequently (e.g. daily or weekly), or at the limit on a transactional and customized basis. In assortment optimization, the optimal fare(s) to offer are selected from a finite set of pre-defined price points. A firm may decide to frequently update this set of possible prices depending on the market conditions, but cannot deviate from the pre-filed fares at the moment of transaction. Per this definition, it is clear that traditional airline revenue management and pricing as discussed so far belongs to this category. With dynamic price adjustment and continuous pricing, firms are no longer limited to distributing a discrete number of fares.
A firm practicing dynamic price adjustment first selects a fare from a pre-defined set of price points as in assortment optimization, but then provides discounts or incre-ments to this fare based on additional contextual information (e.g. passenger type, frequent flyer status, competitors’ fares,...). Such dynamic price adjustment has re-ceived significant interest from the industry, since it integrates well with traditional RM science and does not require a complete overhaul of existing systems which rely on the existence of fare classes. ATPCO’s Dynamic Pricing Working Group com-prised of several airlines, GDSs and industry stakeholders recently collaborated on a new technological standard for dynamic pricing engines (DPEs) (Dezelak and Ratliff,
Figure 2-1: Dynamic pricing mechanisms in the airline industry (Wittman and Belo-baba, 2019)
In a series of three papers, Wittman and Belobaba (2017a,b, 2018) gradually deve-loped several practical dynamic price adjustment heuristics of increasing complexity. After identifying a passenger’s trip purpose, the Probabilistic Fare-based Dynamic Availability (PFDyna) heuristic computes the optimal mark-up for business travel-lers and discount for leisure passengers as to maximize net contribution. Simulation results in PODS showed that PFDyna could increase revenue by up to 4% over a tra-ditional RM baseline, assuming a perfect identification accuracy. Three mechanisms driving this revenue gain were identified inWittman(2018): (1) yield increase due to buy-up of business passengers, (2) stimulation of new leisure bookings by providing discounts in higher fare classes and (3) forecast spiral-up which in turn results in stronger protection of seats for the upper booking classes.
Using a locational choice model to capture passenger departure time preferences,
Wittman et al.(2018) extended the PFDyna heuristic to simultaneously price multiple substitutable flights rather than optimizing the fare for each flight independently. However, the marginal revenue benefit from the simultaneous pricing model over the flight-by-flight DP approach was found to be less than 1%, even under the very optimistic assumption that the airline had perfect knowledge of the actual underlying
departure time preference distribution and the value-of-time disutilities per passenger type. In terms of practical implications, this insight suggests that the independent flight-by-flight approach is able to extract most of the gains from dynamic pricing, such that investing in a more complex simultaneous dynamic pricing model might not be justified. The continuous pricing mechanisms explored in this thesis will also optimize each flight leg independently without considering substitutability of different itineraries and departure times (i.e. demand is independent across itineraries).
Fiig et al. (2016) presented a rules-based DPE that adjusts the price by comparing the perceived price of the airline’s most attractive offer with that of the competition. The perceived price or total generalized cost is obtained by adding disutility costs from path quality (direct vs. connecting), schedule quality and fare restrictions to the actual monetary fare value. The details on how the price adjustment is computed is proprietary to Amadeus, which is currently commercializing its DP product. As-suming perfect knowledge of the mean disutility parameters for leisure and business passengers, the airline adopting the rules-based DPE saw a revenue gain of approxi-mately 6% when simulated in a realistic two-airline network. Interestingly, when two DPE airlines competed head-to-head, these revenue gains persisted and were split among both airlines. As such,Fiig et al.(2016) argues that DP is not simply a “zero-sum game” where the gain of the DP airline comes at the expense of the traditional RM airline, but actually allows airlines to extract more consumer surplus.
Unlike dynamic price adjustment, true continuous pricing allows a firm to select a price from any continuous range without being associated with any pre-filed fare.
Kumar et al. (2018) presented such a “classless” or “class-free” dynamic program-ming model for the single-leg monopolistic problem assuprogram-ming passengers’ maximum willingness-to-pay follows a Gaussian distribution. The parameters of the WTP-distribution are unknown to the airline and are learned from observed booking data using a maximum likelihood estimation (MLE) and expectation maximization (EM) approach. Juhasz (2019) developed a dynamic program-Monte Carlo (DP-MC) op-timizer to determine the optimal price for multiple products in a network setting,
assuming a constant pre-defined price difference between the products.
Burger and Fuchs (2005) were among the first to study the performance of a single-leg dynamic pricing model in a practical competitive setting at Swiss International Air Lines. Their dynamic program formulation is similar to the one presented by
Kumar et al. (2018), but with an exponentially distributed maximum willingness-to-pay instead of Gaussian. However, due to the inability to distribute any price from a continuous range, they were limited to introducing ten additional fare classes which essentially reduced the problem to one of traditional assortment optimization. After implementing their dynamic pricing approach in the Geneva-Paris market, they reported an overall 2.4% increase in revenue and a 6.4% gain in load factor. The highest revenue increase of 12.1% was observed on a flight where dynamic pricing competed head-to-head with a traditional revenue management airline. The authors argue that this large gain is driven by the fact that the dynamic pricing approach undercut the fares offered by the traditional RM airline throughout the whole booking period, attracting many new bookings. On flights competing with a low-cost carrier, no significant revenue gain was observed as the increase in load factor from dynamic pricing was counterbalanced by a corresponding decrease in yield.
Besides the stream of literature that proposes actionable heuristics, several papers have also described continuous pricing in more general terms. Bala (2014) proposes a hypothetical auto fare filing engine which continuously updates the filed fares to smooth out the price gaps between successive fare basis codes. Fiig et al. (2015) describe how distribution and revenue management are closely related as evidenced by their joint evolution, and discuss the role of distribution in moving towards dynamic pricing. Westermann(2006) mentions a real-time dynamic pricing concept in which prices are calculated online based on the willingness-to-pay of passengers, competitor fares and other observable criteria, without going into the underlying science.
Also outside of the airline industry, many dynamic pricing models have been proposed in the operations research literature, starting with the seminal papers byGallego and
Van Ryzin(1994,1997). Since these articles tend to focus on the theoretical properties of the dynamic pricing models, they are of less practical relevance in the context of this thesis. For a more extensive overview on the dynamic pricing literature, the reader is referred to Chen and Chen(2015).
2.3
Towards Competitor-Aware Revenue Management
Traditional revenue management models have generally assumed a monopolistic en-vironment in which all customers are perfectly loyal, i.e. a passenger who previously booked with a particular airline will continue to do so in the future. Current RM op-timization models do not explicitly consider the possibility of losing a passenger to a competitor with a more attractive offer because of a lower fare or better path/schedule quality. Competitive effects are only indirectly and passively accounted for through feedback with the forecaster, but the RM model does not actively take corrective me-asures to a competitor’s actions. In the Futures series of the Journal of Revenue and Pricing Management, several former RM VPs have foreshadowed the move towards so-called “competitor-aware” revenue management. Nason(2007) from American Air-lines argued that “RM systems need to get much better at knowing the competition’s price and incorporating it into the calculation of future demand and the elasticity of demand”. Similarly, Cary (2004) at United Airlines described pricing as “almost entirely outwardly focused on the actions and reactions of competitors” and reve-nue management as “almost entirely inwardly focused on the patterns and trends in historical demand data”.
d’Huart and Belobaba (2012) modeled the interaction effects between the revenue management systems of competing airlines. They show that the detruncation of his-torical bookings typically results in double-counting of demand at the overall market level, since a passenger that is rejected by one airline might be accommodated on another airline. As a result, an RM system in an oligopoly tends to generate higher forecasts and lower availability of discount seats compared to an equivalent monopoly.