HAL Id: hal-01282074
https://hal.archives-ouvertes.fr/hal-01282074
Submitted on 7 Mar 2016HAL is a multi-disciplinary open access archive for the deposit and dissemination of sci-entific research documents, whether they are pub-lished or not. The documents may come from teaching and research institutions in France or abroad, or from public or private research centers.
L’archive ouverte pluridisciplinaire HAL, est destinée au dépôt et à la diffusion de documents scientifiques de niveau recherche, publiés ou non, émanant des établissements d’enseignement et de recherche français ou étrangers, des laboratoires publics ou privés.
Distributed under a Creative Commons Attribution - NonCommercial| 4.0 International License
Validation of a novel microradiography device for
characterization of bone ineralization
Florian Montagner, Valérie Kaftandjian, Delphine Farlay, Daniel Brau,
Georges Boivin, Hélène Follet
To cite this version:
Florian Montagner, Valérie Kaftandjian, Delphine Farlay, Daniel Brau, Georges Boivin, et al.. Vali-dation of a novel microradiography device for characterization of bone ineralization. Journal of X-Ray Science and Technology, IOS Press, 2015, 23 (2), pp.201-211. �10.3233/XST-150481�. �hal-01282074�
1
Validation of a novel microradiography device for characterization of
bone mineralization
Florian Montagner1,2, Valérie Kaftandjian3, Delphine Farlay1,2, Daniel Brau4, Georges
Boivin1,2, Hélène Follet1,2
1 INSERM UMR 1033, F-69008 Lyon 2 Université de Lyon, F-69008 Lyon
3 Laboratoire Vibrations Acoustique LVA, INSA-Lyon, F-69621 Villeurbanne cedex 4 Photonic Science, F-38590 St Etienne de St Geoirs
Corresponding author: Hélène Follet, PhD, INSERM UMR1033
Faculté de Medecine Lyon Est -Domaine Laennec- 7-11, rue G. Paradin, 69372 Lyon cedex 08, France Tel : +33 4 78 78 57 26
Fax : +33 4 78 77 86 63
Email: helene.follet@inserm.fr
Abstract
In order to simplify bone mineralization measurements, a system using radiographic films has been updated with a digital detector. The objective of this paper was to validate this new device. Technologies and physical phenomena involved in both systems (radiographic films and digital detector) are different. The methodology used to compare the two systems was based on image quality and assessed on two main parameters: contrast to noise ratio and spatial resolution. Results showed that the contrast to noise ratio was similar between the two systems, provided that acquisition parameters were optimized. With regard to spatial resolution, a magnification factor of at least 4 was required to achieve the same resolution than films or even more. A final validation was also shown on a real image of a bone sample. The results showed that both systems have similar image quality performances, and the system using digital detector has several advantages (easier to use than films, no consumables and faster acquisition time).
Keywords: mineralization of bone, quantitative microradiography, digital detector, spatial resolution, contrast to noise ratio
1 Introduction
Bone is a living and composite material. Its intrinsic changes affect its ability to resist fracture. Bone is composed of organic matrix (~30%, mainly type I collagen), mineral (~60%) and water (~10%) [1]. The inorganic composition of bone (“bone mineral”) is a poorly crystallized apatite which slightly differs from stoichiometric hydroxyapatite (HA) Ca10(PO4)6(OH)2 [2]. The
density of the mineral part of bone is an important determinant of bone strength [3, 4]. Bone mineral quality can be measured at the organ (i.e., bone and surrounding tissues) or tissue levels
2
(i.e., mineral part of bone only) with different methods. At the organ level, the current and clinical reference method for measuring the amount of mineral in bone is by dual energy X-ray absorptiometry (DXA) which gives the so-called bone mineral density area (aBMD) [5, 6]. The term “area” comes from the fact that DXA is a two-dimensional method and thus only gives the bone mineral density per unit area (g.cm-2). A three-dimensional measurement of the mineral density can be obtained by peripheral quantitative computed tomography (pQCT) [7, 8]. As a volumetric method, this measurement is called vBMD (for "bone mineral density volume") and is given in g.cm-3. This measurement concerns only the zones of radius and tibia. At the tissue level, the main issue is to avoid any geometrical effect. Measuring only the mineral part is defined by the tissue mineral density parameter (TMD in g.cm-3), which avoids the
porosity, the vascular and canalicular network. TMD is obtained by high resolution pQCT and microcomputed tomography (µCT) but considers only the bone mineral part. In addition to other methods for measuring the mineral part of bone [9], quantitative microradiography allows to obtain the so-called degree of mineralization of bone (DMB in g.cm-3), defined as the density of HA [10]. This well known and referenced technique is based on the radiographic acquisition of an embedded bone section of known thickness [11]. Since the method uses high resolution radiographic films, the spatial resolution is very high and the DMB obtained is very accurate. However, due to the disappearance of manufactured radiographic films, this technique needs to be updated using digital sensors.
The purpose of this study was to setup the upgrade of microradiography from high resolution radiographic films to a digital detector, and to quantify the image quality (in terms of contrast, noise and spatial resolution). After presenting the principle of DMB measurement, the specifications of the two systems are shown, as well as the corresponding calibration curves. Then the image quality obtained with the two systems was investigated to validate the replacement of the film by a digital detector.
2 Theoretical background for DMB measurement
When a monochromatic X-ray beam of N0 photons of energy E irradiates a sample, the number
of transmitted photons N(E) follows the Beer-Lambert law (Eq. (1)).
ρd ρ Z E µ e E N E N ) , , ( 0 (1)where µ/ρ is the mass attenuation coefficient of the sample (cm2.g-1), Z its atomic number, ρ its density (g.cm-3), and d its thickness (cm).
The Beer-Lambert law indicates that the global attenuation of an X-ray beam depends on its energy and material-dependent parameters, among which some are independent of energy (thickness and density), and one is energy dependent (µ/ρ).
The mass attenuation coefficient µ/ρ is introduced in the equation instead of the linear attenuation coefficient µ because it is independent from the density of the sample and, thus, on its physical state. µ/ρ values are well known for all simple chemical elements and can be computed for any compound, provided that its chemical composition is known.
The degree of mineralization of bone (DMB) is defined by the density of HA ρHA [12] and
computed from the number of photons transmitted by a bone sample. With the incident flux being unknown, the measurement is based on a comparison with a reference object. Aluminum
3
(Al) was chosen as a reference because it is easy to use and perfectly known (thickness and density) [13].
The Beer-Lambert law applied respectively to Al and HA gives the following Eqs (2) and (3):
AL AL AL d ρ ρ Z E µ AL E N E e N ) , , ( 0 (2)
HA HA HA d Z E µ HA E N E e N , ) , ( 0 (3)Eqs (2) and (3) show that the number of photons transmitted by the Al or bone sample is related to thickness and density. In our case, the unknown parameter is bone mineral density (ρHA),
while all others parameters are known. Thus, if the signals measured on bone and Al are identical, which means that NAL=NHA, considering the same incident flux N0, we get Eq. (4):
AL AL AL HA HA HA d Z E µ d Z E µ , ) ( , , ) , ( (4)
This allows us to link the DMB (ρHA) to the Al thickness dAL (5):
AL HA AL AL HA AL HA K d d d Z E µ Z E µ DMB . ) , , ( ) , , ( (5)
To apply Eq. (5), the K factor must be known. The density of Al is perfectly known (2.7 g/cm3), as well as the sample thickness dHA (100 µm). The mass attenuation coefficients of Al and HA
depend on energy, and their values are tabulated [14]. The two curves of mass attenuation coefficients of Al and HA versus energy are shown in Fig. 1. For an energy of 8.05 keV, the ratio of mass attenuation coefficients is 0.571 and the K factor value is 0.571*2.7/0.01=1.54.
4
Fig. 1. Mass attenuation coefficients of aluminum (Al) and hydroxyapatite (HA) as a function of energy.
3 Specifications of the two systems using radiographic film and digital detector
As explained in the previous section, the DMB measurement depends on the energy. A monochromatic beam is preferred in order to compute the K factor (Eq. (5)). In practice, for the two systems, an X-ray tube is used with a copper anode (Kα radiation energy is 8.05 keV) and
a nickel filter, like the very first studies of quantitative microradiography [13, 15]. The K-edge absorption of nickel is 8.3 keV, which is just above the Kα characteristic line of copper. Thus, the nickel filter is well adapted to attenuate energies just above the copper characteristic line. The spectrum obtained after filtration is still polychromatic, but with a strong preponderance of the copper characteristic line at 8.05 keV.
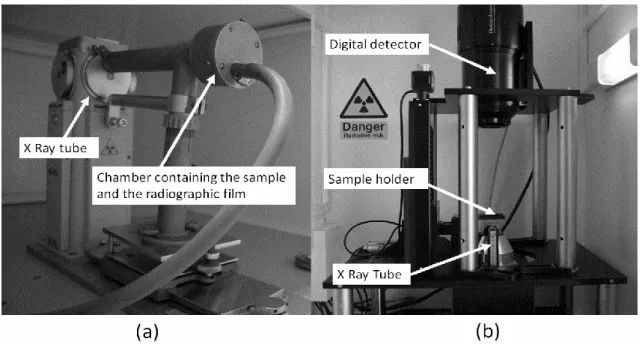
The two microradiographic systems are illustrated in Fig. 2. With the system using radiographic films, samples are directly in contact with the film. Thus, no magnification is used and no geometric unsharpness occurs. As a consequence, in contact microradiography, the focal spot size of the X-ray tube can be large, thus allowing a high radiation intensity.
On the contrary, with the digital detector, since the detector pixel size is higher than the desired spatial resolution, the magnification factor must be increased in order to obtain a smaller pixel size at the sample level. However, the geometrical unsharpness increases as well, and the use of a microfocus X-ray tube is required. The power is therefore reduced and the radiation intensity is low. A compromise needs to be found regarding image quality because a high intensity improves the signal to noise ratio (SNR), while increasing spatial resolution requires a decrease in intensity. This compromise will be discussed in section 5. The technical specifications of the two systems are summarized in Table 1.
5
Fig. 2. Microradiographic systems using (a) films and (b) digital detector.
Table 1. Technical specifications of both systems using radiographic films and a digital detector.
Features System using radiographic films Digital detector system
X-ray tube X ray generator: Philips PW 1830/40 Diffraction tube: Philips PW 2273/20 Power maxi: 2.2 kW
Cu anode, Ni filter
Beryllium window: 300 µm Focal spot size: 4.2 mm2
Microfocus Hammamatsu X-ray system L9421 -02
Power: maxi 8 W Cu anode, Ni filter
Beryllium window: 150 µm Focal spot size: 5 µm diameter Exposure parameters High voltage: 25 kV Current: 25 mA Power: 625 W High voltage: 40 kV Current: 50 µA Power: 2 W Source to object distance About 30 cm Range: 1-25 cm Object to detector distance Contact Range: 1-25 cm
Detector Kodak radiographic films resolution: over 1000 pl/mm Revelator: Kodak D19 Fixator: Ilford Hypam Temperature: 20°C
Photonic science CCD camera FDI VHR 11M active area:36x24 mm (4008 x 2671 pixels) scintillator: Gd2O2S:Tb
filter Al: 12 µm
Image digitization step
Film digitized using a microscope coupled with a digital camera with 8 bits coding
12 bits digital image Detector pixel size: 9 µm
Object pixel size depends on magnification factor.
6
Image pixel size: 5.6 µm Object pixel size:<0.83 µm at magnification max 10.8
4 Experimental validation using an Al step wedge
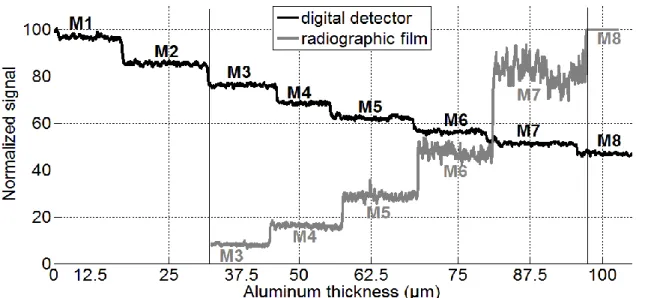
An Al step wedge was exposed using both techniques (8 regular steps from 12.5 µm to 100 µm). Typical grey-level profiles obtained by the two systems are shown in Fig. 3. Both profiles were normalized by their maximal value in order to be shown on the same scale. However, it is worth noting that the dynamic range of the detector is 4096 (12 bits), while 255 levels are available for the film system (8 bits).
For the digital detector system, the grey-level is proportional to the energy deposited in the detector, which is related to the energy transmitted by the object, weighted by the detector efficiency. Thus, a highest signal is obtained for small thicknesses where many photons are transmitted. For the other system (radiographic film coupled to a microscope), the deposited energy in the film increases its optical density (film darkening), and the obtained signal increases with Al thickness (which means when low energy is transmitted).
Fig. 3. Normalized grey levels obtained for an aluminum step wedge with both systems. M8 represents the thickest step and M1, the thinnest.
From the experimental evolution of the measured signals, we could deduce a logarithmic relation between Al thickness and grey levels, as given by Eq. (6):
GL
b
a
d
Al
ln
(6)where a and b are constant coefficients. In the case of the digital detector, the coefficient a is negative (when Al thickness increases, signal decreases and grey levels become black), and it
7
is positive in the case of radiographic film (the light intensity is measured through the radiographic film).
Finally, Eqs. (5) and (6) allowed us to obtain a relation between grey levels and DMB as follows:
*
)
ln(
*
GL
b
a
DMB
(7)where a*=K.a and b*=K.b. The obtained DMB as a function of grey levels is plotted in Fig. 4. This calibration curve allowed us to determine the DMBs for all possible values of grey levels in the range of interest.
For the system using radiographic films, the gain of the microscope camera was chosen in order to optimize the dynamic range in the domain of grey levels which were close to the bone tissue values. This is why five steps were used for the whole grey-level range.
The calibration was validated with the digital system by exposing a sample of 98% pure HA with a density of 3.08 g.cm-3. The density calculated from the procedure was 3.015 g.cm-3, i.e., a relative difference of 2.1%.
Fig. 4. Calibration curves of DMB as a function of grey-level, with film and digital detector.
5. Quantification of the image quality based on the contrast to noise ratio (CNR) and spatial resolution
5.1 CNR
The DMB is calculated from the grey-level. The smallest distinguishable DMB values are directly related to the grey-level contrast resolution. The noise level must be taken into account, especially for digital systems. An essential image quality parameter is the CNR. The CNR is defined as the grey-level difference between two thicknesses of a reference sample divided by the noise level [16]. CNR is given by the relation in Eq. (8):
2 2 2 1 2 1 GL -CNR GL GL GL (8)
8
where: GLi is the average grey level in zone i
σGLi the standard deviation of grey level in zone i.
A CNR of one means that the grey-level difference is equal to the noise level, i.e., the two thicknesses will be undiscernible. The higher the CNR, the better is the image quality in terms of contrast resolution. CNR increases when the contrast improves, which is known to be related to the energy of the X-ray beam: a low energy improves the contrast. On another hand, the CNR improves when the signal to noise ratio (SNR) improves, which is known to be related to the number of photons. Thus, the best quality should be obtained at a low energy and a high photon intensity. In our case, when increasing the high voltage, the mean energy of the spectrum increases, but the spectrum is still dominated by the copper characteristic line. A higher voltage increases also the total number of photons present in the spectrum, which increases the SNR. Overall, the CNR is better when increasing the high voltage.
In our study, CNR was calculated between two Al steps of 62.5 and 75 µm, since they corresponded to the closest values of DMB generally observed. In order to optimize the settings of the X-ray tube, we performed two tests: (1) the high voltage was changed while keeping a constant power of 2 W (which means that the intensity decreased when high voltage increased, keeping the same integration time of 7 s); and (2), high voltage was changed with a constant exposure of 0.35 µA.s (which means the same intensity and integration time, but an increasing power). Fig. 5 shows that in both cases, CNR increased with high voltage, for the reason given above.
Fig. 5. Contrast to noise ratio as a function of high voltage either with a constant power (solid line) or constant exposure values (dotted line).
As a matter of comparison, CNR obtained with radiographic film was about 6.5 with an acquisition time of 20 min at 25 kV, 25 mA (optimized setting values for film [11]).
With regard to the digital system settings, a high voltage of 40 kV was selected (just before the maximal value of 45 kV). Concerning the current, our objective was to preserve the best spatial resolution (as the focal spot size increased with current), a low power had thus to be selected (2 W, i.e., 50 µA at 40 kV).
9
To maximize the flux of photon, it is possible to increase the detector integration time and average several images, at the expense of total acquisition time. Indeed, the CNR increases with the square root of the number of integrated images.
An average of 6 pictures was chosen here as a good compromise. All these parameters allowed to achieve a CNR of 5.5 which was acceptable, although less than the film CNR.
5.2 Spatial resolution
Spatial resolution measures the ability of a system to separate details which are close together. It is influenced by the resolution of the detector and by the geometric unsharpness which depends on the magnification factor and the focal spot size (the latter being related to the tube intensity). Following the Nyquist sampling theorem, a digital detector is able to discern an object whose size is at least greater than twice the size of a pixel. In our case, the detector pixels have a size of 9 µm, thus the maximum intrinsic resolution (i.e. the resolution strictly due to the detector, without magnification and thus without geometric unsharpness)is expected to be 18 µm.
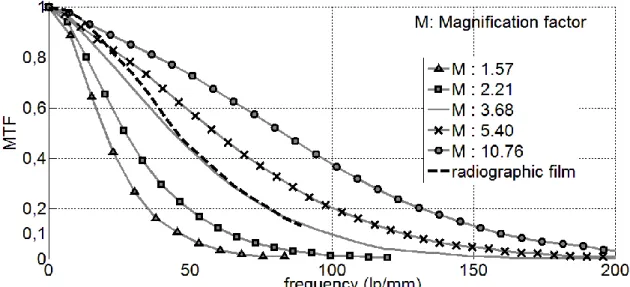
A mean for estimating the spatial resolution is to calculate the modulation transfer function (MTF) of the system [17]. This is obtained using a regular edge object of high attenuation, and then to realize the Fourier transformation of the derivative curve profile. MTF curves for the film and the detector with different magnification are illustrated in Fig. 6. Using the digital detector, the closest line corresponding to the film system is obtained for a magnification of 3.7.
A useful criterion to compare several systems is to assess the spatial resolution limit as the one given for a certain MTF value, typically 10% [18]. For a magnification of 3.7, for instance, the spatial resolution limit is 100 lp/mm, i.e., 5 µm. At this magnification level, the object pixel size is 2.43 µm (detector pixel size divided by the magnification factor), which means a Nyquist value of 4.86, in good agreement with the result, indicating that resolution is limited by pixel size and not by the scintillator effect.
Fig. 6. Modulation transfer function curves obtained for several magnifications M with digital detector (full lines) compared to film (dashed line).
The use of a calibration bar-space pattern (gold bars engraved in a plastic sheet) is another way to determine and verify the spatial resolution of the system. The contrast transfer function (CTF) is a plot of the contrast obtained versus the spatial frequency. The procedure of measurement is
10
represented in Fig. 7: from the image of the reference object, a grey-level profile is extracted and allows computing the contrast obtained for each spatial frequency. CTF is always above the MTF because it corresponds to a rectangular pattern, while by definition the MTF corresponds to a sinusoidal one.
CTF curves obtained for different magnifications with the digital system (full lines) and with radiographic film (dashed line) are shown in Fig. 7(c). This confirms that a magnification of 4 is necessary with the digital system to correspond with film.
It must be noted that the spatial frequency is limited to 20 lp/mm due to the minimal bar-space of the pattern which is 25 µm, and thus the curve cannot be plotted above this value.
Fig. 7. Calculation of the contrast transfer functions (CTF). (a) image of the bar space pattern, (b) the corresponding grey-level profile and (c) CTF curves obtained for film and digital
detector with different magnifications.
Given the MTF, the CTF can be also determined by the Coltman formula [19] with the use of Eq. (9):
...
11
11
9
9
7
7
5
5
3
3
4
M
f
M
f
M
f
M
f
M
f
M
f
C
(9)where, M(f) = sine wave MTF C(f) = bar target CTF
f = spatial frequency.
11
5.3 Comparison of an image obtained by the two systems on the same bone sample
Fig. 8 shows images performed with the two systems on an identical bone sample (Fig. 8(a)). For the digital system, two images were taken: one with a magnification of 3.7 (Fig. 8(c)) and another with the maximum magnification 10.8 (Fig. 8(d)). With the magnification of 3.7, the system allowed to obtain overall the same structures than with the radiographic film (Fig. 8(b)), but the image was less sharp. With the magnification of 10.8, the picture obtained was very similar to the radiographic film. For the three configurations, the grey-level profiles were plotted along two similar bone structures and they were very similar (Fig. 8(e)). CNR obtained with radiographic film and with digital detector (M=3.7 and M=10.8) were respectively 8.2, 7.1 and 7.9.
12
Fig. 8. (a) Comparison of microradiographs of a human iliac bone biopsy and zoom of a specific part of the image obtained with (b) the radiographic film and with the digital system
at two different magnifications: (c) 3.7 and (d) 10.8. (e) Curves representing the grey-level profiles obtained respectively on the images (b), (c) and (d) across two bone specific units.
6 Conclusion
The digital system provides a good CNR (about 5.5 on the range referred DMB with conditions specified above). Moving the sample holder allows adjusting the magnification between 1.6 and 10.8 and this allows to achieve a similar spatial resolution compared to film for a magnification factor of 4. A higher magnification allows to achieve an even better MTF than film. Final images on bone samples show the same level of detail between film and digital detector at the highest magnification factor (10.8). On the other hand, the digital system dynamic range is 12 bits (i.e., 4096 values) versus 8 bits (255 values) for system using films. So the grey level information is more precise with the digital system. Finally, acquisition settings have been fixed as mentioned in Table 2.
Table 2
Acquisition settings for digital system
Parameter Value High voltage (kV) 40 Current (µA) 50 Acquisition time (s) 7 Number of frames 6 Magnification factor 10.8
The use of a digital detector for radiographic imaging has the advantage of being easier to use than films. Indeed, film chemical revelation can be modified by temperature, user manipulation and fixator time settings. Moreover, there is no consumable anymore. We can also mention the problem of reciprocity of films: the efficiency of a digital detector is linear with exposition, but with the film, the efficiency decreases with exposition. This phenomenon is known as the Schwarzschild effect [20]. So with the digital system, we can easier control the evolution of photon flux when exposure time is modified compared to a system with radiographic films. Another point with the two systems is the fact that several images are required to cover the entire sample, especially when the magnification factor is higher. Thus, the total acquisition time will depend of number of images required. For a sample which needs 12 images, for instance, about 8 min are necessary against 20 for the entire sample with the radiographic film. In conclusion, the two systems have similar performances with regard to image quality (CNR and spatial resolution). The digital system has the advantage of being easier to use than the system with films, with lower acquisition times. The use of a digital detector has been validated regarding the image quality necessary for characterization of bone mineralization. The next step concerns validation of quantitative assessment of bone mineralization variables as mean DMB, heterogeneity index. These variables will be measured and compared between the two systems for several bone specific units from the same human bone samples.
13
This work was supported by the “Région Rhône-Alpes” (CIBLE N° 11 010877 01) and a grant “Bonus Qualité Industrielle: QUATIOS” OSEO ANVAR RHONE-ALPES 2010.
Part of this work was conducted in the frame of the ANR project MALICE N° BS09-032, and within the framework of the labex CeLyA of Université de Lyon operated by the French National Research Agency (ANR-10-LABX-0060/ANR-11-IDEX-0007).
The authors thank Perceval Guillou for software assistance during installation of the system and testing, David Marchat (Assistant Professor, Center for Biomedical and Healthcare Engineering, Ecole Nationale Supérieure des Mines de Saint-Etienne) for providing us a hydroxyapatite sample and Jean-Paul Roux (UMR1033) for technical and scientific discussions.
14
References
[1] D. Farlay and G. Boivin, Bone Mineral Quality, in: Osteoporosis, Y. Dionyssiotis, ed., InTech, 2012, pp.3-32.
[2] R. Blanchard, A. Dejaco, E. Bongaers and C. Hellmich, Intravoxel bone micromechanics for microCT-based finite element simulations, J Biomech 46 (2013), 2710-21. [3] H. Follet, G. Boivin, C. Rumelhart and P.J Meunier, The degree of mineralization is a determinant of bone strength: a study on human calcanei, Bone 34 (2004), 783-9.
[4] G. Boivin, P. Chavassieux, A. C. Santora, J. Yates and P. J. Meunier, Alendronate increases bone strength by increasing the mean degree of mineralization of bone tissue in osteoporotic women, Bone 27 (2000), 687-94.
[5] M. Monija, M. Anna and G. Jeppe, Combined Vertebral Assessment and Bone Densitometry Increases the Prevalence and Severity of Osteoporosis in Patients Referred to DXA Scanning, Journal of Clinical Densitometry 16 (2013), 549-553.
[6] G. Blake, J. E. Adams and N. Bishop, DXA in Adults and Children, in: Primer on the
Metabolic Bone Diseases and Disorders of Mineral Metabolism, C. J. Rosen, ed., John Wiley
& Sons, Inc, 2013, pp 249-263.
[7] C. C. Glüer, Quantitative Computed Tomography in Children and Adults, in: Primer on
the Metabolic Bone Diseases and Disorders of Mineral Metabolism, C. J. Rosen, ed., John
Wiley & Sons, Inc, 2009, pp. 264-276.
[8] K. Engelke, C. Libanati, Y. Liu, H. Wang, M. Austin, T. Fuerst, B. Stampa, W. Timm and H. K. Genant, Quantitative computed tomography (QCT) of the forearm using general purpose spiral whole-body CT scanners: Accuracy, precision and comparison with dual-energy X-ray absorptiometry (DXA), Bone 45 (2009), 110-118.
[9] G. Boivin and P.J. Meunier, Methodological considerations in measurement of bone mineral content, Osteoporosis International 14 (2003), 22-28.
[10] J. Jowsey, D. Phil, P. J. Kelly, B. L. Riggs, A. J Jr. Bianco, D. A. Scholz and J. Gershon-Cohen, Quantitative Microradiographic Studies of Normal and Osteoporotic Bone, J Bone Joint
Surg Am 47 (1965), 785-806.
[11] G. Boivin and P.J. Meunier, The degree of mineralization of bone tissue measured by computerized quantitative contact microradiography, Calcif Tissue Int 70 (2002), 503-11. [12] R. E. Rowland, J. Jowsey and J. H. Marshall, Microscopic metabolism of calcium in bone. III. Microradiographic measurements of mineral density, Radiat Res 10 (1959), 234-42. [13] G. Wallgren, Biophysical analyses of the formation and structure of human fetal bone; a microradiographic and x-ray crystallographic study, Acta Paediatr Suppl 46 (1957), 1-80. [14] J. H. Hubbell and S. M. Seltzer, Tables of X-ray mass attenuation coefficients and mass
energy-absorption coefficients 1 keV to 20 MeV for elements Z=1 to 92 and 48 additional substances of dosimetric interest, U.S. Department of Commerce, Technology Administration,
National Institute of Standards and Technology, Gaithersburg, MD, last update: 2004.
[15] K. Holmstrand, Biophysical investigations of bone transplants and bone implants; an experimental study, Acta Orthop Scand Suppl 26 (1957), 1-92.
15
[16] P. Duvauchelle, N. Freud, V. Kaftandjian and D. Babot, A computer code to simulate X-ray imaging techniques, Nuclear Instruments and Methods in Physics Research Section B:
Beam Interactions with Materials and Atoms 170 (2000), 245-258.
[17] N. Bengt, Resolution, unsharpness and MTF, Linköping University Electronic Press, Report (Other academic), 1980.
[18] V. Kaftandjian, Y. M. Zhu, G. Rozière, G. Peix, and D. Babot, A comparison of the ball, wire, edge and bar/space pattern techniques for modulation transfer function measurements of linear X-ray detectors, J X Ray Sc Technol 6 (1996), 205-221.
[19] J. W. Coltman, The Specification of Imaging Properties by Response to a Sine Wave Input, J. Opt. Soc. Am. 44 (1954), 468-469.
[20] A. Djouguela, R. Kollhoff, A. Rubach, D. Harder and B. Poppe, The Schwarzschild effect of the dosimetry film Kodak EDR 2, Physics in Medicine and Biology 50 (2005), N317.