HAL Id: cea-02316815
https://hal-cea.archives-ouvertes.fr/cea-02316815
Submitted on 29 Jun 2020
HAL is a multi-disciplinary open access
archive for the deposit and dissemination of
sci-entific research documents, whether they are
pub-lished or not. The documents may come from
teaching and research institutions in France or
abroad, or from public or private research centers.
L’archive ouverte pluridisciplinaire HAL, est
destinée au dépôt et à la diffusion de documents
scientifiques de niveau recherche, publiés ou non,
émanant des établissements d’enseignement et de
recherche français ou étrangers, des laboratoires
publics ou privés.
retention and N removal in contrasting estuaries of the
Baltic Sea
Ines Bartl, Dana Hellemann, Christophe Rabouille, Kirstin Schulz, Petra
Tallberg, Susanna Hietanen, Maren Voss
To cite this version:
Ines Bartl, Dana Hellemann, Christophe Rabouille, Kirstin Schulz, Petra Tallberg, et al.. Particulate
organic matter controls benthic microbial N retention and N removal in contrasting estuaries of the
Baltic Sea. Biogeosciences, European Geosciences Union, 2019, 16 (18), pp.3543-3564.
�10.5194/bg-16-3543-2019�. �cea-02316815�
https://doi.org/10.5194/bg-16-3543-2019 © Author(s) 2019. This work is distributed under the Creative Commons Attribution 4.0 License.
Particulate organic matter controls benthic microbial N retention
and N removal in contrasting estuaries of the Baltic Sea
Ines Bartl1,*, Dana Hellemann2,*, Christophe Rabouille3, Kirstin Schulz4, Petra Tallberg2, Susanna Hietanen2, and Maren Voss1
1Department of Biological Oceanography, Leibniz Institute for Baltic Sea Research Warnemünde,
Seestr. 15, 18119 Rostock, Germany
2Ecosystems and Environment Research Programme, University of Helsinki, 00014 Helsinki, Finland 3Laboratoire des Sciences du Climat et de l’Environnement, UMR CEA-CNRS-UVSQ and IPSL,
Av. de la Terrasse, 91198 Gif sur Yvette, France
4Alfred Wegener Institute, Helmholtz Centre for Polar and Marine Research,
Klußmannstr. 3d, 27570 Bremerhaven, Germany
∗These authors contributed equally to this work.
Correspondence: Ines Bartl (ines.bartl@io-warnemuende.de) Received: 17 October 2018 – Discussion started: 26 October 2018
Revised: 31 July 2019 – Accepted: 21 August 2019 – Published: 19 September 2019
Abstract. Estuaries worldwide act as “filters” of land-derived nitrogen (N) loads, yet differences in coastal envi-ronmental settings can affect the N filter function. We investi-gated microbial N retention (nitrification, ammonium assim-ilation) and N removal (denitrification, anammox) processes in the aphotic benthic system (bottom boundary layer (BBL) and sediment) of two Baltic Sea estuaries differing in riverine N loads, trophic state, geomorphology, and sediment type. In the BBL, rates of nitrification (5–227 nmol N L−1d−1) and ammonium assimilation (9–704 nmol N L−1d−1) were not enhanced in the eutrophied Vistula Estuary compared to the oligotrophic Öre Estuary. No anammox was detected in the sediment of either estuary, while denitrification rates were twice as high in the eutrophied (352 ± 123 µmol N m−2d−1) as in the oligotrophic estuary. Particulate organic matter (POM) was mainly of phytoplankton origin in the benthic systems of both estuaries. It seemed to control heterotrophic denitrification and ammonium assimilation as well as au-totrophic nitrification by functioning as a substrate source of N and organic carbon. Our data suggest that in stratified es-tuaries, POM is an essential link between riverine N loads and benthic N turnover and may furthermore function as a temporary N reservoir. During long particle residence times or alongshore transport pathways, increased time is available for the recycling of N until its eventual removal, allowing
effective coastal filtering even at low process rates. Under-standing the key controls and microbial N processes in the coastal N filter therefore requires to also consider the effects of geomorphological and hydrological features.
1 Introduction
Human nitrogen (N) utilisation, especially in agriculture (Galloway and Cowling, 2002; Rabalais, 2002), has strongly increased riverine N inputs to coastal zones (Howarth et al., 1996) and thus coastal eutrophication (Howarth and Marino, 2006; Nixon, 1995). The coastal zone of the semi-enclosed Baltic Sea receives ∼ 680 kt annually of waterborne total N (TN; HELCOM, 2019) from its catchment area, which is in-habited by > 85 million people (Sweitzer et al., 1996). The Baltic coastal zone is thus particularly prone to eutrophica-tion resulting in oxygen deficiency and a loss of biodiversity (Conley et al., 2011; Diaz and Rosenberg, 2008; Rabalais, 2002; Richardson and Jørgensen, 2013).
Estuaries are the primary recipients of the riverine N load, and intense biogeochemical cycling establishes them as “fil-ters” of land-derived N on its way to the open sea (Nedwell et al., 1999; Soetaert et al., 2006). The N filter function con-sists of retention and removal, with N retention defined as
the cycling of bioavailable N within a system for longer than its mean fresh water residence time, and N removal as the permanent removal of N from a system via burial and the production of gaseous forms (Asmala et al., 2017). Micro-bial processes that contribute to N retention include uptake into biomass, ammonification, nitrification, and dissimilatory nitrate reduction to ammonia (DNRA), while denitrification and anaerobic ammonium oxidation (anammox) lead to N removal. Nitrification, the aerobic oxidation of ammonium (NH+4) via nitrite (NO−2) to nitrate (NO−3), and denitrifica-tion, the stepwise anaerobic reduction of NO−3 to nitrous ox-ide (N2O) and di-nitrogen (N2), are two key microbial
pro-cesses in the coastal N cycle. Nitrification provides substrates not only for other N retention processes such as primary pro-duction and DNRA but also for N removal via denitrification and anammox. While mainly regulated by oxygen and NH+4 availability (Ward, 2008), particulate organic matter (POM) is an additional important factor controlling nitrification in coastal systems (Bartl et al., 2018; Damashek et al., 2016; Hsiao et al., 2014). There, nitrifiers are often found attached to particles (Dang and Chen, 2017), where they utilise the NH+4 generated through degradation of the organic particle (Klawonn et al., 2015a; Marzocchi et al., 2018). Denitrifi-cation is the dominant N removal process in many coastal sediments (Dalsgaard et al., 2005) with anammox often con-tributing only up to 17 % to total N2 production (Dale et
al., 2009; Trimmer et al., 2003). Denitrification is mainly controlled by the concentrations of the substrates NO−3 and dissolved organic carbon (Piña-Ochoa and Álvarez-Cobelas, 2006), but the quantity of labile POM as the source of sub-strates is equally important (Bonaglia et al., 2017; Eyre et al., 2013; Hietanen and Kuparinen, 2008). The coupling of microbial N retention and removal processes such as nitri-fication and denitrinitri-fication is especially intense in the ben-thic system, which comprises oxic and anoxic portions of the sediment, and the overlying turbulent bottom boundary layer (BBL; Richards, 1990). The processes in these three com-partments are closely linked via the exchange and diagenesis of solutes and particles (Boudreau and Jørgensen, 2001), thus making the benthic system a key component of the coastal N filter.
Baltic Sea estuaries are highly variable in terms of their riverine N load, stratification, water residence time, and sediment type (Asmala et al., 2017; Conley et al., 2011; Stepanauskas et al., 2002). All these environmental settings can impact the estuarine filter function. For instance, high riverine N loads are known to increase rates of microbial N processes (Seitzinger et al., 2006), whereas stratification of the water column may slow benthic N turnover as it limits the direct supply of riverine substrates from the surface water (Hellemann et al., 2017). A long water residence time, facili-tated by geomorphological boundaries, increases the propor-tion of N removed in the sediment relative to the riverine N load (Finlay et al., 2013; Nixon et al., 1996; Seitzinger et al., 2006). Similarly, it may also increase the proportion of N
re-tained via nitrification or DNRA, yet thorough investigations are still lacking. The sediment type influences the transport of substrates into, through, and out of the sediment, and thus the microbial N processes therein. In cohesive sediments, diffu-sive and fauna-induced fluxes govern solute exchange, while in sandy, permeable sediments advective pore-water flow is usually the dominant transport process (Huettel et al., 2003; Thibodeaux and Boyle, 1987). Pore-water flow leads to an increased supply of oxygen, oxidised solutes, and particles into the sediment, as well as to the build-up of a complex redox zonation (Huettel et al., 1998, 2003, 2014). In sum this results in increased microbial turnover of organic mat-ter (Boudreau et al., 2001) and potentially enhances nitrifica-tion and denitrificanitrifica-tion rates. The efficiency of microbial pro-cesses retaining or removing N is strongly influenced by the various combinations of the above-described environmental settings, yet detailed comparisons of contrasting estuaries are scarce.
Based on a compilation of denitrification rates across dif-ferent coastal types in the Baltic Sea, Asmala et al. (2017) estimated that the entire Baltic coastal zone removes ∼ 16 % of annual land-derived TN loads via denitrification, while the remaining 84 % is probably retained within the coastal zone or exported to the open sea. Model results indicate, however, that the export of riverine N to the open Baltic Sea accounts for only a minor share of the TN load (Radtke et al., 2012), suggesting that most N remains within the coastal zone. So far, however, actual rate measurements of N retention pro-cesses in coastal benthic systems of the Baltic Sea are scarce (e.g. Bonaglia et al., 2014; Jäntti et al., 2011). Therefore, in this study, we examined microbial N removal (denitrifi-cation, anammox) and N retention (nitrifi(denitrifi-cation, ammonium assimilation) processes in the aphotic benthic systems of two Baltic estuaries with contrasting environmental settings. The small, northern Öre Estuary receives low riverine N loads (430 t TN yr−1, Table 1) from a catchment area mainly con-sisting of forests and bogs (Wikner and Andersson, 2012). Its oligotrophic state is reflected in its low concentrations of nutrients and total organic carbon as well as low rates of pri-mary production (Ask et al., 2016; Wikner and Andersson, 2012). By contrast, the 12-fold larger southern Vistula Es-tuary receives high riverine N loads (97 000 t TN yr−1, Ta-ble 1) from a catchment area of intensively cultivated crop-land, which has led to high concentrations of nutrients and organic matter (Pastuszak et al., 2012), high primary produc-tion rates (Wielgat-Rychert et al., 2013; Witek et al., 1999), and thus to the eutrophied state. The estuaries further differ in their geomorphology and sediment type but share a simi-larity in peak riverine N loads in spring. In previous studies we showed that POM is an important factor controlling den-itrification in the sediment of the Öre Estuary (Hellemann et al., 2017) and nitrification in the BBL of the Vistula Estuary (Bartl et al., 2018). In the present work, we combined new environmental data and process rates with the published data from the Öre Estuary (Hellemann et al., 2017) and the Vistula
Estuary (Bartl et al., 2018; Thoms et al., 2018; Supplement Table S1) to identify the impact of contrasting environmental conditions on microbial N turnover and to estimate the role of POM in the coastal N filter function.
2 Materials and methods 2.1 Study areas and sampling
The Öre Estuary (ÖE) is located on the Swedish coast of the Quark Strait, northern Baltic Sea (Fig. 1). It covers an area of ∼ 71 km2 and has a volume of ∼ 1 km3 (SMHI, 2003). Inputs to the estuary originate from the Öre River, whose mean discharge of 36 m3s−1can create a river plume of 2– 3 m vertical and up to 10 km horizontal extent (Forsgren and Jansson, 1992). The estuary is framed by an archipelago to the east and by land to the west and has a basin-like bot-tom topography (Brydsten, 1992, Fig. 1). The southern out-let of the Öre Estuary is relatively wide at its surface but narrows at water depths > 20 m (Brydsten, 1992; Malmgren and Brydsten, 1992). A small elevation at 25–30 m water depth separates the estuarine bottom waters from the open sea (Brydsten, 1992, Fig. 1). The water column of the es-tuary is oxic throughout the year, with concentrations rang-ing from ∼ 250 µmol L−1in summer to ∼ 450 µmol L−1in spring (DBotnia, 2016; SMHI, 2003). The estuarine soft sed-iments (21 km2) consist of silts as well as non-permeable very fine and fine sands (Hellemann et al., 2017).
The Vistula Estuary (VE), part of the Bay of Gdánsk in the southern Baltic Sea (Fig. 1), covers an area of ∼ 825 km2, and has a volume of ∼ 20 km3. It receives inputs from the Vistula River, whose mean discharge of 1081 m3s−1 can result in a river plume of 0.5–12 m vertical and 4–30 km horizontal extent (Cyberska and Krzyminski, 1988). Due to the absence of topographical restrictions, the Vistula Estu-ary merges freely with the adjacent coastal and offshore wa-ters of the Bay of Gdánsk (Fig. 1). It can nevertheless be distinguished from adjacent offshore waters at ∼ 50 m water depth, where the sediment changes from sand to silt and the isotopic signature of N in the sediment changes from anthro-pogenic to marine sources (Thoms et al., 2018; Fig. 1). The water column of the Vistula Estuary is oxic throughout the year albeit with small seasonal differences (∼ 380 µmol L−1 in spring and ∼ 240 µmol L−1in summer; Bartl et al., 2018). Under specific conditions, such as floods or high respiration rates during stagnant stratification, coastal hypoxia may de-velop (Conley et al., 2011; Hansson et al., 2011). This did not happen during the cruises of this study.
Water and sediment samples from both estuaries were taken in spring and summer during four campaigns in 2014– 2016 with the RV Lotty (ÖEI, ÖEII) and RV Elisabeth Mann Borgese(VEI, VEII; Table 1). Water samples were obtained at three to six depths, from the surface (0–2.5 m) to the bot-tom, using either a rosette water sampler (5 L) connected
to a conductivity–temperature–depth probe (CTD; VE) or Niskin bottles (5 L or 10 L; ÖE) after the CTD cast. From the river plumes, surface water was occasionally sampled with a bucket (0 m). Water samples from immediately above the sediment (20–40 cm) were taken from the overlying water of intact sediment cores. To assign bottom water and core water samples to the BBL, the vertical BBL extent was identified based on the change in the potential density over the change in depth (Supplement Fig. S1). Since turbulent boundary layer flow leads to a constant potential density within the BBL (Turnewitsch and Graf, 2003), the vertical extent of the BBL is defined as the uppermost point in the water column (viewed from the sediment surface) where the variation in potential density exceeds a threshold of 0.01 kg m−3 (Holter-mann and Umlauf, 2012). In the Vistula Estuary, the verti-cal BBL extent was 3.2 ± 1.1 m in spring and 3.4 ± 1.4 m in summer (Bartl et al., 2018), and in the Öre Estuary, it was 2.9 ± 0.6 m and 1.9 ± 0.6 m, respectively (Supplement Table S2). Sediment samples were collected using a Gem-ini twin corer (core inner diameter 8 cm, length 80 cm; silt, ÖE), a multi-corer (core inner diameter 10 cm, length 60 cm; silt and fine sand, VE), and a HAPS bottom corer (core in-ner diameter 14 cm, length 30 cm; sand, all campaigns) with a vibration unit (KC Denmark; vibration time 10–15 s). Sur-face sediment slices (0–2 cm) were taken for basic sediment characteristics. Subsamples for N2production measurements
(n = 12 per station, except VEI: n = 20) and pore-water oxy-gen profiles (n = 3 per station) were collected in acrylic cores (inner diameter 2.3 cm, length 15 or 20 cm). The cores were pushed gently into the sediment so that 30 % (silt) to 50 % (sand) of their volume was filled with sediment, the re-maining volume consisting of overlying water, and they were closed without a gas headspace.
2.2 Environmental data 2.2.1 Water column
Water column measurements were carried out with CTD probes (VE: SBE911plus; ÖEI: SBE19plus; ÖEII: SBE19plus V2; all Seabird Scientific), equipped with either an additional sensor for dissolved oxygen (SBE43, Seabird-Scientific, VE) or a separate oxygen optode (4330, deraa) attached to a second CTD probe (Seaguard Aan-deraa, ÖE). Dissolved oxygen in the overlying core water was determined via Winkler titration (Grasshoff et al., 1999). Concentrations of dissolved inorganic N species (NO−2, NO−3, NH+4, µmol L−1, with the sum defined as DIN) were measured colorimetrically using a continuous segmented flow analyser (QuAAtro, Seal Analytical; ÖE) following Grasshoff et al. (1999) and HELCOM guidelines (2014) or as described in Bartl et al. (2018; VE). Background sub-traction of the colorimetric signals in Öre Estuary samples was used to account for the high dissolved organic matter content colouring the water. Concentrations of chlorophyll a
Table 1. Sampling details of the field campaigns, as well as river discharge and N loads during the sampling months, and the annual average. Site Field Date Season River dischargea TN load DIN load PON load
campaign (m3s−1) (t month−1) (% of TN) (% of TN) Öre Estuary ÖEI 20–24 Apr 2015 spring 66 98 17 29
ÖEII 3–7 Aug 2015 summer 26 26 3 22
annual average 36 36b 16b 26c Vistula Estuary VEI 28 Feb–10 Mar 2016 spring 1500 16 172 87 6 VEII 4–15 Jul 2014 summer 932 2621d 3d 10f annual average 1081 8131e 63e 8c
aÖre River: http://vattenwebb.smhi.se/station/, last access: 19 June 2017 (annual average: 2004–2014); Vistula River: annual average discharge (1951–1990; Pastuszak and
Witek, 2012); discharge of VEI and VEII from Polish national monitoring by the Institute of Meteorology and the Water Management National Research Institute.
bhttp://miljodata.slu.se/mvm/, last access: 19 June 2017 (1967–2014, without 1975).cAverage of spring and summer.dPolish national monitoring by the Institute of
Meteorology and the Water Management National Research Institute.eHelcom PLC database (http://nest.su.se/helcom_plc/, last access: 1 April 2018).fStepanauskas et al. (2002).
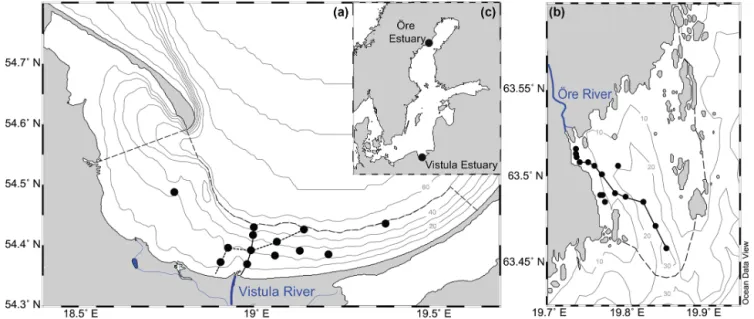
Figure 1. Map showing the locations of the Vistula Estuary (a) and Öre Estuary (b) in the Baltic Sea (c). The boundaries of the estuaries are indicated by the dashed lines (see Sect. 2.1 for details). Lines along the station points represent the transects shown in Figs. 2 and 3. Vistula Estuary: VEI (solid line); VEII (dotted line).
(Chl a, µg L−1) were measured using an optical sensor (Cy-clops 7, Turner Designs) attached to a CTD probe (Seaguard, Aandeera; ÖE) and by high-performance liquid chromatog-raphy (Lumi Haraguchi, unpublished data; ÖE) or accord-ing to the fluorometric method (Edler, 1979; Wasmund et al., 2006, VE). Particulate organic nitrogen and carbon con-centrations (PON, POC; µmol L−1) and the natural isotopic composition of POC (δ13C-POC; ‰) were measured using a continuous-flow isotope ratio mass spectrometer (IRMS; Delta V Advantage, Thermo Fisher Scientific) as described in Hellemann et al. (2017; ÖE) and Bartl et al. (2018; VE). The contribution of different POM sources to the total estuar-ine POM pool was estimated using a two-component mixing model (Goñi et al., 2003; Jilbert et al., 2018) with terrestrial POM (C : N of 20) and phytoplankton-derived POM (C : N of 8) as end members (Hellemann et al., 2017). Since high
C : N ratios can also indicate degraded POM due to the pref-erential utilisation of PON over POC (Savoye et al., 2003), δ13C-POC values were used to distinguish between terres-trial (δ13C-POC < −28 ‰ in Baltic rivers; Maksymowska et al., 2000; Rolff and Elmgren, 2000) and degraded POM. The degradation state of POM was analysed based on the mass ratio of POC : Chl a (µg µg−1) and the molar ratio of particu-late C : N (µmol µmol−1), both of which increase simultane-ously during degradation (Savoye et al., 2003). POC : Chl a ratios < 200 indicate newly produced phytoplankton POM, and those > 200 indicate degraded POM (Cifuentes et al., 1988).
2.2.2 Sediment
Sediments were characterised by grain size distribution, porosity, and loss on ignition (LOI), using standard meth-ods as described in Hellemann et al. (2017; ÖE) and Thoms et al. (2018; VE). Permeability (Km) of the sandy
sedi-ments was analysed according to the constant head method as described in Hellemann et al. (2017). Sediments with Km≥2.5 × 10⁻¹²m2 were considered sufficiently
perme-able to enperme-able advective pore-water flow with significant ef-fects on sediment biogeochemistry in the Baltic Sea, while in sediments with Km<2.5 × 10⁻¹²m2 these effects were
shown to be negligible and the sediments were hence de-fined as non-permeable (Forster et al., 2003). Oxygen pore-water concentration profiles were obtained at in situ tem-perature using Clark-type microelectrodes (ÖE, VEI: 200 to 250 µm vertical resolution, OX-100; VEII: 500 µm vertical resolution, OX-250; all Unisense) as described in Hellemann et al. (2017). The oxygen penetration depth (OPD) in the sediment was determined from each profile with the sedi-ment surface identified by a characteristic break in the pro-file curve and by additional visual estimates. Propro-files affected by fauna were discarded (max. 12 %–16 %). Samples for the determination of pore-water NH+4 concentrations were taken from intact sediment cores, either by core slicing (resolu-tion: 1 cm) under N2 atmosphere followed by
centrifuga-tion and filtracentrifuga-tion (fine silts ÖE) or according to Thoms et al. (2018) using Rhizons™(Rhizosphere Research Products; resolution: 1 cm at 1 to 5 cm depth, 2 cm at 5 to 11 cm depth; coarse silts and fine sands ÖE). Pore-water NH+4 samples were immediately frozen and kept at −20◦C until colori-metric measurement (Grasshoff et al., 1999), either manu-ally, using a spectrophotometer (UV-Vis 1201 LAMBDA2, Shimadzu, accuracy 5 %; fine silts ÖE), or automated, using a continuous segmented flow analyser (QuAAtro, Seal Ana-lytical, accuracy 5 %–10 %; coarse silts and fine sands ÖE). Pore-water NH+4 concentrations from the Vistula Estuary are reported in Thoms et al. (2018). The concentrations were vertically integrated for the surface (0–2 cm) and subsurface (2–10 cm) sediment layers to yield total pools of pore-water NH+4 (µmol m−2; Table 3).
2.3 Quantification of N-transformation processes 2.3.1 Nitrification and ammonium assimilation rates in
the BBL
Nitrification and ammonium assimilation were determined in
15N-NH+
4 tracer incubations (Damashek et al., 2016; Ward,
2011). Water samples were collected from the bottom wa-ter and the sediment overlying core wawa-ter and processed as described by Bartl et al. (2018). Briefly, six polycarbonate bottles were filled with water (core water: 170 mL, except VEII 100 mL; bottom water: 625 mL) and sealed gas-tight. The samples were amended with 15N−NH4Cl (98 atom %
15N, Sigma Aldrich) to yield a sample enrichment of
0.05 µmol L−1 (ÖE, VEI) or 0.20 µmol L−1 (VEII). Three samples were filtered immediately through pre-combusted glass-fibre filters (GF/F Whatman, 3 h at 450◦C), while the remaining triplicates were incubated for 5–7 h (ÖE, VEI) or 3 h (VEII) in the dark at in situ temperature. The short incu-bation time minimised isotope dilution via ammonification during the incubation (Ward, 2011). The incubation was ter-minated by filtration, and both the filtrates and the filters were stored at −20◦C. The15N content of NO−3 +NO−2 in the fil-trate was measured according to the denitrifier method (Cas-ciotti et al., 2002; Sigman et al., 2001), using a continuous-flow IRMS (Delta V Advantage, Thermo Fisher Scientific) connected to a Finnigan GasBench II (calibration against the standards IAEA-N3 and USGS-34; accuracy: ±0.14 ‰). Nitrification rates were calculated according to Veuger et al. (2013). Since the15N content of both NO−2 and NO−3 is measured simultaneously, the calculated nitrification rate is a bulk rate that includes NH+4 oxidation and NO−2 oxidation. The concentration and15N content of PON was measured from the filters as described by Bartl et al. (2018) using the same continuous-flow IRMS. Ammonium assimilation rates were calculated according to Dugdale and Wilkerson (1986). 2.3.2 Gaseous N production in the sediment
Benthic N2 and N2O production was measured using the
revised isotope pairing technique (r-IPT; Risgaard-Petersen et al., 2003), which accounts for the contributions of den-itrification and anammox to total N2 production. All
non-permeable sediment samples from the two estuaries were in-cubated using a diffusive set-up (Fig. S2), in which the over-lying water in the acrylic cores was enriched with K15NO3
(98 %15N, Cambridge Isotope Laboratories) to final concen-trations of 40, 80, and 120 µmol L−1 (n = 4 per concentra-tion, except n = 12 for 120 µmol L−1 VEI; isotope enrich-ment in the water [Fn]: 84 %–100 %; ÖE, VEI) or 30, 60, 90, and 120 µmol L−1 (n = 3 per concentration; Fn: 86 %– 100 %; VEII). Subsequently, the samples were incubated in the dark for 3–5 h at in situ temperatures under gentle wa-ter mixing by magnetic stirrers. The permeable sediment samples of VEII were also incubated this way, since ad-vective pore-water flow was most likely negligible during sampling (see Sect. 4.1.3). The permeable sediment sam-ples of VEI were incubated with an advective set-up, in which bottom water, enriched with K15NO3(98 %15N,
Cam-bridge Isotope Laboratories) to final concentrations of 40, 80, and 120 µmol L−1(n = 5–7 per concentration; Fn: 98 %– 100 %), was pumped through the advective sediment layer. This layer was determined from previously measured oxy-gen profiles and used as an approximation of the sediment depth affected by advective pore-water flow (Gihring et al., 2010; Fig. S2). The pumping rate (0.25 mL min−1; IPC high-precision tubing pump, ISMATEC) at site-specific porosities led to pore-water velocities of ∼ 7.6 cm h−1. The15N-NO−3
-enriched water was pumped from the top into the acrylic cores and drawn out of the cores through pre-drilled holes at two opposing core sides (vertical resolution 5 mm). This outflow was adjusted in each core to ∼ 5 mm above the ap-proximated oxic–anoxic interface in the sediment to ensure that the flow reached the interface where denitrification oc-curred but did not affect deeper layers. In- and outflow ports were sealed with rubber plugs through which Tygon®tubing (ST R-3603/R-3607; inner diameter 2.3 mm) was inserted; all connecting interfaces were tightened with Teflon®tape. During a pre-incubation (2.5–3 h), all resident pore water in contact with the estimated advective sediment layer was ex-changed with 15N-NO−3-enriched water. Subsequently, one core per concentration was sampled to obtain the start val-ues, while the tubing of the remaining cores was connected to a closed circulation for each core and incubated for ∼ 5 h (Fig. S2). Incubations were stopped by gently mixing the sediment with the overlying water. After brief sediment set-tling, 12 mL subsamples were placed into gastight glass vials (Exetainer, Labco Scientific) with 0.5 mL of ZnCl2 (100 %
w/v, Merck). A 5 mL helium headspace was created and the isotopic compositions of N2 and N2O were analysed using
a continuous-flow IRMS (IsoPrime 100, Isoprime; standard gas: N2, > 99.999 % purity, AGA) interfaced with a gas
pre-concentrator system (TraceGas, Isoprime) and an automated liquid handler (GX-271, Gilson) at the Department of En-vironmental Sciences, University of Jyväskylä, Finland (ÖE, VEI) or with a continuous-flow IRMS (Delta V Plus, Thermo Scientific; standard gas: Oztech N2, i.e. δ15N vs. air = −0.61;
Oztech Trading Co.) interfaced with a gas bench and a pre-concentrator system (Precon, Thermo Scientific) at the Sta-ble Isotope Facility, University of California, Davies, USA (VEII).
According to the r-IPT, a contribution of anammox to the measured N2 production is indicated when the
produc-tion rate of 14N-N2 (D14, calculated according to Nielsen,
1992) correlates positively with the added15N-NO−3 concen-trations. In this case, the calculation of N2production needs
to distinguish between denitrification and anammox rates and follows Risgaard-Petersen et al. (2003). If D14 does not cor-relate positively with the added 15N-NO−3 concentrations, denitrification is assumed to be the only process producing N2 and the calculations follow Nielsen (1992). Valid
appli-cation of the method further requires a linear dependency be-tween the production rate of 15N-N2 (D15) and increasing 15NO−
3 concentrations. All dependencies were tested with
a regression analysis (significance level: p<0.05). Denitri-fication of NO−3 from the bottom water (Dw) and from ni-trification within the sediment (Dn; coupled nini-trification– denitrification) was calculated from D14 and the ratio of
15N-NO− 3 to
14N-NO−
3 in the water phase (Nielsen, 1992;
Risgaard-Petersen et al., 2003).
2.4 Statistical analyses
The significance of the differences between the factors “site” (Öre Estuary, Vistula Estuary), “season” (spring, summer), and “sediment type” (permeable, non-permeable) was tested using the non-parametric Mann–Whitney U test (two fac-tors, n ≥ 3) or the non-parametric Kruskal–Wallis (KW) test (> two factors, n ≥ 3) combined with Dunn’s post hoc test (all SigmaPlot, version 13.0). Multivariate correlation anal-yses (Kendall’s τ , n ≥ 5) were done between environmental variables and rates of nitrification (ÖEII), ammonium assim-ilation (ÖEII, VE), and denitrification (ÖEII, VE) using SAS (version 9.4). The ÖEI data could not be analysed in correla-tion analyses because the sample size was too small (n ≤ 4). In all analyses, the significance level was p < 0.05.
3 Results
3.1 Environmental variables 3.1.1 Water column
The plumes of the Öre and Vistula rivers, extended verti-cally to ∼ 2 m (ÖE) and ∼ 5 m (VE) in spring and to ∼ 6 m (ÖE) and ∼ 1 m (VE) in summer (Figs. 2, 3). Horizontally, the river plumes covered up to 50 % of the respective estu-arine area (not shown). The water column below the river plumes was well-mixed in spring (Fig. 2) and characterised by a thermohaline stratification in summer (Fig. 3). In both estuaries, oxygen conditions differed seasonally but all water layers were oxic with > 230 µmol L−1(Table S2). In spring, DIN concentrations were more than 30 times higher in the Vistula than in the Öre River plume and estuarine surface waters, while concentrations in the BBL differed by a fac-tor of 2 (Fig. 2; Table S2). In summer, DIN concentrations were < 2.0 µmol L−1in the river plumes and surface waters and increased with depth in both estuaries (Fig. 3; Table S2). In the BBL of the Öre Estuary, summer NH+4 concentra-tions were 2–3 times lower (U test, p<0.001; Fig. 3) and the NO−3+NO−2 concentrations 2 times higher (U test, p<0.001; Table S2) than in the Vistula Estuary. The concentrations of POC and PON were similar in both estuaries in spring, but summer concentrations in the surface water were twice as high in the Vistula Estuary compared to the Öre Estuary (U test, p = 0.002). In the BBL, POC and PON concentrations were significantly higher in summer than in spring (ÖE: U test, p = 0.037; VE: Bartl et al., 2017; Table 2), whereby summer concentrations were more than 2-fold higher in the Öre than in the Vistula Estuary (POC: U test, p = 0.040; PON: U test, p = 0.048; Fig. 3; Table 2).
The POM of the Öre River and its plume contained a large share of terrestrial organic matter in both seasons, as reflected by the high C : N ratios and depleted δ13C-POC values (Table 2). By contrast, in the Vistula River and its plume, POM was mainly phytoplankton-derived (Table 2). In
Figure 2. Environmental variables of the water column along a sampling transect (vertical points) from the river mouth to the outlets of the Öre (left) and Vistula (right) estuaries in spring. Note that, due to different optical properties of the water and different measurement methods, the Chl a concentrations are not directly comparable between the two estuaries; rather, the figures provide qualitative information on the presence or absence of phytoplankton. Bottom topography was estimated from the water depths of the stations. The dashed line represents the vertical extent of the BBL (see Sect. 2.1.1). The plots were derived from 12 (Öre Estuary) and 6 (Vistula Estuary) profiles using DIVA-gridding in Ocean Data view (Schlitzer, 2015). Plots of salinity, temperature, and PON in the Öre Estuary are reproduced from Hellemann et al. (2017).
Table 2. Characteristics of particulate organic matter in the Öre and Vistula estuaries in spring and summer. The contribution of POM sources (terrestrial and phytoplankton) was estimated based on a two-component mixing model following Jilbert et al. (2018), using end members from Goñi et al. (2003). Values are average and standard deviation of each water layer. The number of replicates is shown in parentheses; NA – not available.
Site Season Location POC PON δ13C-POC C : N Chl a POC : Chl a Terrestrial POM Phytopl. POM (µmol L−1) (µmol L−1) (‰) (molar) (µg L−1) (mass) (%) (%)
Öre spring river 153.6 11.2 −29.1 13.7. NA NA 71 29 (1)
Estuarya river plume 53.7 5.1 −29.5 10.6 3.3 ± 1.2 (4) 196 44 55 (1) surface 40.2 ± 13.5 4.3 ± 1.4 −25.7 ± 1.0 9.3 ± 0.8 (8) 5.7 ± 0.2 (6) 89 ± 27 (5) 19 ± 16 83 ± 16 (8) BBL 36.8 ± 14.1 4.2 ± 1.5 −25.0 ± 1.0 8.7 ± 1.1 (10) 5.3 ± 1.8 (5) 79 ± 28 (5) 19 ± 16 81 ± 16 (10) summer river 67.2 5.7 −30.2 11.7 NA NA 56 44 (1) river plume 46.9 ± 0.7 4.1 ± 0.7 −28.7 ± 0.2 11.8 ± 1.9 (3) 2.6 ± 0.7 (6) 214 55 ± 16 45 ± 16 (3) surface 34.1 ± 7.9 4.0 ± 0.8 −26.5 ± 0.6 8.5 ± 0.7 (13) 2.4 ± 0.6 (7) 181 ± 87 (4) 15 ± 11 85 ± 11 (13) BBL 135.9 ± 85.5 13.1 ± 8.4 −26.1 ± 0.3 10.2 ± 0.9 (9) 0.6 ± 0.0 (3) 4596 ± 1447 (3) 38 ± 11 62 ± 11 (9) Vistula spring river 164.2 16.5 −25.7 10.0 3.48 567 37 63 (1) Estuaryb river plume 61.1 ± 25.9 6.9 ± 2.5 −26.5 ± 1.4 8.9 ± 1.5 (8) 6.8 ± 2.8 (8) 121 ± 54 (8) 25 ± 14 75 ± 14 (8) surface 45.6 ± 15.8 5.8 ± 2.4 −24.8 ± 0.7 8.1 ± 1.2 (6) 7.0 ± 2.1 (6) 79 ± 17 (6) 10 ± 16 90 ± 16 (6) BBL 25.4 ± 13.6 2.6 ± 1.3 −25.6 ± 0.8 9.8 ± 1.9 (18) 2.1 ± 1.3 (18) 164 ± 77 (18) 31 ± 24 69 ± 24 (18) summer river NA NA NA NA NA NA NA NA river plume 103 10.2 −25.8 10.1 3.1 402 33 67 (1) surface 73.6 ± 34.6 8.3 ± 3.7 −25.7 ± 0.6 8.8 ± 0.6 (7) 4.6 ± 2.0 (7) 200 ± 62 (7) 20 ± 10 80 ± 10 (7) BBL 46.9 ± 30.7 5.3 ± 5.5 −25.4 ± 0.8 8.9 ± 0.3 (11) 0.8 ± 0.6 (7) 630 ± 307 (5) 15 ± 10 85 ± 10 (9)
aPOC, PON, δ13C-POC, C : N, terrestrial POM, and phytoplankton POM from Hellemann et al. (2017).bPOC, PON, and C : N from Bartl et al. (2018).
Table 3. Sediment characteristics in the Öre and Vistula estuaries in spring and summer. Permeability (Km), porosity (φ), and loss on ignition (LOI) are determined from the pooled surface sediment (0–2 cm); NH+4 pools are derived from vertically integrated pore-water concentrations over the surface (0–2 cm) and the subsurface (2–10 cm) sediment layer; oxygen penetration depth (OPD) is derived from oxygen profiles. All data are given as average and standard deviation (except for bottom depth), with the number of replicates in parentheses.
Site Season Bottom Sediment type Km φ LOI OPD NH+
4 surface pool NH + 4 deep pool
depth (10−12m2) (dw %) (mm) (µmol m−2) (µmol m−2) (m)
Öre Estuarya
spring 18–37 silt, very coarse silt, very fine sand
non-permeable
0.1 ± 0.1 (2) 0.8 ± 0.1 (6) 7.8 ± 4.3 (6) 7.2 ± 0.9 (13) 360 ± 232 (3) 4743 ± 1845 (6)
summer 18–34 silt, very coarse silt, very fine sand non-permeable 0.2 ± 0.1 (2) 0.7 ± 0.1 (6) 4.8 ± 3.2 (6) 3.5 ± 0.9 (38) 473 ± 309 (7) 4079 ± 2331 (7) Vistula Estuaryb
spring 22–36 fine and medium sand
permeable 6.9 ± 3.6 (7) 0.4 ± 0.0 (8) 0.9 ± 0.3 (8) 10.1 ± 4.5 (40) 92 ± 48 (4) 2899 ± 1103 (4)
16–59 very fine and fine sand
non-permeable
– 0.6 ± 0.2 (3) 2.8 ± 1.9 (3) 3.2 ± 0.9 (21) 428 ± 173 (2) 15 362 ± 5996 (2)
summer 25–49 fine medium and coarse sand
permeable 9.0 ± 8.1 (5) 0.4 ± 0.0 (5) 1.2 ± 0.7 (5) 4.1 ± 1.3 (20) 336 ± 183 (5) 4596 ± 1432 (5)
17–50 very fine and fine sand
non-permeable
0.7 ± 0.2 (2) 0.6 ± 0.1 (3) 6.3 ± 4.7 (3) 3.2 ± 1.2 (13) 574 ± 284 (3) 11 422 ± 7108 (3)
aData from Hellemann et al. (2017), except NH+
4 pools.bSediment type, porosity, and LOI from Thoms et al. (2018).
the estuarine water column (river and river plume excluded) phytoplankton-derived POM dominated in both estuaries and in both seasons (Table 2), which was also reflected in the ele-vated Chl a concentrations measured in the entire water col-umn in spring and in the surface water in summer (Table 2; Fig S. 2 and 3). The particulate C : N ratio in the surface wa-ter did not differ between estuaries or seasons but was signif-icantly higher in the BBL of the Öre than the Vistula Estuary in summer (U test, p = 0.005; Fig. 4, Table 2). In both es-tuaries, POC : Chl a ratios were < 200 throughout the water
column in spring and > 200 in the BBL in summer, whereby the summer ratio in the Öre Estuary was 7 times larger than in the Vistula Estuary (Fig. 4, Table 2).
3.1.2 Sediment
Permeable sediments were estimated to cover ∼ 56 % of the Vistula Estuary (Fig. S3), whereas the sediments in the Öre Estuary were non-permeable (Hellemann et al., 2017). LOI differed significantly between permeable and non-permeable
Figure 4. Ratio of particulate C : N ratio plotted against the ratio of POC : Chl a in the BBL of the Vistula (VE) and Öre (ÖE) estuaries in spring and summer. According to Savoye et al. (2003), a C : N ratio of > 12 is assigned as terrestrial (terr) particulate organic mat-ter (POM); according to Cifuentes et al. (1988), a POC : Chl a ratio < 200 indicates newly produced phytoplankton POM (phyt), and a ratio of > 200 degraded phytoplankton POM (degr).
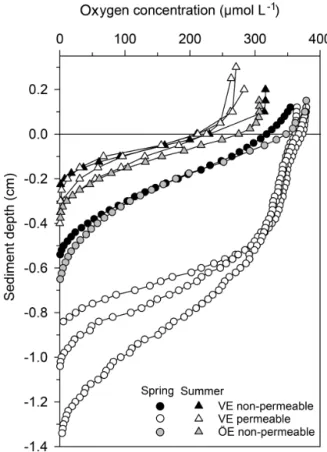
sediments (U test, p<0.001) but was similar both between the non-permeable sediments of the two estuaries and be-tween spring and summer (Table 3). The oxygen profiles in the permeable sediments of the Vistula Estuary in spring were sigmoidal, with nearly constant oxygen concentrations in the top millimetres of the sediment, and nearly parabolic in summer, similar to the profiles of the non-permeable sed-iments in both seasons (Fig. 5). Thus, the mean OPD in the permeable sediments in summer was 60 % lower than in spring (U test, p = 0.003) and similar to the summer OPD in the non-permeable sediments (Table 3). In addition, pore-water NH+4 pools differed seasonally in the permeable sur-face sediments of the Vistula Estuary, with ∼ 73 % more NH+4 in summer than in spring (U test, p = 0.016). The deep NH+4 pool of the non-permeable sediments was signif-icantly higher in the Vistula than in the Öre Estuary (U test, p =0.008) but similar between seasons (Table 3).
3.2 Nitrogen transformation processes
3.2.1 Nitrification and ammonium assimilation in the BBL
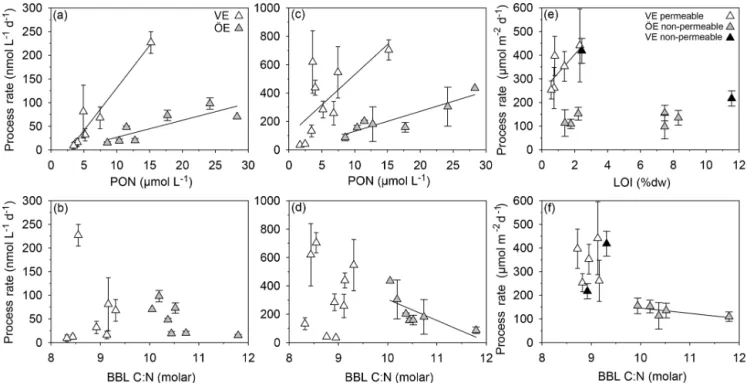
Nitrification rates did not significantly differ between estu-aries or seasons (KW test, p = 0.478; Table 4). In both es-tuaries, the summer nitrification rates correlated positively with the PON and POC concentrations (VE: Kendall’s τ : 0.81, p = 0.01, n = 7 (Bartl et al., 2018); ÖE: Kendall’s τ: 0.71, p = 0.02, n = 7; Fig. 6a). Additionally, a negative trend with the particulate C : N ratio was found for summer nitrification rates in the Öre Estuary (Kendall’s τ : −0.53, p =0.10, n = 7; Fig. 6b). Ammonium assimilation rates
dif-Figure 5. Pore-water oxygen concentration profiles in the perme-able (n = 3) and non-permeperme-able (n = 1) sediments of representa-tive stations of the Vistula Estuary (VE) and in the sediments of the Öre Estuary (ÖE, n = 1) in spring and summer. Profiles of the Öre Estuary are reproduced from Hellemann et al. (2017); please note that no permeable sediment exists in the Öre Estuary. The zero line indicates the sediment surface.
fered seasonally in the Vistula Estuary (spring<summer; U test, p = 0.006) but not in the Öre Estuary (Table 4). In spring, these rates were 3 times higher in the Öre than in the Vistula Estuary (U test, p = 0.044), while rates from the summer season were similar (Table 4). Ammonium assimi-lation correlated positively with the PON and POC concen-trations in both estuaries (VE: Kendall’s τ : 0.61, p = 0.02, n =9; ÖE: Kendall’s τ : 0.71, p = 0.02, n = 7; Fig. 6c) and negatively with the particulate C : N ratio in the Öre Estuary in summer (Kendall’s τ : −0.71, p = 0.02, n = 7; Fig. 6d). 3.2.2 Denitrification and anammox in the sediment Anammox was not detected at any of the sites, indicating that N2production in both estuaries originated entirely from
denitrification. N2O production during denitrification was
≤1.8 % of total N2 production in all samples, and
denitri-fication rates are presented as the sum of N2and N2O.
Den-itrification rates in the Öre Estuary were not detectable in spring, and summer rates were ≥ 60 % lower than in the Vistula Estuary (U test, p<0.001). In the Vistula Estuary,
Figure 6. Correlations of nitrification rates with the PON concentration (a) and particulate C : N ratio (b) and of ammonium assimilation rates with the PON concentration (c) and particulate C : N ratio (d) in the BBL; coupled nitrification–denitrification rates with LOI (e) and the particulate C : N ratio (f) in the sediment of Vistula (VE) and Öre (ÖE) estuaries. Solid lines indicate significant correlations.
Table 4. Rates of ammonium assimilation and nitrification in the BBL and of denitrification in the sediments of the Öre and Vistula estuaries in spring and summer. Öre Estuary sediments are non-permeable; thus no rates are available in the permeable sediments (NA). Denitrification in the Öre Estuary in spring was not detectable (ND). All rates are given as average and standard deviation, with the number of replicates in parentheses; the maximum rate is shown below. %Dn gives the share of coupled nitrification–denitrification in total denitrification.
Site Season Ammonium assimilation Nitrification Denitrification
BBL BBL Permeable sediment Non-permeable sediment (nmol L−1d−1) (nmol L−1d−1) (µmol N m−2d−1) %Dn (µmol N m−2d−1) %Dn
Öre Estuarya spring 92 ± 70 (4) 21 ± 7 (4) NA NA ND ND 211 29 summer 218 ± 107 (7) 49 ± 30 (7) NA NA 138 ± 47 (65) 93 304 98 290 Vistula Estuaryb spring 36 ± 16 (9) 41 ± 22 (11) 72 ± 37 (19) 81 140 ± 52 (50) 79 73 84 162 285 summer 319 ± 232 (10) 64 ± 72 (7) 354 ± 127 (49) 97 349 ± 117 (21) 90 704 227 652 584
aDenitrification rates from Hellemann et al. (2017).bNitrification and ammonium assimilation rates from Bartl et al. (2018).
spring denitrification rates were 50 % lower in the perme-able than in the non-permeperme-able sediment, but no difference was found in summer (Table 4). In both estuaries, denitri-fication was primarily coupled to nitridenitri-fication in the sedi-ment (spring: ∼ 80 %; summer: ≥ 90 %). Dn correlated pos-itively with LOI in the surface sediments of the Vistula Estu-ary in summer (Kendall’s τ : 0.73, p = 0.04, n = 6, one non-permeable site excluded) but not in spring (spring: Kendall’s τ: 0.40, p = 0.33, n = 5) nor in the Öre Estuary (Kendall’s
τ: 0.14, p = 0.70, n = 6; Fig. 6e). Dn correlated negatively with the particulate C : N ratio in the Öre Estuary (Kendall’s τ: −0.80, p = 0.05, n = 5; Fig. 6f) but not in the Vistula Es-tuary (spring: Kendall’s τ : 0.20, p = 0.63, n = 5; summer: Kendall’s τ : 0.24, p = 0.45, n = 7).
4 Discussion
4.1 Environmental settings of the Vistula and Öre estuaries
4.1.1 Site-specific and seasonal environmental settings The main difference between the estuaries is their trophic state (eutrophied vs. oligotrophic) due to the 2-magnitude-higher nutrient load of the Vistula River (Table 1). The cor-responding high nutrient availability in the photic zone of the Vistula Estuary supports an annual primary production rate that is ∼ 6 times higher (225 g m−2yr−1; Witek et al., 1999) than in the nutrient-limited Öre Estuary (39 g m−2yr−1; Ask et al., 2016). This difference was well reflected by the higher concentrations of Chl a and POM in the surface wa-ter of the Vistula Estuary in summer (Table 2). While the POM concentrations in the rivers were surprisingly similar, their sources differed significantly. POM from the Vistula River and its plume is mainly phytoplankton-derived (Ta-ble 2; Maksymowska et al., 2000) and thus easily degrad-able, whereas the large share of terrestrial POM in the Öre River and its plume is likely refractory, was observed to set-tle right at the river mouth (Forsgren and Jansson, 1992), and is thus not likely an important substrate source for benthic N turnover. Interestingly, despite the different primary pro-duction rates and riverine POM sources, more than 60 % of the benthic POM is phytoplankton-derived in both estuaries, though degraded to different degrees. In the Vistula Estuary, the continuous input of labile POM likely results in the less degraded state of benthic summer POM, as determined from lower C : N and POC : Chl a ratios than in the Öre Estuary (Fig. 4c). Its remineralisation presumably accounted for the higher concentration of NH+4 not only in the BBL in sum-mer (Fig. 3) but also on a long-term scale as reflected by the large NH+4 pools in the non-permeable sediment (Ta-ble 3). In the Öre Estuary, by contrast, low river loads and pri-mary production rates result in comparatively small inputs of phytoplankton-derived POM to the benthic system, where it seems to be effectively sequestered over the course of 1 year (Hellemann et al., 2017) resulting in a more degraded state of benthic summer POM compared to the Vistula Estuary (Fig. 4c).
In contrast to the quality, the different trophic states of the two estuaries were not reflected in the quantity of ben-thic POM, which was surprisingly higher in the BBL of the Öre Estuary in summer. This points to the influence of es-tuarine geomorphology, which determines particle and water residence times (Seitzinger et al., 2006; Statham, 2012). The basin-like topography of the Öre Estuary and the restricted water exchange across the elevation of the estuary’s outlet (Figs. 1, 2) result in a particle residence time of up to 1 year (Brydsten and Jansson, 1989) likely allowing enhanced ac-cumulation of settled POM during the productive seasons. Conversely, the open shape of the Vistula Estuary may limit
a long-term accumulation of benthic POM as unrestricted lat-eral transport could lead to its export, likely resulting in the lower summertime POM concentrations compared to the Öre Estuary. In addition, the large area of permeable sandy sed-iments that can experience advective pore-water flow likely contribute to an efficient degradation of POM in the sedi-ment of the Vistula Estuary (Boudreau et al., 2001; Huettel and Rusch, 2000).
Besides the trophic and geomorphological contrasts, the two estuaries share similar features related to the seasonal water column stratification and the corresponding distribu-tions of DIN and POM. In spring, when the riverine nutri-ent loads are highest, haline stratification prevnutri-ents the direct contact of river plume DIN with the aphotic benthic system. Instead, DIN remains in the photic surface layer where it is either exported or taken up by primary producers during the spring bloom. Elevated Chl a concentrations in the BBL dur-ing the sprdur-ing sampldur-ings compared to the summer (Table 2) or the winter season (< 1 µg L−1; Bartl et al., 2018; DBotnia, 2016) and the dominance of phytoplankton-derived POM in the BBL (Table 2) suggest that newly produced POM rapidly sediments to the aphotic benthic system. In summer, reduced vertical mixing, thermohaline stratification, and increased bottom water temperature allow enhanced benthic remineral-isation of POM and thus N turnover, thereby slightly lower-ing the oxygen concentrations and increaslower-ing the NH+4 con-centrations in the BBL of both estuaries (Table S2). Conse-quently, riverine DIN is supplied to the benthic system indi-rectly, via POM build-up and sedimentation which uncouples the peak river N load in spring from enhanced N turnover in the benthic system in summer (Hellemann et al., 2017; Jäntti et al., 2011).
4.1.2 Permeable sediments of the Vistula Estuary Permeable sediments are known to experience advective pore-water flow, which significantly influences nutrient and organic matter turnover (Huettel et al., 2014). In the perme-able sediments of the Vistula Estuary, advective pore-water flow was indicated in spring by the sigmoidal shape of the oxygen profiles (Revsbech et al., 1980) and the low pore-water NH+4 pools, similar to the subtidal permeable sedi-ments in the North Sea (Ehrenhauss et al., 2004; Lohse et al., 1996). The low NH+4 pore-water pools likely result from enhanced nitrification in the large oxic sediment layer and/or enhanced NH+4 release through advection (Huettel et al., 1998). However, the strikingly higher NH+4 pools, the nearly parabolic shape of the oxygen profiles, and the shallow OPDs in summer (Table 3) rather suggest NH+4 accumulation and the dominance of diffusive transport despite the permeable character of the sandy sediments in that season. Similar sea-sonally differing oxygen profiles have also been found in the permeable sediments of the German Bight, North Sea, where the parabolic profile shape in summer is attributed to the “ab-sence of a turbulent water column” (Lohse et al., 1996). The
authors of that study also observed that oxygen consump-tion in the sediment can distort the shape of originally advec-tive (sigmoidal) oxygen profiles within 30–60 min at a dif-fusive oxygen uptake (DOU) rate of 6.7 mmol m−2d−1. In our study, oxygen profiles were measured within ∼ 30 min of the first sampling and had a much lower summer DOU (0.6 ± 0.3 mmol m−2d−1; n = 21). It is therefore unlikely that the observed parabolic profile shape resulted from strong oxygen utilisation occurring prior to the measurements. In-stead, we assume that the pressure gradients at the sediment surface in summer were too low to induce advective pore-water flow. Such pressure gradients mainly originate from waves or from the interaction of near-bottom flow and the bottom topography (Santos et al., 2012). To examine whether the interaction of near-bottom flow with a topographic object could, at least theoretically, create pressure gradients suffi-cient to drive advection, we used modelled near-bottom flow velocity data of our sampling period and estimated pressure gradients and the Peclet number (Bear, 1972; see Supple-ment). The modelled near-bottom flow velocity was very low (< 2.5 cm s−1) and resulted only in minor pressure gradients (< 0.15 Pa) at a 3 cm high mound (Table S3). The calculated Peclet number was below the threshold for pore-water ad-vection within the sediment (≥ 5; Bear, 1972; Table S3). We therefore suggest that, at the time of the summer cruise, the pressure gradients at the sediment surface of the Vistula Es-tuary were too low to induce an advective pore-water flow able to significantly affect sediment biogeochemistry, leav-ing diffusion and fauna-induced fluxes as the main trans-port processes during that time. Presumably, this temporary switch between transport regimes is more likely to occur in low-energy environments, such as the non-tidal Baltic Sea. Further research is needed to evaluate the frequency of such changes and their impact on biogeochemical processes. 4.2 Effects of contrasting environmental settings on
benthic microbial N turnover
4.2.1 Nitrification and ammonium assimilation in the BBL
Nitrification rates are often higher in eutrophied than in olig-otrophic estuaries, due to the increased availability of the substrate NH+4 and higher concentrations of POM (Bianchi et al., 1999; Dai et al., 2008; Damashek et al., 2016). Yet, rates of coastal nitrification cover an extremely large range (0.2– 14 400 nmol L−1d−1; Brion et al., 2008; Bristow et al., 2015; Damashek et al., 2016; Heiss and Fulweiler, 2016; Hsiao et al., 2014) due to the heterogeneity of coastal systems. While the nitrification rates determined in this study are in the lower spectrum of globally acquired rates, they are similar to pre-viously reported nitrification rates in the Baltic Proper (0– 84 nmol L−1d−1at a water depth of 80–117 m; Hietanen et al., 2012). The similarity of the nitrification rates in the two estuaries is unexpected, given the difference in their trophic
states. However, this might be explained by a recent study that found similar gene and transcript abundances as well as similar community compositions of ammonium-oxidising archaea and bacteria in the BBL of the Vistula and Öre es-tuaries (Happel et al., 2018). The positive correlations be-tween the nitrification rates and the concentrations of PON and POC at both sites indicate a regulation of nitrification by particle-attached nitrifiers (Karl et al., 1984; Phillips et al., 1999), which profit from the direct NH+4 supply during PON degradation (Bartl et al., 2018; Hsiao et al., 2014; Kla-wonn et al., 2015). Furthermore, recent studies found nitri-fying species capable of degrading organic nitrogen com-pounds to obtain NH+4 directly (Kuypers et al., 2018; Yager et al., 2012). Such organisms may also contribute to the pos-itive correlation between nitrification rates and PON in our study.
The only difference between the two estuaries that seems to influence nitrification was the quality of benthic POM, as defined by its C : N ratio. This was also shown to be the case for nitrification in soils (Bengtsson et al., 2003) and may ap-ply to coastal systems as well. With increasing PON con-centration, the increase in nitrification was stronger in the Vistula than in the Öre Estuary (Fig. 6), likely due to the less degraded state of the POM in the former (Fig. 4). By contrast, the more degraded POM in the Öre Estuary lim-its nitrification due to the limited availability of organic N as a potential NH+4 source, which is reflected by the nega-tive correlation between nitrification rates and the C : N ratio (Fig. 6). Hence, a combination of the concentrations of POC and PON and their ratio, i.e. the POM quality, likely influ-enced nitrification in the Öre Estuary. In addition to PON, a second source of NH+4 might have been sedimentary NH+4 release. Corresponding total NH+4 fluxes measured by Thoms et al. (2018) in the Vistula Estuary in spring 2016 (same cruise) did not correlate with the nitrification rates presented here (not shown). These total NH+4 fluxes were measured with in situ chamber incubations, which, however, neglect advective pore-water flow (Thoms et al., 2018). Hence addi-tional rate and flux data are needed to thoroughly determine the contribution of sedimentary NH+4 release as a substrate source for nitrification in the BBL.
The ammonium assimilation rates measured in this study represent typical coastal rates, similar to rates deter-mined in the surface water of the Delaware Estuary (13– 930 nmol L−1d−1; Hoch and Kirchman, 1995) and in the bottom water of the Washington coast (500 nmol L−1d−1; Ward et al., 1984). Ammonium assimilation is both a substrate- and a temperature-dependent heterotrophic pro-cess (Baer et al., 2014; Hoch and Kirchman, 1995) which suggests increased rates in the eutrophied Vistula Estuary and in summer, respectively. However, the eutrophied state of the Vistula Estuary did not result in higher rates, while the warmer temperature in the BBL in summer clearly enhanced ammonium assimilation in both estuaries. Interestingly, am-monium assimilation showed the same correlation patterns
with PON, POC, and C : N as found for the nitrification rates (Fig. 6), indicating that labile POM also plays an important role as a substrate source for NH+4-assimilating microbes. 4.2.2 Denitrification in the sediment
Denitrification rates are commonly enhanced in eutrophied ecosystems due to the greater availability of organic C and NO−3 (Seitzinger et al., 2006). This was also the case for the Vistula Estuary, where denitrification rates were more than 2-fold higher than in the Öre Estuary (Ta-ble 4) and similar to rates from other eutrophied Baltic estuaries (320–360 µmol N m−2d−1, Bonaglia et al., 2014; 90–910 µmol N m−2d−1, Silvennoinen et al., 2007; 290– 350 µmol N m−2d−1, Nielsen and Glud, 1996). The higher availability of labile POM in the benthic system supplied organic C and N, with the latter serving as source for ammonification subsequently driving coupled nitrification– denitrification (Dn). As a result denitrification in the Vistula Estuary increased significantly with increasing organic mat-ter concentrations as also reported for other coastal systems (Finlay et al., 2013; Jäntti et al., 2011; Seitzinger and Nixon, 1985). By contrast, the more degraded state of the POM in the Öre Estuary reduced the availability of organic N and C substrates, which is likely the reason for the negative corre-lation between denitrification and the particulate C : N ratio (Fig. 6f). The results from both estuaries are consistent with previous findings of a dependency of denitrification on the quality of organic matter (Eyre et al., 2013; Hietanen and Kuparinen, 2008).
The limited denitrification rates in the colder spring sea-son can be attributed to the low availability of labile organic C (Bradley et al., 1992; Hellemann et al., 2017) as denitri-fication uses organic C and NO−3 in a 1 : 1 ratio (Taylor and Townsend, 2010). While newly produced POM was present in both benthic systems during the spring samplings (Fig. 4), low bottom water temperatures (Fig. 2) likely slowed its degradation to dissolved C components suitable for denitri-fication. Such limitation has been found previously also in other coastal sediments of the Baltic Sea in the same season (Hietanen and Kuparinen, 2008; Jäntti et al., 2011).
In both estuaries and both seasons, denitrification mainly used NO−3 from nitrification in the sediment and not NO−3 from the BBL, which is common in coastal sediments with sufficiently deep oxygen penetration and low NO−3 concen-trations in the water overlying the sediment (Rysgaard et al., 1994). This was also true for the permeable sediments un-der advective pore-water flow in the Vistula Estuary and is in agreement with the results of Rao et al. (2008) and Marchant et al. (2016). Advective pore-water flow can favour Dn over Dw by enhancing nitrification through an increase in the oxic sediment volume (Gihring et al., 2010; Huettel et al., 1998; Marchant et al., 2016) and by increasing the areal extent of the oxic–anoxic interface across which NO−3 and NH+4 are exchanged (Cook et al., 2006; Precht et al., 2004). However,
because advective pore-water flow affects sediment biogeo-chemistry in complex ways, there is no consistent pattern re-garding a general domination of Dn or Dw in permeable sed-iments (Kessler et al., 2013; Gihring et al., 2010; Marchant et al., 2016; Rao et al., 2007).
4.2.3 Measurement of denitrification rates in the permeable Vistula sediment
The permeable sediments along the southern coast of the Baltic Sea are assumed to account for substantial N removal as a result of high N turnover related to pore-water flow (Ko-rth et al., 2013; Voss et al., 2005a), similar to permeable sediments in the North Sea and Atlantic Bight (Gao et al., 2012; Rao et al., 2007). In this study, the permeable sedi-ments of the Vistula Estuary in spring experienced advective pore-water flow, and denitrification rates were correspond-ingly measured using an advective incubation design. The determined rates were lower than those of the non-permeable sediments during the same season, presumably due to the limitations of our incubation design in representing advec-tive pore-water flow. During the incubation, pore-water flow velocities were within the range of those in sediments under-lying high-energy waters (Huettel et al., 1996; Precht et al., 2004) and therefore probably too high to realistically repre-sent Baltic Sea conditions. Over the course of the incubation, the flow increased the initial OPD in most of the investigated sediment cores (data not shown), leading to the oxygenation of formerly anoxic sediment layers and a downwards shift of the oxic–anoxic interface. The delay until the microbial community adapted to the new conditions might explain the measured low rates of denitrification. Yet, at the time of the spring cruise, denitrification was limited by the low avail-ability of labile dissolved organic C. It is therefore unlikely that in situ denitrification rates in the permeable sediment would have been significantly higher than those measured in the non-permeable sediment, even with a better simulation of advective pore-water flow.
4.3 Key drivers of the coastal N filter in the Öre and Vistula estuaries
In the two estuaries studied here, POM was found to be an essential link between land-derived DIN in the surface waters and the spatially and temporally separated benthic processes such as nitrification, ammonium assimilation, and denitrifi-cation. Through benthic–pelagic coupling, POM likely func-tions as a carrier and temporary reservoir of organic N and C that controls the process rates of benthic N retention and removal (Hellemann et al., 2017).
To better understand this coupling, we estimated the amount of riverine DIN potentially taken up by primary pro-duction. In the Öre Estuary, N uptake in April 2015 was cal-culated using a primary production rate of 0.39 g C m−2d−1 (DBotnia, 2016), the Redfield C : N ratio of 6.6, and the
es-tuarine area of 71 km2. The resulting areal N uptake rate of 4.9 t d−1was 1 order of magnitude higher than the riverine DIN load during the same period (0.53 t d−1). Thus, it is likely that all riverine DIN and also riverine DON (dissolved organic nitrogen) (Stepanauskas et al., 2002) were readily consumed by phytoplankton. Due to the shallow depth, a considerable amount of this easily degradable POM sinks to the bottom and may remain in the benthic system for over 1 year (Brydsten and Jansson, 1989). During that time pe-riod N could undergo cycles of retention via ammonifica-tion, nitrificaammonifica-tion, reassimilation to PON, and DNRA before it is removed via sedimentary denitrification (Hellemann et al., 2017). Thus, even at low process rates, the estuary may be an effective coastal N filter of the low riverine TN loads, mainly accomplished through its geomorphology that allows long particle residence times (Fig. 7).
In the Vistula Estuary, primary production rates, estimated from the riverine DIN load in March 2016 (453 t d−1), would need to be as high as 3.1 g C m−2d−1 to result in the com-plete consumption of riverine DIN. However, known pri-mary production rates are lower with 0.3–2.8 g C m−2d−1 (March–May, Voss et al., 2005b; Witek et al., 1999) and would consume 10 %–90 % of the Vistula DIN input of March 2016. Due to the open shape of the estuary, unre-stricted water exchange may reduce the residence time of both DIN and newly produced POM allowing their export out of the Vistula Estuary (Fig. 7). Residence times and transport in the surface water of the Vistula Estuary strongly depend on wind direction and wind speed (Matciak and Nowacki, 1995; Voss et al., 2005b). Short-term eddy formations dur-ing southerly and south-easterly winds have been observed to transport small amounts of riverine DIN out into the open Baltic Sea (Voss et al., 2005b), whereas the predominant south-westerly and westerly winds lead to alongshore east-ward coastal currents, so that DIN and POM could largely remain within the coastal rim of the southern Baltic zone (Radtke et al., 2012; Siegel et al., 1996; Voss et al., 2005a, b). We assume that the predominant alongshore transport of DIN and POM extends the N filter of the Vistula Estu-ary to the adjacent coastal zones where further DIN uptake, POM sedimentation, and benthic microbial N retention and removal facilitate a coastal filter function over a larger area and a longer timescale. However, to thoroughly understand the N filter function and its efficiency in the Vistula Estuary and adjacent coastal zones, the effects of wind conditions on current dynamics and residence time not only in the surface water but also in intermediate and bottom water layers need to be resolved.
Furthermore, the microbial N processes studied here are not sufficient to elucidate the role and magnitude of N reten-tion in the Öre and Vistula estuaries since actual rate mea-surements of DIN uptake by primary producers, ammonifi-cation as well as nitrifiammonifi-cation and DNRA in the sediment, and in situ fluxes across the sediment water interface are lacking (Fig. 7). Nitrification and DNRA in the sediment
have been the particular focus of a few recent studies of Baltic coastal systems where the rates varied extremely be-tween ∼ 20 and 700 µmol m−2d−1in nitrification (Bonaglia et al., 2014; Jäntti et al., 2011) and 1 and 487 µmol m−2d−1 in DNRA (Bonaglia et al., 2014, 2017; Jäntti and Hietanen, 2012; Jäntti et al., 2011). These rates cover the same range as denitrification rates and, together with the release of NO−3 and NH+4 from the sediment (Thoms et al., 2018), emphasise their significant role in retaining N in coastal ecosystems. 4.4 Revisiting coastal filter efficiency
The efficiency of the coastal N filter is often evaluated by es-timating the N removal efficiency (e.g. Asmala et al., 2017; Deek et al., 2013; Khalil et al., 2013), which is an extrapo-lation of the denitrification rates to a specific area, divided by the riverine TN load. To determine the N removal ef-ficiency of the Vistula and Öre estuaries, we extrapolated the denitrification rates (Table 4) to the respective estuarine sediment areas (ÖE: 21 km2; VE: 462 km2 permeable sed-iment; 363 km2non-permeable sediment, Fig. S3) and sam-pling months (31 d) and divided them by the riverine TN load of the same month (converted to mol month−1; Table 1). De-spite their significantly different denitrification rates, the two estuaries each removed only ∼ 5 % of the riverine TN loads in the respective summer months and even less in spring (0.2 %, Vistula Estuary only). These values are at the lower end of N removal efficiencies estimated for temperate estu-aries (3 %–26 %; Deek et al., 2013; Fear et al., 2005; Jäntti et al., 2011; Seitzinger and Nixon, 1985; Silvennoinen et al., 2007). Asmala et al. (2017) calculated that ∼ 16 % of the riverine TN load entering the Baltic coastal zone is re-moved by denitrification and concluded that the Baltic coast is a less efficient N filter than the open Baltic Sea. The au-thors’ compilation of denitrification rates across different coastal types, however, lacks denitrification measurements from sandy, permeable sediments, which cover large areas of the southern Baltic coastal zone coinciding with the re-gion of highest riverine N loads (HELCOM, 2018). Thus, the question remains whether the removal efficiency could be underestimated, and additional denitrification measurements from sediments experiencing advective pore-water flow are needed for future estimations.
Based on our results, we emphasise the fact that the N re-moval efficiency alone is not a sufficient indicator of the N filter efficiency in coastal zones. The time delay of the river-ine N load in the surface and its removal in the sediment make the direct relation of N input to N removal only sen-sible for longer, i.e. annual and decadal, timescales (Edman et al., 2018). On shorter, i.e. seasonal, timescales the N filter efficiency would rather depend on the transport and residence time of N, which provide time for N storage in POM and for retention processes to recycle N several times until it eventu-ally enters the removal pathway. Hence, to better quantify the coastal N filter efficiency, an additional measure of a N
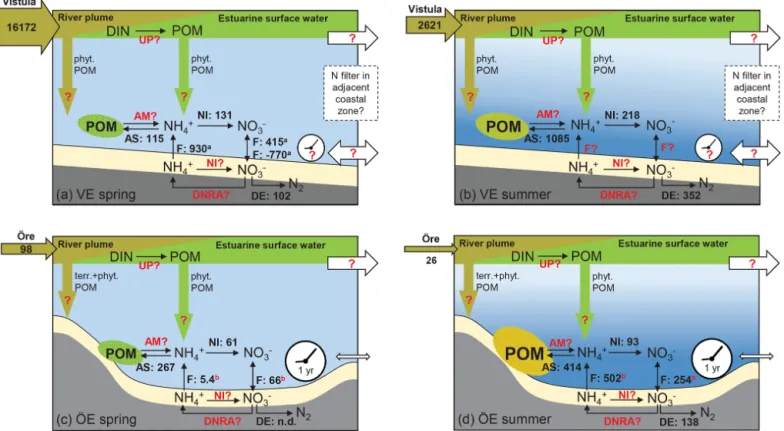
recy-Figure 7. Schematic of the N filter and its driving factors in the Vistula Estuary (a, b) and Öre Estuary (c, d) in spring and summer. The riverine total N loads are given in tonnes per month in the horizontal brown arrows. The process rates of nitrification (NI), ammonium assimilation (AS), and denitrification (DE), determined in this study, are given in micromoles per square metre per day (volumetric nitrifica-tion and ammonium assimilanitrifica-tion rates were integrated over the vertical BBL extent to derive areal rates). Benthic POM is fresh but low in concentration in both estuaries in spring (green ellipse), while it is higher in concentration in summer and more degraded in the Öre Estuary (yellow ellipse). Fluxes of NH+4 and NO−3 (F ) in the Vistula Estuary are from Thoms et al. (2018; in situ incubations, a), and those in the Öre Estuary are from Nedwell et al. (1983; core incubations, not in situ, b). Other microbial N retention process rates such as N uptake in the surface (UP), benthic ammonification (AM), nitrification (NI), and dissimilatory reduction to ammonia (DNRA) in the sediment are still unknown (marked in red). Fluxes from the Öre Estuary are also marked red, since these fluxes were not measured under in situ conditions; newly measured in situ fluxes are needed for a better evaluation. Also, sedimentation rates of terrestrial and phytoplankton-derived POM from the river (brown arrow) or from the estuarine surface water (green arrow) as well as transport rates (white arrows) and the particle (VE) and nutrient (VE, ÖE) residence time (white clock) are unknown for these two estuaries (red question mark). The conceptual idea of the N filter in the two estuaries is that riverine DIN is supplied to the benthic system indirectly, via POM build-up and sedimentation, which uncouples the peak river N load in spring from enhanced N turnover in the benthic system in summer. In the Öre Estuary, the limited bottom water exchange and hence the long particle residence time results in a high efficiency of the estuarine N filter (see Sect. 4.3). In the Vistula Estuary, the unrestricted bottom topography may lead to transport of DIN and POM with the prevailing alongshore currents and thus to a potential extension of the coastal filter function over a larger area and a longer timescale (see Sect. 4.3). Please note that this figure is not intended to present a closed N budget for these coastal zones.
cling efficiency is needed that not only considers the role and magnitude of microbial N retention processes but also quan-tifies transport and residence times of nutrients and POM, as all of these factors may facilitate N preservation in the coastal system.
5 Conclusions
Contrary to our expectations, the different trophic states of the Vistula and Öre estuaries only influence the denitrifica-tion rates in the sediment but not the rates of ammonium
as-similation and nitrification in the BBL. In both estuaries, all three processes depend on the availability of easily degrad-able, phytoplankton-derived POM as a substrate source. In stratified estuaries such as those of the Vistula and Öre rivers, POM build-up through primary production and subsequent sedimentation marks it as the essential link between riverine DIN loads and the spatially and temporally separated ben-thic microbial N processing. In addition, POM can function as a temporary N reservoir through long particle residence times (Öre Estuary) or alongshore transport (Vistula Estu-ary), which are both governed by the geomorphological and hydrological features of coastal zones. Consequently, the