HAL Id: hal-02311299
https://hal.archives-ouvertes.fr/hal-02311299
Submitted on 10 Oct 2019
HAL is a multi-disciplinary open access
archive for the deposit and dissemination of
sci-entific research documents, whether they are
pub-lished or not. The documents may come from
teaching and research institutions in France or
abroad, or from public or private research centers.
L’archive ouverte pluridisciplinaire HAL, est
destinée au dépôt et à la diffusion de documents
scientifiques de niveau recherche, publiés ou non,
émanant des établissements d’enseignement et de
recherche français ou étrangers, des laboratoires
publics ou privés.
Local or Not Local: Investigating the Nature of Striatal
Theta Oscillations in Behaving Rats
Laetitia Lalla, Pavel Rueda Orozco, Maria-Teresa Jurado-Parras, Andrea
Brovelli, David Robbe
To cite this version:
Laetitia Lalla, Pavel Rueda Orozco, Maria-Teresa Jurado-Parras, Andrea Brovelli, David Robbe. Local
or Not Local: Investigating the Nature of Striatal Theta Oscillations in Behaving Rats. eNeuro, Society
for Neuroscience, 2017, 4 (5), ENEURO.0128-17.2017 / p 128-145. �10.1523/ENEURO.0128-17.2017�.
�hal-02311299�
Integrative Systems
Local or Not Local: Investigating the Nature of
Striatal Theta Oscillations in Behaving Rats
Laetitia Lalla,1,2,3 Pavel E. Rueda Orozco,1,2,3 Maria-Teresa Jurado-Parras,1,2,3 Andrea Brovelli,4,ⴱ and David Robbe1,2,3,ⴱ
DOI:http://dx.doi.org/10.1523/ENEURO.0128-17.2017
1Institut National de la Santé et de la Recherche Médicale, Unité 901, Marseille 13009, France and ,2Aix-Marseille
Université, Unité Mixte de Recherche S901, Marseille 13009, France,3Institut de Neurobiologie de la Méditerranée,
Marseille 13009, France, and4Institut de Neurosciences de la Timone, Unité Mixte de Recherche 7289, Aix-Marseille
Université, Centre National de la Recherche Scientifique, Marseille 13385, France
Visual Abstract
In the cortex and hippocampus, neuronal oscillations of different frequencies can be observed in local field potentials (LFPs). LFPs oscillations in the theta band (6 –10 Hz) have also been observed in the dorsolateral striatum (DLS) of rodents, mostly during locomotion, and have been proposed to mediate behaviorally-relevant interactions between striatum and cortex (or between striatum and hippocampus). However, it is unclear if these theta oscillations are generated in the striatum. To address this issue, we recorded LFPs and spiking activity in the DLS of rats performing a running sequence on a motorized treadmill. We observed an increase in rhythmical activity of the LFP in the theta-band during run compared to rest periods. However, several observations suggest that these oscillations are mainly generated outside of the striatum. First, theta oscillations disappeared when
Significance Statement
In the cortex and hippocampus, neuronal network oscillations can be observed in the local field potentials (LFPs) and contribute to information transfer between brain regions. LFP oscillations can also be recorded in the striatum, even if, unlike the cortex and hippocampus, this brain region’s anatomic organization does not favor the generation of dipolar sources. It is therefore unclear if these striatal oscillations are locally generated or reflect volume-conducted signals generated distally from the striatum. Here, we provide evidence that striatal theta oscillations of the LFPs recorded while rats performed a running sequence are largely contaminated by volume-conducted signals. We propose that theta LFP oscillations in the striatum do not accurately reflect local cellular activity and should be interpreted with caution.
LFPs were rereferenced against a striatal recording electrode and the imaginary coherence between LFPs recorded at different locations within the striatum was null. Second, 8% of the recorded neurons had their spiking activity phase-locked to the theta rhythm. Third, Granger causality analyses between LFPs simultaneously recorded in the cortex and the striatum revealed that the interdependence between these two signals in the theta range was mostly accounted for by a common external source. The most parsimonious interpretation of these results is that theta oscillations observed in striatal LFPs are largely contaminated by volume-conducted signals. We propose that striatal LFPs are not optimal proxies of network dynamics in the striatum and should be interpreted with caution.
Key words: coherence; Granger; LFP; rat; striatum; theta oscillation
Introduction
The striatum is remarkable in that it receives massive anatomic projections from the entire neocortex, but also from subcortical regions, such as the thalamus, hip-pocampus, and amygdala (Gerfen, 2004;Hintiryan et al., 2016;Hunnicutt et al., 2016). Moreover, the striatum pro-cesses behaviorally-relevant information from the so-matosensory (Cho and West, 1997;Reig and Silberberg, 2014;Sippy et al., 2015;Kulik et al., 2017), motor (Koralek et al., 2012,2013), and auditory cortices (Znamenskiy and Zador, 2013) and also from the hippocampus (van der Meer and Redish, 2011). Oscillations of the local field potentials (LFPs), which reflect mainly the coordinated synaptic activity of ensemble of neurons (Buzsáki et al., 2012), have been proposed as a mechanism supporting network-level computation (Buzsáki and Draguhn, 2004) and communication between brain areas (Fries, 2005; Bonnefond et al., 2017). In freely-moving rodents, LFPs recorded in the dorsal striatum display strong oscillatory power in the theta band (around 8 Hz) during behavioral tasks (Berke et al., 2004; Costa et al., 2006; DeCoteau et al., 2007a, b; Tort et al., 2008; Berke, 2009; Kimchi et al., 2009;Lemaire et al., 2012; Leventhal et al., 2012; Sturman and Moghaddam, 2012; Delcasso et al., 2014; Nakhnikian et al., 2014; Thorn and Graybiel, 2014; von Nicolai et al., 2014; Belic´ et al., 2016) and have been
proposed as potential neural substrate for network-level computations relevant for locomotion and spatial naviga-tion (DeCoteau et al., 2007a, b; Tort et al., 2008; von Nicolai et al., 2014).
Surprisingly, the neurophysiological mechanisms gen-erating striatal theta oscillations are largely unknown. The striatum is composed at 95% by GABAergic medium spiny neurons, which are characterized by a spherical somatoden-dritic arborization and nonlayered cytoarchitectural organi-zation (Gerfen, 2004). Thus, synaptic activity in the striatum is likely to generate closed-field configurations with small net contributions to the LFP (Johnston and Miao-Sin Wu, 1995;Berke, 2005;Boraud et al., 2005;Walters and Berg-strom, 2010; Einevoll et al., 2013). Moreover, due to the lack of recurrent excitatory input and the importance of local inhibition (Gerfen, 2004), the striatum has been pro-posed to be “not autonomously rhythmogenic” (Bracci, 2009). It is therefore unclear whether striatal theta LFP oscillations reflect the summation of local synaptic activ-ities or volume-conduction effects from distant brain re-gions, such as the hippocampus (Buzsáki, 2002; Sirota et al., 2008).
To address this issue, we recorded spiking activity and LFPs in the dorsolateral striatum (DLS) of rats during the execution of a stereotyped running sequence. Subse-quently, to disentangle potential inter-areal interactions from volume conduction effects, we performed functional connectivity analyses on LFP oscillations simultaneously recorded in the DLS and the forelimb primary somatosen-sory cortex (S1).
Materials and Methods
All experimental procedures were conducted in accordance with standard ethical guidelines (European Communities Direc-tive 86/60 - EEC) and were approved by the relevant national ethics committee (Ministère de l’enseignement supérieur et de la recherche, France, Ref 00172.01).
Animals
Long-Evans rats (n⫽ 5, adult, males, 250–400 g) were housed in pairs (individually after surgery) in stable con-dition of temperature (22°C) and humidity (60%) with a constant light/dark cycle (12/12 h, all experimental proce-dures were performed during the light phase) and free access to food and water.
Behavioral task
We used a DLS-dependent task for rats that favors the generation of a motor sequence with fine-tuned kinematic parameters (Rueda-Orozco and Robbe, 2015). In this
Received April 12, 2017; accepted August 15, 2017; First published September 1, 2017.
The authors declare no competing financial interests.
Author contributions: L.L., A.B., and D.R. designed research; L.L., P.R.-O., and M.T.J.P. performed research; L.L. analyzed data; L.L., A.B., and D.R. wrote the paper.
This work was supported by the European Research Council (ERC-2013-CoG – 615699_NeuroKinematics; to D.R.), the Mexican Consejo Nacional de Ciencia y Tecnología (P.R.-O.), and a PhD fellowship from the French Ministère de l’Enseignement Superieur et de la Recherche (L.L.).
*A.B. and D.R. shared last co-authorship.
P. Rueda-Orozco’s present address: Instituto de Neurobiología, Universidad Nacional Autónoma de México, 76230 Querétaro, México.
Acknowledgments: We thank members of the Robbe lab and INMED for stimulant discussions during the development of the project.
Correspondence should be addressed to either of the following: David Robbe, INMED/INSERM U901, Parc scientifique de Luminy, 163 route de Luminy, BP 13, 13273, Marseille cedex 09.E-mail: david.robbe@inserm.fr; or Andrea Brovelli, Institut de Neurosciences de la Timone, UMR 7289 CNRS, Aix Marseille University, Campus de Santé Timone, 27 Bd Jean Moulin, 13385 Marseille Cedex 05, France.E-mail: andrea.brovelli@univ-amu.fr.
DOI:http://dx.doi.org/10.1523/ENEURO.0128-17.2017
Copyright © 2017 Lalla et al.
This is an open-access article distributed under the terms of theCreative Commons Attribution 4.0 International license, which permits unrestricted use, distribution and reproduction in any medium provided that the original work is properly attributed.
task, rats are trained to run on a customized treadmill to obtain rewards according to a spatiotemporal rule. Once the treadmill was turned on, animals could stop it and receive a drop of sucrose solution by entering a “stop area” located at the front of the treadmill. In addition to this spatial rule, a temporal constraint was added: stop-ping of the treadmill was only effective if animals waited at least 7 s (goal time) before entering the stop area. If animals entered the stop area before the goal time, an error sound was played, and they were forced to run for 20 s. Initially, rats accelerated forward as soon as the treadmill was turned on and entered the stop area before the goal time, resulting in a majority of incorrect trials. After extensive training, rats executed a stereotyped se-quence that could be divided in three overlapping phases: passive displacement from the front to the rear portion of the treadmill, stable running, and acceleration across the treadmill to enter the stop area. All rats were extensively trained to the task. The behavioral apparatus was con-trolled with custom-made LabView programs (National Instruments, RRID:SCR_014325).
Surgery
Recording electrodes were chronically implanted under deep isoflurane anesthesia. For three rats (rats 001, 019, and 020), we used home-made tetrodes (nichrome wires, 12.5 m in diameter, California Fine Wire, loaded on Neuralynx microdrives) targeting the right DLS (cranio-tomy centered at the following coordinates relative to bregma ⫹0.6 mm AnteroPosterior (AP) and ⫹0.35 mm MedioLateral (ML) and the depth⫺3.0 to ⫺4.0 mm with respect to the surface of the brain). Tetrodes tips were gold plated to reduce their impedance to 100 –200 k⍀ at 1 kHz. For two rats (rats 027 and 032), we implanted two Buzsaki32 silicon probes loaded on Neuronexus micro-drives targeting the DLS (AP⫽ ⫹1.2 mm, ML ⫽ ⫹3.6 mm relative to bregma; depth ⫽ ⫺3.0 mm relative to the surface of the brain) and the forelimb region of S1 (AP⫽ ⫺0.2 mm, ML ⫽ ⫹3.8 mm relative to bregma, depth ⫽ ⫺1.0 mm relative to brain surface, in order to target the layers Va). For all rats, a copper mesh protected the microdrive(s) and served as a local Faraday cage. Two miniature screws implanted above the cerebellum served as ground and reference. We confirmed the position of the electrodes with cresyl-violet staining after electrolytic le-sions.
Behavioral and neural data acquisition
Rats 001, 019, and 020 completed at least 65 sessions before the start of electrophysiological recordings. Rats 027 and 032 underwent surgery when naïve, and we considered for this study only data after the 45thsession. Neurophysiological signals were amplified 1000 times via a Plexon VLSI headstage and a PBX2 amplifier and acquired at 20 kHz on two synchronized National Instruments A/D cards (PCI 6254, 16-bit resolution). To determine the posi-tion of the animals, we used a CCD camera (scA640-70fc, Baser, 60 frames s⫺1, 9 pixels cm⫺1) positioned laterally to the treadmill and extracted the rat body’s position with a custom-made program (LabView Vision, National Instru-ments, RRID:SCR_014325). Signal from the treadmill’s
mo-tor was recorded to identify precisely the beginning and the end of the trials. We only included in our analysis correct trials (longer than 7 s) during which animals perform the stereotypical “front-rear-front” running sequence. We worked on the follow-ing dataset for the analysis of LFPs:
Preprocessing
Data analysis was performed using custom-made Matlab programs (RRID:SCR_001622) and the FieldTrip toolbox (http://www.fieldtriptoolbox.org/, RRID:SCR_004849). First, the data were down-sampled to 1250 Hz. Faulty channels were discarded on visual inspection with NeuroScope (http:// neurosuite.sourceforge.net, RRID:SCR_002455). Artifact rejection was completed using FieldTrip visual re-jection function: for each epoch and channel, the LFP signal variance and z-value were computed over time and inspected to detect artifact. The remaining data were bandpass filtered from 0.1 to 250 Hz, and a notch filter was added to remove electrical noise artifacts (integer multiples of 50 Hz). We divided the continuous signal into two types of epochs. “Run” epochs included the last 5 s preceding the arrival of the rat in the stop area. During these 5 s, the rats were continuously running. The “base-line” epochs included 5 s of intertrial time before the start of the considered trial.
Spike-LFP entrainment
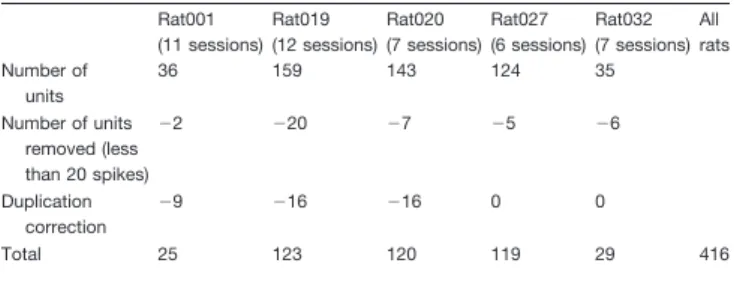
Spike sorting was performed semi-automatically using the clustering software KlustaKwik (http://klusta.readthedocs.io, RRID:SCR_014480) and the graphical spike sorting appli-cations Klusters (http://neurosuite.sourceforge.net, RRID: SCR_008020) or KlustaViewa (http://klusta.readthedocs.io). Spike-LFP coupling was examined by producing phase histograms using FieldTrip function ft_spiketriggered-spectrum. Units yielding⬍20 spikes in total (across all the considered epochs) were excluded from the analysis. All units were visually inspected and, if several clusters cor-responded to the same cell, supernumerary clusters were removed. To calculate the significance of spike-LFP en-trainment, two metrics were computed: the Rayleigh p value (testing the nonuniformity of the circular distribution) and the pairwise phase consistency (PPC) values (Vinck et al., 2010). We found good accordance between these two methods in most cases, although on some instances (for low-frequency modulated cells; see Results) the Ray-leigh p value was not specific enough of the frequency of entrainment. Hence, we considered cells as being specif-ically entrained to the theta rhythm if they also presented a maximum PPC at 8 Hz. To quantify the strength of the entrainment and the preferred phase for each unit, we hy-pothesized that the spike-phase distribution followed a von
Rat001 Rat019 Rat020 Rat027 Rat032 Number of sessions 11 12 11 13 14 Average number of trials per session ⫾ SD 24⫾ 6 29 ⫾ 7 33 ⫾ 10 64 ⫾ 22 55 ⫾ 22
Mises distribution and we computed the concentration fac-tor kappa and the preferred phase (Benchenane et al.,
2010) using the Matlab Circular Statistics Toolbox (Berens, 2009). We worked on the following data set for the analysis of spike-LFP entrainment:
LFP spectral analysis
Power spectra were computed from 5-s epochs using a multitaper method based on discrete prolate spheroidal slepian sequences (Mitra and Pesaran, 1999) using the FieldTrip toolbox. For the time-frequency representation inFigure 1, spectral density was estimated for f⫽ 2–20 Hz (in steps of 0.5 Hz) with nine orthogonal tapers and a spectral smoothing of 0.2ⴱ f (parameters were chosen for Rat001 (11 sessions) Rat019 (12 sessions) Rat020 (7 sessions) Rat027 (6 sessions) Rat032 (7 sessions) All rats Number of units 36 159 143 124 35 Number of units removed (less than 20 spikes) ⫺2 ⫺20 ⫺7 ⫺5 ⫺6 Duplication correction ⫺9 ⫺16 ⫺16 0 0 Total 25 123 120 119 29 416
A
B
C
D
E
F
Figure 1. LFP oscillations recorded in the DLS are modulated by the execution of a stereotyped motor sequence. A, Illustration of the
front-rear-front running sequence performed by rats on a motorized treadmill (left) and the trajectory of an animal during a single trial (right). B, Run and baseline are 5-s-long epochs chosen during trials and intertrials, respectively. C, Schematic representation of electrodes position. D, Raw LFP traces recorded with a four-shank silicon probe (a single channel per shank is shown). E, Time-frequency power spectrogram during consecutive trials and intertrials. F, Striatal LFP power spectra during run and baseline epochs (mean⫾ SD, average over electrodes and sessions). Power was normalized by 1/frequency2. Shaded red area indicates the
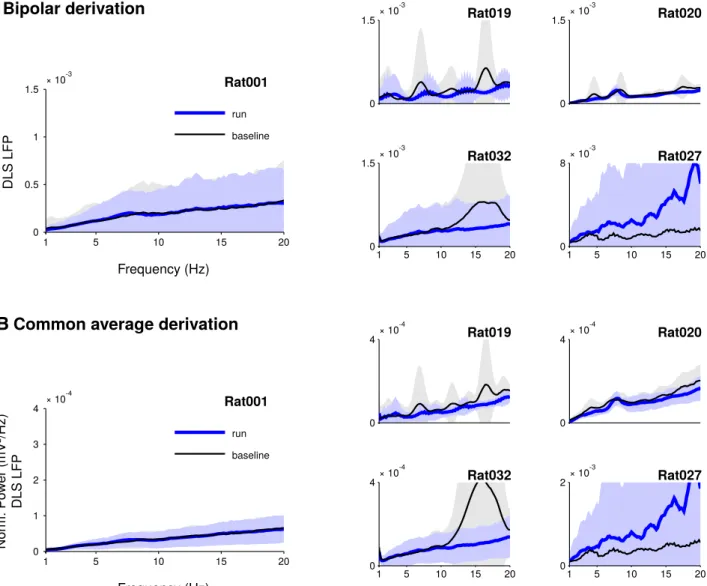
graphical visibility). The logarithm was taken to present data in decibel. For the power spectra inFigure 2, spectral density was estimated for f⫽ 1–20 Hz (in steps of 0.2 Hz) with seven orthogonal tapers and a spectral smoothing of 0.8ⴱ f (parameters were chosen to characterize at best the 8 Hz frequency). Power estimates were computed across all trials within a recording session. For better visualization, the power at each frequency was multiplied by the frequency squared (“whitening”). To assess whether theta oscillations were locally generated, a bipo-lar derivation of the signals was performed using as ref-erence the average LFP signal from another shank on the same silicon probe (⬃200m away) or another tetrode on the same construct (⬃350m away), instead of the ani-mal external ground. This procedure relies on the as-sumption that volume conducted signal is equally present on all the channels and hence will be subtracted (Bastos and Schoffelen, 2016). A common average reference
der-ivation was also performed by removing the average sig-nal computed across all shanks or tetrodes.
LFP coherence analysis
Spectral coherency was computed between striatal and cortical LFPs for frequencies f⫽ 1–20 Hz (in steps of 0.2 Hz) with seven orthogonal tapers and a spectral smooth-ing of 0.8ⴱ f (same parameters than for power estimation). Coherency is the cross-spectrum of striatal and cortical LFPs normalized by the square root of their respective power and is complex-valued. The modulus of coherency is the coherence, it is real valued between 0 and 1, and it measures consistency in phase difference between neural signals. If two signals are contaminated by a third (unique) common source, this would lead to coherence values at zero phase-lag, due to instantaneous field-spread. Thus, to eliminate potential confounds due to volume conduc-tion, we also computed the imaginary part of the
coher-A
B
Figure 2. The prominent peak at theta frequency disappears from power spectra after LFPs rereferencing. A, Striatal LFP power
spectra during run and baseline using a neighboring shank or tetrode as reference (mean ⫾ SD, average over electrodes and sessions). B, Striatal LFP power spectra during run and baseline using the common average reference derivation (mean⫾ SD, average over electrodes and sessions). For A, B, the power was normalized by 1/frequency2. The power in the theta-band is not
ency, called imaginary coherence, which measures the degree of synchronization at non-zero time-lags (Nolte et al., 2004; Bastos and Schoffelen, 2016). Since the imaginary coherence is the projection of the complex coherency on the imaginary axis, values may be positive or negative. The coherence angle is the argument of the complex coherency. It reflects the phase-lag between two signals. A synchronization at zero phase-lag, resulting from passive field spread, will yield a coherence angle equal to zero and a null imaginary coherence.
LFP Granger causality
To study the coupling between striatal and cortical signals, we used Granger causality analysis. Granger cau-sality is a directed functional connectivity measure and reflects the degree of statistical predictability of one time series on another (Granger, 1980; Brovelli et al., 2004; Ding et al., 2006; Bressler and Seth, 2011; Seth et al., 2015). We used a nonparametric version of Granger cau-sality, which allows the estimation from Fourier and wave-let transforms of time series data (Dhamala et al., 2008a, b). In addition, we exploited the notion that measures of Granger causality appear as a decomposition of total interdependence between two time series. In the time domain and for finite time series, this decomposition is expressed as follows:
Fx,y(t) ⫽ Fx¡y(t)⫹ Fy¡x(t)⫹ Fx.y(t)
and represents the total interdependence between X(t) and Y(t) (Geweke, 1982; Chicharro and Ledberg, 2012). Fx,yquantifies the dynamic increase of the total interde-pendence between two time series at a given point in time, in contrast to the static interdependence quantified by linear correlation. Such total interdependence is the sum of three Granger causality measures: two directed measures Fx¡y and Fy¡x plus the “instantaneous” Granger causality term Fx.y, accounting for unconsidered common influences to the processes. The same formula-tion is valid in the frequency domain (Ding et al., 2006) at frequency,
fx,y() ⫽ fx¡y() ⫹ fy¡x() ⫹ fx.y()
Spectral Granger causality measures were computed between DLS and S1 LFPs, using FieldTrip function ft_connectivityanalysis, for frequencies f⫽ 1–20 Hz (in steps of 0.2 Hz) with seven orthogonal tapers and a spectral smoothing of 0.8ⴱ f (same parameters than for coherence estimation). The computation was done across all trials in one session, then averaged across sessions.
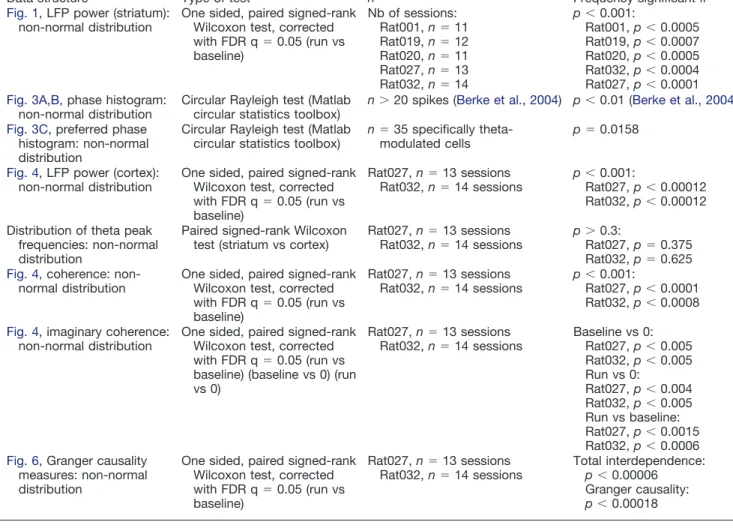
Table 1. Statistical table
Data structure Type of test n Frequency significant if a Fig. 1, LFP power (striatum):
non-normal distribution
One sided, paired signed-rank Wilcoxon test, corrected with FDR q⫽ 0.05 (run vs baseline) Nb of sessions: Rat001, n⫽ 11 Rat019, n⫽ 12 Rat020, n⫽ 11 Rat027, n⫽ 13 Rat032, n⫽ 14 p⬍ 0.001: Rat001, p⬍ 0.0005 Rat019, p⬍ 0.0007 Rat020, p⬍ 0.0005 Rat032, p⬍ 0.0004 Rat027, p⬍ 0.0001 b Fig. 3A,B,phase histogram:
non-normal distribution
Circular Rayleigh test (Matlab circular statistics toolbox)
n⬎ 20 spikes (Berke et al., 2004) p⬍ 0.01 (Berke et al., 2004) c Fig. 3C, preferred phase
histogram: non-normal distribution
Circular Rayleigh test (Matlab circular statistics toolbox)
n⫽ 35 specifically
theta-modulated cells
p⫽ 0.0158
d Fig. 4, LFP power (cortex): non-normal distribution
One sided, paired signed-rank Wilcoxon test, corrected with FDR q⫽ 0.05 (run vs baseline) Rat027, n⫽ 13 sessions Rat032, n⫽ 14 sessions p⬍ 0.001: Rat027, p⬍ 0.00012 Rat032, p⬍ 0.00012 e Distribution of theta peak
frequencies: non-normal distribution
Paired signed-rank Wilcoxon test (striatum vs cortex)
Rat027, n⫽ 13 sessions Rat032, n⫽ 14 sessions
p⬎ 0.3:
Rat027, p⫽ 0.375 Rat032, p⫽ 0.625 f Fig. 4, coherence:
non-normal distribution
One sided, paired signed-rank Wilcoxon test, corrected with FDR q⫽ 0.05 (run vs baseline) Rat027, n⫽ 13 sessions Rat032, n⫽ 14 sessions p⬍ 0.001: Rat027, p⬍ 0.0001 Rat032, p⬍ 0.0008 g Fig. 4, imaginary coherence:
non-normal distribution
One sided, paired signed-rank Wilcoxon test, corrected with FDR q⫽ 0.05 (run vs baseline) (baseline vs 0) (run vs 0) Rat027, n⫽ 13 sessions Rat032, n⫽ 14 sessions Baseline vs 0: Rat027, p⬍ 0.005 Rat032, p⬍ 0.005 Run vs 0: Rat027, p⬍ 0.004 Rat032, p⬍ 0.005 Run vs baseline: Rat027, p⬍ 0.0015 Rat032, p⬍ 0.0006 h Fig. 6, Granger causality
measures: non-normal distribution
One sided, paired signed-rank Wilcoxon test, corrected with FDR q⫽ 0.05 (run vs baseline) Rat027, n⫽ 13 sessions Rat032, n⫽ 14 sessions Total interdependence: p⬍ 0.00006 Granger causality: p⬍ 0.00018
Statistical analysis
Since power, coherence and Granger causality values are not normally distributed, we used a nonparametric test to assess if our data were significantly different be-tween run and baseline epochs. We used a one-sided paired Wilcoxon test, corrected for the number of fre-quencies tested using a false discovery rate (FDR) ap-proach (Genovese et al., 2002;Table 1).
Results
Animals were trained to perform a stereotyped running sequence on a motorized treadmill. The sequence was composed of three phases: passive displacement from the front to the rear portion of the treadmill, stable running around the rear portion of the treadmill and acceleration across the treadmill to enter a reward area (Fig. 1A). Recording sessions consisted of several trials interleaved with intertrial periods during which the treadmill was turned off (Fig. 1B). Visual inspection of the recordings revealed that LFPs in the DLS (Fig. 1C) were very similar across electrodes and displayed theta oscillations during the running phase of the trials (Fig. 1D). This later obser-vation was confirmed by means of time-frequency analy-ses of the LFPs (Fig. 1E).
Theta oscillations centered around 8 Hz were present during the run phase of the task, and showed a marked decrease in power during the intertrial period (Fig. 1E). To characterize the robustness of this task-dependent mod-ulation, we systematically compared the oscillatory con-tent of the LFPs between run epochs and a baseline taken during the intertrial, when the treadmill was off and ani-mals were not running (Fig. 1B; see Materials and Meth-ods). For all rats, power spectra showed a prominent peak around 8 Hz, significantly larger during run epochs com-pared to baseline (Fig. 1F; pa ⬍ 0.001 in all rats). This result is congruent with previous reports on the presence of theta oscillations in striatal LFPs in freely-moving ro-dents (Berke et al., 2004;Costa et al., 2006;DeCoteau et al., 2007a, b; Tort et al., 2008; Berke, 2009; Kimchi et al., 2009;Lemaire et al., 2012; Leventhal et al., 2012; Sturman and Moghaddam, 2012; Delcasso et al., 2014; Nakhnikian et al., 2014; Thorn and Graybiel, 2014; von Nicolai et al., 2014;Belic´ et al., 2016).
To assess whether striatal theta oscillations were locally generated rather than contaminated by volume-conducted fields generated outside the striatum, we con-ducted several analyses. First, we examined if theta oscillations were present after bipolar derivation between adjacent shanks (or tetrodes) or removal of common-average activity. Bipolar and common-common-average deriva-tions allow the removal of common signals that may be due to sources external to the neural volume spanned by the recording electrodes. The results showed that the theta peak disappeared from the power spectra both for bipolar (Fig. 2A) and common-average reference deriva-tions (Fig. 2B).
Second, to assess the local effect of striatal theta os-cillations on single-neuron activity, we investigated if stri-atal neurons were entrained by the theta oscillations, i.e., if spikes occurred more often at certain phases of the
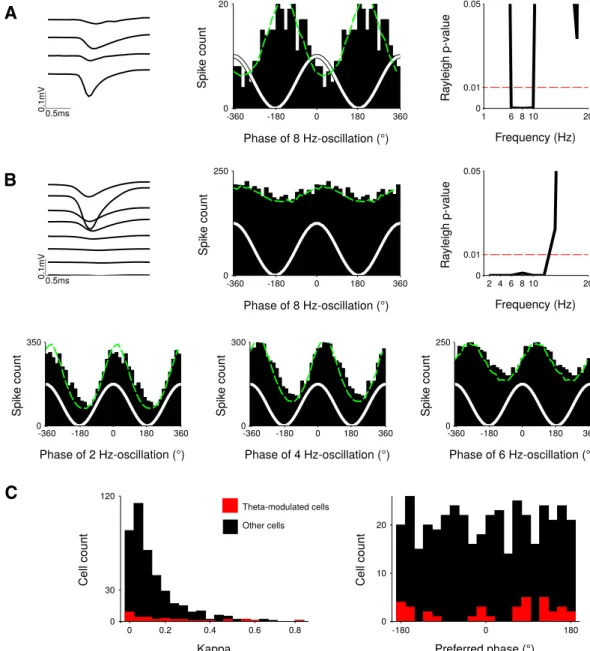
theta oscillation. We constructed spike-phase histograms and tested for nonuniformity of the phase distributions using the Raleigh test. We analyzed the activity of 416 well-isolated neurons. A total of 8% (35/416) of the neu-rons displayed specific phase modulation at the theta frequency (Rayleigh pb⬍ 0.01;Fig. 3A). Additionally, 14% (59/416) showed strong modulation by a slow component of the LFP with a concomitant weak entrainment at theta frequency (Fig. 3B). These neurons were not considered as being specifically theta entrained. The rest of the neu-rons did not display any significant modulation in the theta frequency range. To quantify theta phase modulation at the population level, we fitted, for each neuron, the dis-tribution of its spike phases with a von Mises disdis-tribution. We computed the concentration factor, which measures the strength of the modulation, and the preferred phase (Benchenane et al., 2010). Neurons that were theta-modulated displayed a wide range of values and the majority was weakly modulated ( ⱕ 0.2 for 22 out of 35 theta-modulated units; Fig. 3C, left). The histogram of phase preferences for theta-modulated neurons did not exhibit a clear phase preference (Fig. 3C, right) and a test for nonuniformity distribution did not reach the signifi-cance level classically used for this kind of analysis (cir-cular Rayleigh test, pc⬎ 0.01;Table 1). Altogether, these results show that theta oscillations of the LFP weakly entrained spiking activity in the DLS.
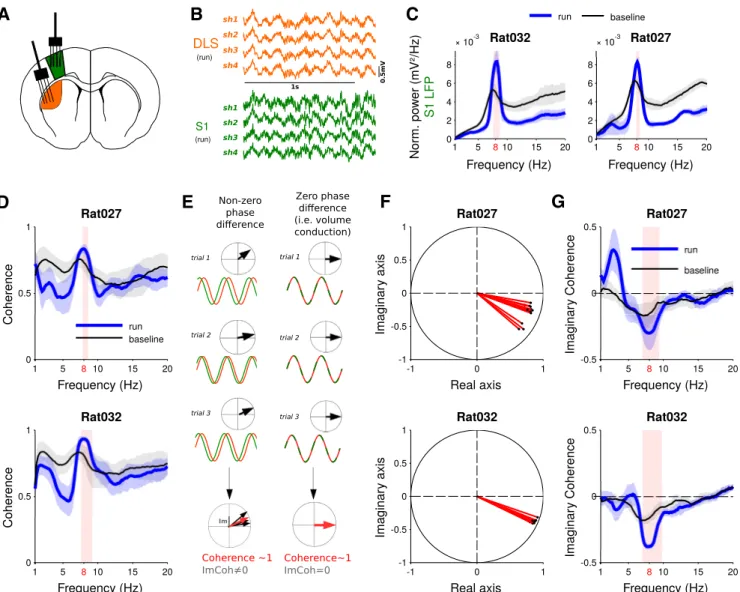
Then, we tried to disentangle local contributions from volume conduction effects through the analysis of LFPs simultaneously recorded from the DLS and the forelimb primary somatosensory cortex (S1, 27 sessions in Rats 027 and 032; see Materials and Methods;Fig. 4A). Power spectra of the cortical LFPs were very similar to those of striatal LFPs (Fig. 4B) and presented a prominent peak around 8 Hz, significantly greater during run than baseline (Fig. 4C, pd⬍ 0.001). For each session, the average peaks frequency in the theta range for striatal and for cortical LFPs were very similar (for Rat032: 7.80⫾ 0.18 and 7.83 ⫾ 0.19 Hz, respectively, and for Rat027: 7.80 ⫾ 0.22 and 7.84⫾ 0.12 Hz, respectively), and the two distributions were not different (Wilcoxon signed-rank test, pe⬎ 0.3).
We then studied phase relations between theta oscilla-tions of LFPs recorded simultaneously either in the cortex and the striatum or within these two brain regions. We first investigated phase relations between theta oscillations recorded in S1 and DLS (see Materials and Methods). Phase coherence between striatal and cortical LFPs in theta frequency range for both rats was significantly higher during run than baseline (Fig. 4D, pf ⬍ 0.001). However, it is known that coherence values can be biased by passive field spread: if oscillations generated in a distant brain area are volume conducted to both DLS and S1, they will reach both electrodes simultaneously, yield-ing high coherence values with zero phase-lag (Fig. 4E). Thus, we computed the imaginary coherence (i.e., the coherence at non-zero phase-lag; see Materials and Methods; Fig. 4F) between striatal and cortical LFPs. In both animals, we found that the imaginary coherence was different from zero during both run (pg ⬍ 0.004) and baseline epochs (pg ⬍ 0.005), with a magnitude
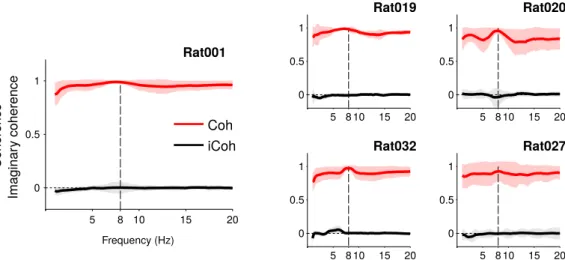
signifi-cantly stronger during run than baseline (Fig. 4G, pg ⬍ 0.0015 and pg⬍ 0.001). Second, we studied phase rela-tions between LFPs recorded within the striatum. The average coherence between LFPs recorded at different sites within the DLS was very high for all rats (Fig. 5, Rat001: 0.99⫾ 0.02; Rat019: 0.98 ⫾ 0.02; Rat020: 0.96 ⫾ 0.04; Rat 027: 0.96⫾ 0.04; Rat032: 0.97 ⫾ 0.04), but the imaginary coherence and coherence angle fell to zero values (imaginary coherence for Rat001: 0.00 ⫾ 0.05; Rat019: ⫺0.01 ⫾ 0.02; Rat020: ⫺0.04 ⫾ 0.13; Rat027: 0.00⫾ 0.02; Rat032: 0.00 ⫾ 0.01; and coherence angle for Rat001: 0.00⫾ 0.06; Rat019: ⫺0.01 ⫾ 0.02; Rat020:
⫺0.04 ⫾ 0.14; Rat027: 0.00 ⫾ 0.02; Rat032: 0.00 ⫾ 0.01), showing that LFPs recorded from different sites in the striatum are synchronized with zero-phase-lag. For Rat032, we also performed the same analysis on LFPs from different shanks of the silicon probe implanted in the cortex. Similarly, the average coherence between cortical LFPs was very high (0.98⫾ 0.01 for Rat032) and average imaginary coherence and coherence angle fell close to zero values (for Rat032: 0.02 ⫾ 0.02 and 0.02 ⫾ 0.02, respectively).
Finally, we performed Granger causality analysis to fur-ther assess cortico-striatal directional influences and
A
B
C
Figure 3. A minority of recorded striatal neurons is specifically entrained to theta oscillations. A, Example of neuron whose firing
pattern is specifically modulated by theta oscillations (6 –10 Hz): waveforms (left), 8 Hz-phase histogram (middle, ⫽ 0.48, ⫽ ⫺155°), and Rayleigh p value for each frequency between 1 and 20 Hz (right). B, Example of neuron entrained by low frequency oscillations (1–12 Hz). Top, same as A. Bottom, Additional phase histograms show a strong modulation at 2 Hz ( ⫽ 0.58, ⫽ 9.2°) and 4 Hz ( ⫽ 0.49, ⫽ 28°) but a weaker modulation at 6 Hz ( ⫽ 0.24, ⫽ 69°) and 8 Hz ( ⫽ 0.08, ⫽ 23°). C, Population histograms of kappa and preferred phase, for theta-modulated cells (red) and other cells (nonmodulated cells and non-theta-modulated cells, black).
common influence from an external component. Granger causality analysis allows to estimate the total interdepen-dence between two neural signals, defined as the sum of two directed measures of functional connectivity and an instantaneous measure representing the common influence of external factors on the two signals (see Materials and Methods). For both rats, the total interdependence exhibited a peak at 8 Hz during run epochs (Fig. 6A). Most (⬃90%) of this total interdependence was accounted for by the instan-taneous term (Fig. 6B). Directed causality measures contrib-ute to the total interdependence to a much smaller extent, (⬃10%;Fig. 6C,D). A significant increase in Granger causal-ity from the DLS to the cortex was observed during the run phase in one animal (Fig. 6D, ph⬍ 0.001).
Discussion
Here, we recorded LFPs in the DLS of rats engaged in a motor task requiring to perform a fine-tuned running sequence. We compared the oscillatory content of the LFPs during running and resting periods and found a prominent increased rhythmical activity in the theta fre-quency band (6 –10 Hz) during runs. Several observations nevertheless suggest that this theta rhythm is largely generated outside the striatum. First, the theta rhythm disappeared after rereferencing the LFPs to local neural activity and the imaginary coherence between LFPs re-corded at different locations in the DLS was null. Second, theta oscillations of the LFP weakly entrained spiking activity in the DLS. Third, when LFPs were recorded
A
B
C
D
E
F
G
Figure 4. Coherence and imaginary coherence analyses. A, Schematic drawing of the silicon probes position during simultaneous
recordings in forelimb S1 and DLS. B, Raw LFP traces recorded in DLS and S1 (a single channel per shank is shown). C, Cortical LFP power spectra during run and baseline, for two rats. D, Average coherence spectra during run and baseline, for two rats. E, Schematic illustration of the two scenarios yielding a value of coherence close to 1: a stable phase coupling with non-zero phase difference and volume conduction. The imaginary part of the coherency, however, is different. F, Complex coherency values at 8 Hz for all the sessions of the two rats during run (n⫽ 13 and 12 sessions). G, Averaged imaginary coherence during run and baseline. All graphs represent the average values across sessions⫾ SD. Shaded red area indicates the frequencies at which the power (C), the coherence (D) or the imaginary coherence (G) is significantly different in run compared to baseline.
simultaneously in the forelimb S1 and the striatum, Granger causality analysis revealed that the total interde-pendence between the two signals in the theta range was mostly accounted for by the instantaneous term, which reflects a potential common external source. Thus, striatal LFP oscillations in the theta frequency range appear to be largely volume-conducted signals and should not be in-terpreted as reflecting local network-level computation.
In the neocortex and hippocampus, LFPs reflect mainly the aggregate synaptic transmembrane currents
occur-ring around extracellular recordings electrodes (Buzsáki et al., 2012) and oscillations of the LFPs have been shown to carry functionally-relevant network-level computation (Buzsáki, 2002; Buzsáki and Draguhn, 2004). In dorsal regions of striatum, LFP recordings have revealed rhyth-mical activity in various frequency bands, associated with specific behavioral or neuromodulatory states ( Courte-manche et al., 2003;Masimore et al., 2005;Koralek et al., 2012, 2013). More specifically several studies have re-ported prominent rhythmical activity of the LFPs in the Figure 5. Coherence and imaginary coherence between different recording sites in the striatum, during run epochs, for all rats.
Average values and SDs across all sessions are shown.
A
B
C
D
Figure 6. The total interdependence between DLS and S1 LFPs is mainly accounted for by instantaneous causality. A, Total
interdependence DLS/S1 during run and baseline, for Rat027 (top) and Rat032 (bottom). B, Instantaneous causality during run and baseline, averaged across sessions, accounting for factors possibly exogenous to the (DLS, S1) system. C, Directed Granger causality S1 ¡ DLS during run and baseline. D, Same as C for the direction DLS ¡ S1. All graphs represent the average across sessions ⫾ SD. Shaded red area indicates the frequencies at which the granger causality measures are significantly different in run compared to baseline.
theta frequency range when rodents were engaged in locomotor activities (Berke et al., 2004;Costa et al., 2006; DeCoteau et al., 2007a,b;Tort et al., 2008;Berke, 2009; Thorn and Graybiel, 2014;von Nicolai et al., 2014), raising the possibility that theta oscillations reflect network level computation occurring in the striatum contributing to the processing of task-relevant information. Still, the spatial spread of electromagnetic fields may cause recording channels to pick up the activity of both local and distant neural sources. Indeed, results from literature reporting direct intracranial measurements indicate that LFPs can passively spread over several milimiters (Sirota et al., 2008) or even centimeters (Kajikawa and Schroeder, 2011) from their origins. This potential caveat may be exacerbated in a structure like the striatum whose anat-omy favors the generation of closed field potentials ( John-ston and Miao-Sin Wu, 1995;Gerfen, 2004;Walters and Bergstrom, 2010).
To the best of our knowledge, the strongest argument for a local source of theta oscillations in striatal LFPs is derived from a single study reporting that theta oscilla-tions are still visible when the LFPs have been rerefer-enced against an intrastriatal electrode (DeCoteau et al., 2007a). However, local referencing can yield false positive results, depending on the exact position of the recording and references electrodes in regard of the oscillation source (Sirota et al., 2008). Indeed, subtracting two oscil-latory signals with the same phase and frequency, but different amplitude (as it can happen due the passive attenuating effects of the brain tissue on LFPs) can result in an oscillatory signal with a preserved rhythmicity. Here, in agreement with previous report (Berke et al., 2004;Costa et al., 2006;DeCoteau et al., 2007a,2007b; Tort et al., 2008;Berke, 2009;Lemaire et al., 2012; Lev-enthal et al., 2012;Sturman and Moghaddam, 2012; Del-casso et al., 2014; Nakhnikian et al., 2014; Thorn and Graybiel, 2014;von Nicolai et al., 2014;Belic´ et al., 2016), we found robust rhythmical activity of the LFPs during the running phase of our task, when the signal was referenced against an electrode placed above the cerebellum (Fig. 1). However, in contrast to what was observed in the afore-mentioned landmark study (DeCoteau et al., 2007a), this theta rhythmic activity totally disappeared when we reref-erenced the signal against a striatal electrode or the com-mon average signal of all striatal electrodes (Fig. 2). Unfortunately, there is no straightforward explanation for the discrepancy between our results and those obtained byDeCoteau et al. (2007a). Both works used tasks that are based on locomotion (rats running on a T-Maze or on a treadmill) and that massively engaged spiking activity in the DLS (Barnes et al., 2005;Rueda-Orozco and Robbe, 2015). In addition, the distance between electrodes was similar in both studies (from 200 to 600m). In our study, the lack of theta oscillation after local derivation was additionally supported by the fact that coherence was very high between LFPs recorded at different locations of the striatum while imaginary coherence and coherence angle were null. Thus, the similarity between the LFPs recorded in the striatum is most likely due to passive volume conduction. It could be argued that our results
(imaginary coherence null between striatal recording sites and no theta oscillation in bipolar recording configuration) are compatible with theta oscillations being homoge-neously generated throughout the entire striatum. This possibility is not well supported by the fact that 8% of the recorded striatal neurons were weakly entrained by theta oscillation (Fig. 3; Berke et al., 2004; DeCoteau et al., 2007a) with inconsistent phase preferences. Moreover, it has been shown that medium spiny neurons do not ex-hibit an autonomous rhythmic firing pattern (Mahon et al., 2006) nor resonance in the theta frequency range (Beatty et al., 2015).
The volume-conduction hypothesis is further substan-tiated by experiments in which we recorded LFPs simul-taneously in the DLS and the forelimb somatosensory cortex. Like striatal LFPs, cortical LFPs displayed a prom-inent increase in rhythmical activity in the theta frequency band during runs. We performed Granger causality anal-yses that allows to dissect the interdependence between striatal and cortical LFPs into, on the one hand, directed measures of functional connectivity (that quantify interac-tions from striatum to cortex and vice versa) and, on the other hand, instantaneous causality values (that quantify the impact of common instantaneous influence on both striatal and cortical LFPs). Applied to our data, Granger analysis revealed that the total interdependence between theta oscillations of the LFPs recorded in the striatum and cortex is largely explained (at ⬃90%) by a common ex-ternal source driving both striatal and cortical theta oscil-lations of the LFPs. This raises the possibility that theta oscillations in the cortex were also contaminated by volume-conducted signals (Vinck et al., 2015a,b).
Altogether, our data strongly support the idea that theta oscillations observed in striatal LFPs are contaminated by volume-conducted signals. A good candidate for the ori-gin of these signals is the hippocampus, as this structure generates prominent theta oscillations during running (Whishaw and Vanderwolf, 1973), which are known to passively spread over long distances (Sirota et al., 2008). In addition, the hippocampus sends excitatory projections to the ventral striatum (Gerfen, 2004) raising the possibility that theta oscillations are generated in this region and spread passively to more dorsal parts of the striatum. However, if this was the case, one could expect LFP theta power being stronger in the dorsal striatum than in the sensory cortex, which is not what we observed. Still we cannot exclude that the theta oscillations visible in the dorsolateral striatal LFPs result from the summation of fields generated in several brain regions (i.e., not only in the hippocampus). Determining precisely the nonstriatal origin of theta oscillations recorded in the DLS would require complex multi-sites electrophysiolgical recordings in behaving animals that fell beyond the scope of the present study.
Imaginary coherence analyses between striatal and cortical LFPs, quantifying the degree of synchronization at non-zero phase-lag, revealed significant non-zero imagi-nary coherence in the theta frequency band during run and rest. Since volume conduction is instantaneous, if theta oscillations were generated by a third-party source
and passively spread to the striatum and cortex, one could have expected a null imaginary coherence between striatal and cortical theta. Thus, non-zero imaginary co-herence could be interpreted as sign of functional cou-pling between both regions at theta frequency (von Nicolai et al., 2014). However, a non-zero imaginary coherence (i.e., a non-zero phase difference) between striatal and cortical theta LFPs may also arise from volume-conduc-tion effects and phase-shifted theta generators located in adjacent brain regions. For instance, hippocampal theta oscillations are known to be generated by several sources that exhibit a phase shift (Sirota et al., 2008). This may, indeed, be responsible for the phase shift between striatal and cortical theta oscillations LFPs observed in our study. The fact that different hippocampal theta generators can be independently modulated during performance of a T-maze task (Montgomery et al., 2009) could also explain previously reported nonstationarites in the hippocampo-striatal coupling (DeCoteau et al., 2007b;Tort et al., 2008). Finally, non-null imaginary coherence in the theta band be-tween cortex and striatum could also arise without functional coupling between these brain regions if a third-party theta source (e.g., the hippocampus) would synaptically modulate neuronal activity in the cortex and striatum with different delays (due to different connectivity schemes). In any case, our caution in interpreting the non-null imaginary coherence between cortical and striatal LFPs at theta frequency is reinforced by the small values of the directed measures obtained using Granger analysis (Fig. 6C,D; Nakhnikian et al., 2014;Belic´ et al., 2016), compared to the high value of instantaneous causality.
The contamination of striatal LFPs by volume-con-ducted theta oscillations is not incompatible with a subset of DLS neurons (8% in our study) being modulated at theta frequency (Berke et al., 2004; DeCoteau et al., 2007a). When considering all theta-modulated neurons, the strength of the modulation was generally weak and the different neurons did not exhibit a clear phase prefer-ence. These results support the idea that theta oscilla-tions of the LFPs recorded in the striatum are largely volume conducted. The theta modulation of the firing rate could be due to either a direct influence from the medial entorhinal cortex, whose neurons exhibit theta-modulated spiking activity (Mizuseki et al., 2009) and project mas-sively to the DLS (Kerr et al., 2007), or indirect projections from the hippocampus.
Our work, while not discarding the fact that a subset of striatal neurons have their activity coordinated at theta frequency, provides strong evidence for a prominent contamination of the striatal LFPs by theta oscillations generated distally. While our study focused on theta os-cillations in the DLS, the interpretation concerns we raise is likely to apply to other frequency bands and subregions of the striatum. For instance, fast gamma oscillations of the LFPs recorded in the ventral striatum have been shown to be passively volume conducted from the piri-form cortex, rather than locally generated (Berke, 2009; Carmichael et al., 2017). Interestingly, the spiking activity of ventral striatal neurons, which do not participate in the generation of the currents responsible for gamma LFPs
oscillations was strongly gamma-modulated, most likely because the piriform cortex provides direct excitatory input to the ventral striatum. These results illustrate that, in a structure like the striatum, it is crucial to combine the study of spiking activity with complementary analysis methods to carefully assess the local origin of an LFP oscillation, even if it is strongly modulated at specific times of task performance. Finally, oscillations of the LFPs at theta frequency have also been recorded in midbrain regions, such as the ventral tegmental area (Harris Bozer et al., 2016) or the mesencephalic locomotor region (Noga et al., 2017). As in the striatum, the cytoarchitecture in these brain regions does not favor the generation of open fields and further investigation would be required to as-sess the locality of these oscillations. Altogether our work provides compelling support for recent publications that advised serious caution regarding the interpretation of LFPs (Buzsáki and Schomburg, 2015;Bastos and Schof-felen, 2016;Herreras, 2016).
References
Barnes TD, Kubota Y, Hu D, Jin DZ, Graybiel AM (2005) Activity of striatal neurons reflects dynamic encoding and recoding of pro-cedural memories. 437:1158 –1161.CrossRef
Bastos AM, Schoffelen J-M (2016) A tutorial review of functional connectivity analysis methods and their interpretational pitfalls. Front Syst Neurosci 9:175.CrossRef
Beatty JA, Song SC, Wilson CJ, Beatty JA, Song SC, Wilson CJ (2015) Cell-type-specific resonances shape the responses of stri-atal neurons to synaptic input. J Neurophysiol 688 –700.CrossRef
Belic´ JJ, Halje P, Richter U, Petersson P, Hellgren Kotaleski J (2016) Untangling cortico-striatal connectivity and cross-frequency cou-pling in L-DOPA-induced dyskinesia. Front Syst Neurosci 10:26.
CrossRef
Benchenane K, Peyrache A, Khamassi M, Tierney PL, Gioanni Y, Battaglia FP, Wiener SI (2010) Coherent theta oscillations and reorganization of spike timing in the hippocampal- prefrontal Net-work upon Learning. Neuron 66:921–936.
Berens P (2009) CircStat: a MATLAB toolbox for circular statistics. J Stat Softw 31.CrossRef
Berke JD (2005) Participation of striatal neurons in large-scale oscil-latory networks. Basal Ganglia VIII:25–36.
Berke JD (2009) Fast oscillations in cortical-striatal networks switch frequency following rewarding events and stimulant drugs. Eur J Neurosci 30:848 –859.CrossRef Medline
Berke JD, Okatan M, Skurski J, Eichenbaum HB (2004) Oscillatory entrainment of striatal neurons in freely moving rats. Neuron 43: 883–896.CrossRef Medline
Bonnefond M, Kastner S, Jensen O (2017) Communication between brain areas based on nested oscillations. eNeuro 4CrossRef
Boraud T, Brown P, Goldberg J (2005) Oscillations in the basal ganglia: the good, the bad, and the unexpected. Basal Ganglia VII:3–24.
Bracci E (2009) Making waves in the striatum (commentary on J. D. Berke). Eur J Neurosci 30:847.CrossRef Medline
Bressler SL, Seth AK (2011) Wiener-Granger causality: a well estab-lished methodology. Neuroimage 58:323–329.CrossRef Medline
Brovelli A, Ding M, Ledberg A, Chen Y, Nakamura R, Bressler SL (2004) Beta oscillations in a large-scale sensorimotor cortical net-work: directional influences revealed by Granger causality. Proc Natl Acad Sci USA 101:9849 –9854.CrossRef
Buzsáki G (2002) Theta oscillations in the hippocampus. Neuron 33:325–340.Medline
Buzsáki G, Anastassiou CA, Koch C (2012) The origin of extracellular fields and currents–EEG, ECoG, LFP and spikes. Nat Rev Neurosci 13:407–420.CrossRef Medline
Buzsáki G, Draguhn A (2004) Neuronal oscillations in cortical net-works. Science 304:1926 –1930.CrossRef Medline
Buzsáki G, Schomburg EW (2015) What does gamma coherence tell us about inter-regional neural communication? Nat Neurosci 18: 484 – 489.
Carmichael AJE, Gmaz JM, Meer MAA Van Der (2017) Gamma oscillations in the rat ventral striatum originate in the piriform cortex. J Neurosci 37:7962–7974.CrossRef
Chicharro D, Ledberg A (2012) Framework to study dynamic depen-dencies in networks of interacting processes. Phys Rev E Stat Nonlin Soft Matter Phys 86:041901.CrossRef
Cho J, West MO (1997) Distributions of single neurons related to body parts in the lateral striatum of the rat. Brain Res 756:241–246.
Medline
Costa RM, Lin SC, Sotnikova TD, Cyr M, Gainetdinov RR, Caron MG, Nicolelis MAL (2006) Rapid alterations in corticostriatal ensemble coordination during acute dopamine-dependent motor dysfunc-tion. Neuron 52:359 –369.CrossRef
Courtemanche R, Fujii N, Graybiel AM (2003) Synchronous, focally modulated beta-band oscillations characterize local field potential activity in the striatum of awake behaving monkeys. J Neurosci 23:11741–11752.
DeCoteau WE, Thorn C, Gibson DJ, Courtemanche R, Mitra P, Kubota Y, Graybiel AM (2007a) Oscillations of local field potentials in the rat dorsal striatum during spontaneous and instructed be-haviors. J Neurophysiol 97:3800 –3805.
DeCoteau WE, Thorn C, Gibson DJ, Courtemanche R, Mitra P, Kubota Y, Graybiel AM (2007b) Learning-related coordination of striatal and hippocampal theta rhythms during acquisition of a procedural maze task. Proc Natl Acad Sci USA 104:5644 –5649. Delcasso S, Huh N, Byeon JS, Lee J, Jung MW, Lee I (2014)
Functional relationships between the hippocampus and dorsome-dial striatum in learning a visual scene-based memory task in rats. J Neurosci 34:15534 –15547.CrossRef Medline
Dhamala M, Rangarajan G, Ding M (2008a) Estimating granger cau-sality from fourier and wavelet transforms of time series data. Phys Rev Lett 100:1–4.
Dhamala M, Rangarajan G, Ding M (2008b) Analyzing information flow in brain networks with nonparametric Granger causality. Neu-roimage 41:354 –362.
Ding M, Yonghong C, Bressler SL (2006) Granger causality: basic theory and application to neuroscience. In: Handbook of time series analysis (Schelter B, Winterhalder M, Timmer J, eds), pp 437–447. Weinheim: Wiley-VCH.
Einevoll GT, Kayser C, Logothetis NK, Panzeri S (2013) Modelling and analysis of local field potentials for studying the function of cortical circuits. Nat Rev Neurosci 14:770 –785.CrossRef Medline
Fries P (2005) A mechanism for cognitive dynamics: neuronal com-munication through neuronal coherence. Trends Cogn Sci 9:474 – 480.CrossRef Medline
Genovese CR, Lazar NA, Nichols T (2002) Thresholding of statistical maps in functional neuroimaging using the false discovery rate. Neuroimage 15:870 –878.CrossRef Medline
Gerfen CR (2004) Basal ganglia. In: The rat nervous system, Ed 3 (George P, ed), pp 466. San Diego: Elsevier.
Geweke J (1982) Measurement of linear dependence and feedback between multiple time series. J Am Stat Assoc 77:304 –313.
CrossRef
Granger CWJ (1980) Testing for causality. A personal viewpoint. J Econ Dyn Control 2:329 –352.CrossRef
Harris Bozer AL, Li AL, Sibi JE, Bobzean SAM, Peng YB, Perrotti LI (2016) Local field potentials in the ventral tegmental area during cocaine-induced locomotor activation: measurements in freely moving rats. Brain Res Bull 121:186 –191.CrossRef Medline
Herreras O (2016) Local field potentials: myths and misunderstand-ings. Front Neural Circuits 10:101.
Hintiryan H, Foster NN, Bowman I, Bay M, Song MY, Gou L, Ya-mashita S, Bienkowski MS, Zingg B, Zhu M, Yang XW, Shih JC, Toga AW, Dong H-W (2016) The mouse cortico-striatal projec-tome. Nat Neurosci 19:1100 –1114.CrossRef
Hunnicutt BJ, Jongbloets BC, Birdsong WT, Gertz KJ, Zhong H, Mao T (2016) A comprehensive excitatory input map of the striatum reveals novel functional organization. Elife 5:e19103.
Johnston D, Miao-Sin Wu S (1995) Extracellular field recordings. In: Foundations of cellular neurophysiology, pp 429. Cambridge: MIT Press.
Kajikawa Y, Schroeder CE (2011) How local is the local field poten-tial? Neuron 72:847–858.CrossRef Medline
Kerr KM, Agster KL, Furtak SC, Burwell RD (2007) Functional neu-roanatomy of the parahippocampal region: the lateral and medial entorhinal areas. Hippocampus 17:697–708.CrossRef Medline
Kimchi EY, Torregrossa MM, Taylor JR, Laubach M (2009) Neuronal correlates of instrumental learning in the dorsal striatum. J Neuro-physiol 102:475–489.CrossRef
Koralek A, Costa RM, Carmena J (2013) Temporally precise cell-specific coherence develops in corticostriatal networks during learning. Neuron 79:865–872.CrossRef Medline
Koralek AC, Jin X, Long II JD, Costa RM, Carmena JM (2012) Corticostriatal plasticity is necessary for learning intentional neu-roprosthetic skills. Nature 483:331–335.CrossRef
Kulik J, Pawlak A, Kalkat M, Coffey K, West MO (2017) Representa-tion of the body in the lateral striatum of the freely moving rat: fast spiking Interneurons respond to stimulation of individual body parts. Brain Res 1657:101–108.CrossRef Medline
Lemaire N, Hernandez LF, Hu D, Kubota Y, Howe MW, Graybiel AM (2012) Effects of dopamine depletion on LFP oscillations in striatum are task- and learning-dependent and selectively reversed by L-DOPA. Proc Natl Acad Sci USA 109:18126 –18131.CrossRef Medline
Leventhal DK, Gage GJ, Schmidt R, Pettibone JR, Case AC, Berke JD (2012) Basal ganglia beta oscillations accompany cue utiliza-tion. Neuron 73:523–536.CrossRef Medline
Mahon S, Vautrelle N, Pezard L, Slaght SJ, Deniau J-M, Chouvet G, Charpier S (2006) Distinct patterns of striatal medium spiny neuron activity during the natural sleep-wake cycle. J Neurosci 26:12587– 12595.CrossRef Medline
Masimore B, Schmitzer-Torbert NC, Kakalios J, Redish AD (2005) Transient striatal gamma local field potentials signal movement initiation in rats. Neuroreport 16:2021–2024.Medline
Mitra PP, Pesaran B (1999) Analysis of dynamic brain imaging data. Biophys J 76:691–708.Medline
Mizuseki K, Sirota A, Pastalkova E, Buzsáki G (2009) Theta oscillations provide temporal windows for local circuit computation in the entorhinal-hippocampal loop. Neuron 64:267–280.CrossRef Medline
Montgomery SM, Betancur MI, Buzsáki G (2009) Behavior-dependent coordination of multiple theta dipoles in the hippocam-pus. J Neurosci 29:1381–1394.CrossRef Medline
Nakhnikian A, Rebec GV, Grasse LM, Dwiel LL, Shimono M, Beggs JM (2014) Behavior modulates effective connectivity between cor-tex and striatum. PLoS One 9:e89443.CrossRef
Noga BR, Sanchez FJ, Villamil LM, O’Toole C, Kasicki S, Olszewski M, Cabaj AM, Majczy ⬘nski H, Sławi ⬘nska U, Jordan LM (2017) LFP oscillations in the mesencephalic locomotor region during volun-tary locomotion. Front Neural Circuits 11:34.CrossRef Medline
Nolte G, Bai O, Wheaton L, Mari Z, Vorbach S, Hallett M (2004) Identifying true brain interaction from EEG data using the imaginary part of coher-ency. Clin Neurophysiol 115:2292–2307.CrossRef Medline
Reig R, Silberberg G (2014) Multisensory integration in the mouse striatum. Neuron 83:1200 –1212.CrossRef Medline
Rueda-Orozco PE, Robbe D (2015) The striatum multiplexes conttual and and kinematic information to constrain motor habits ex-ecution. Nat Neurosci 18:453–460.CrossRef
Seth AK, Barrett AB, Barnett L (2015) Granger causality analysis in neuroscience and neuroimaging. J Neurosci 35:3293–3297.
CrossRef Medline
Sippy T, Lapray D, Crochet S, Petersen CCH (2015) Cell-type-specific sensorimotor processing in striatal projection neurons during goal-directed behavior. Neuron 88:298 –305.CrossRef
Sirota A, Montgomery S, Fujisawa S, Isomura Y, Zugaro M, Buzsáki G (2008) Entrainment of neocortical neurons and gamma oscillations by the hippocampal theta rhythm. Neuron 60:683–697.CrossRef Med-line
Sturman DA, Moghaddam B (2012) Striatum processes reward dif-ferently in adolescents versus adults. Proc Natl Acad Sci USA 109:1719 –1724.CrossRef Medline
Thorn CA, Graybiel AM (2014) Differential entrainment and learning-related dynamics of spike and local field potential activity in the sensorimotor and associative striatum. J Neurosci 34:2845–2859.
CrossRef Medline
Tort ABL, Kramer MA, Thorn C, Gibson DJ, Kubota Y, Graybiel AM, Kopell N (2008) Dynamic cross-frequency couplings of local field potential oscillations in rat striatum and hippocampus during per-formance of a T-maze task. Proc Natl Acad Sci USA 105:20517– 20522.CrossRef
van der Meer MAA, Redish AD (2011) Theta phase precession in rat ventral striatum links place and reward information. J Neurosci 31:2843–2854.CrossRef
Vinck M, Batista-Brito R, Knoblich U, Cardin JA (2015a) Arousal and locomotion make distinct contributions to cortical activity patterns and visual encoding. Neuron 86:740 –754.
Vinck M, Bos JJ, Van Mourik-Donga LA, Oplaat KT, Klein GA, Jackson JC, Gentet LJ, Pennartz CMA (2015b) Cell-type and state-dependent synchronization among rodent somatosensory, visual, perirhinal cortex, and hippocampus CA1. Front Syst Neu-rosci 9:187.
Vinck M, van Wingerden M, Womelsdorf T, Fries P, Pennartz CMA (2010) The pairwise phase consistency: a bias-free measure of rhythmic neuronal synchronization. Neuroimage 51:112–122.CrossRef
von Nicolai C, Engler G, Sharott A, Engel AK, Moll CK, Siegel M (2014) Corticostriatal coordination through coherent phase-amplitude coupling. J Neurosci 34:5938 –5948.CrossRef Medline
Walters JR, Bergstrom DA (2010) Synchronous activity in basal ganglia circuits. In: Handbook of basal ganglia structure and func-tion (Steiner H, Tseng KY, eds), pp 431. London: Academic Press/ Elsevier.
Whishaw IQ, Vanderwolf CH (1973) Hippocampal EEG and behavior: changes in amplitude and frequency of RSA (theta rhythm) asso-ciated with spontaneous and learned movement patterns in rats and cats. Behav Biol 8:461–484.Medline
Znamenskiy P, Zador AM (2013) Corticostriatal neurons in auditory cortex drive decisions during auditory discrimination. Nature 497: 482–485.CrossRef Medline