HAL Id: inserm-00472869
https://www.hal.inserm.fr/inserm-00472869
Submitted on 13 Apr 2010
HAL is a multi-disciplinary open access archive for the deposit and dissemination of sci-entific research documents, whether they are pub-lished or not. The documents may come from teaching and research institutions in France or abroad, or from public or private research centers.
L’archive ouverte pluridisciplinaire HAL, est destinée au dépôt et à la diffusion de documents scientifiques de niveau recherche, publiés ou non, émanant des établissements d’enseignement et de recherche français ou étrangers, des laboratoires publics ou privés.
Influence of assignment on the prediction of
transmembrane helices in protein structures.
Jean Pylouster, Aurélie Bornot, Catherine Etchebest, Alexandre de Brevern
To cite this version:
Jean Pylouster, Aurélie Bornot, Catherine Etchebest, Alexandre de Brevern. Influence of assignment on the prediction of transmembrane helices in protein structures.. Amino Acids, Springer Verlag, 2010, 39 (5), pp.1241-54. �10.1007/s00726-010-0559-6�. �inserm-00472869�
Amino acids 2010 (in press)
Influence of assignment on the prediction of
transmembrane helices in protein structures
Jean Pylouster 1,2, Aurélie Bornot 1,3, Catherine Etchebest 1,3 & Alexandre G. de Brevern 1,3,*
1 INSERM UMR-S 726, Equipe de Bioinformatique Génomique et Moléculaire (EBGM),
DSIMB, Université Paris Diderot - Paris 7, case 7113, 2, place Jussieu, 75251 Paris, France.
2 MNHN – UMR CNRS INSERM 5153, Régulation et dynamique des génomes, Laboratoire de
Biophysique, 43 rue Cuvier ; 75231 PARIS Cedex 05 – France.
3 INSERM UMR-S 665, Dynamique des Structures et Interactions des Macromolécules
Biologiques (DSIMB), Université Paris Diderot - Paris 7, Institut National de Transfusion Sanguine (INTS), 6, rue Alexandre Cabanel, 75739 Paris cedex 15, France.
Short title: transmembrane helices
* Corresponding author:
mailing address: Dr. de Brevern A.G., INSERM UMR-S 665, Dynamique des Structures et Interactions des Macromolécules Biologiques (DSIMB), Université Denis Diderot - Paris 7, INTS, 6, rue Alexandre Cabanel, 75739 Paris cedex 15, France
Tel: +33(1) 44 49 30 38 Fax: +33(1) 47 34 74 31
E-mail: alexandre.debrevern@univ-paris-diderot.fr
Abstract
-helical transmembrane proteins (TMP ) are composed of series of helices embedded in the lipid bilayer. Due to technical difficulties, few 3D structures are available. Therefore the design of structural models of TMP is of major interest. In this work, we study secondary structures of TMP by analyzing the influence of secondary structures assignment methods (SSAMs). For this purpose, a published and updated benchmark databank of TMP is used and several SSAMs (9) are evaluated. The analysis of the results points out significant differences in SSA depending on methods used. Pairwise comparisons between SSAMs led to more than 10% of disagreement. Helical regions corresponding to transmembrane zones are often correctly characterized. The study of the sequence - structure relationship shows very limited differences with regards to the structural disagreement. Secondary structure prediction based on Bayes’ rule and using only a single sequence give correct prediction rates ranging from 78 to 81%. A structural alphabet approach gives a slightly better prediction, i.e., only 2% less than the best equivalent approach whereas the prediction rate with a very different assignment bypasses 86%. This last result highlights the importance of the correct assignment choice to evaluate the prediction assessment.
Key-words: amino acid, secondary structure, secondary structure assignment method, DSSP, transmembrane protein, molecular modeling, structural alphabet.
Abbreviations: PDB: Protein DataBank, SSAM: Secondary Structure Assignment Method, DSSP: Dictionary Secondary Structure Protein, TMP : -helical transmembrane proteins.
Introduction
Transmembrane proteins represent about 25% of proteins coded by genomes (Rost et al. 1996; Jones 1998; Wallin and von Heijne 1998; Krogh et al. 2001; Arai et al. 2003; Ahram et al. 2006). They are the support of essential biological functions as receptors, transporters or channels (White et al. 2001). They are embedded in the lipid membrane which constitutes a very specific neighboring. Due to this specificity, obtaining experimental 3D transmembrane structures is still very difficult (White 2004; Newstead et al. 2008; White 2009). Thus, the total number of transmembrane proteins in the Protein DataBank (Berman et al. 2000) is limited, comprising ~1% of available structures (Tusnady et al. 2005a; von Heijne 2006). Known structures show that they can be spread over two major classes. In the first one, proteins are composed of series of transmembrane helices (White and von Heijne 2005; von Heijne 2006; Lacapere et al. 2007), e.g., the well-known rhodopsin (Palczewski et al. 2000), while in the second one, they are composed of a -sheet succession, namely the Outer Membrane Proteins (OMPs). These latter are specific of outer bacterial membrane, of mitochondria and chloroplasts (White and Wimley 1999; Gromiha and Suwa 2006). In the present study, we only focus on -helical transmembrane proteins, i.e., proteins with transmembrane -helices spanning the structures (TMP ) (Oberai et al. 2006; Arinaminpathy et al. 2009).
Many prediction methods have been applied to predict localization of transmembrane regions or helix orientation (Tusnady and Simon 2001; Nugent and Jones 2009), ranging from simple statistics method using one sequence (Taylor et al. 1994) to complex hidden Markov model using evolutionary information (Tusnady and Simon 1998; Krogh et al. 2001; Martelli et al. 2003; Zhou and Zhou 2003; Kall et al. 2004; Viklund and Elofsson 2004; Kall et al. 2005; Bagos et al. 2006) and leading to the prediction of structural models (Vaidehi et al. 2002; Becker et al. 2004; Shacham et al. 2004; Fleishman and Ben-Tal 2006; Yarov-Yarovoy et al.
2006; Zhang et al. 2006). As the number of available structures is limited, some prediction methods used annotated sequences and not 3D information. They were significantly biased (Moller et al. 2001; Chen and Rost 2002b; a) and often overestimated their prediction rates (Chen et al. 2002). Many studies focused on the analysis and conservation of amino acid properties in the helices with regards to the lipid or the aqueous phases (Stevens and Arkin 1999; Beuming and Weinstein 2004). Moreover, these helices are rarely perfect regular helices. For instance, kinks in helices are known to play some important biological roles (Ubarretxena-Belandia and Engelman 2001; Krishnamurthy et al. 2009) and are well conserved (Faham et al. 2004; Yohannan et al. 2004a; Yohannan et al. 2004b; Rosenhouse-Dantsker and Logothetis 2006; Kauko et al. 2008). In the same way, some specific sequence patterns could also be characterized (Riek et al. 2001; Rigoutsos et al. 2003).
Fundamentally, an important common issue for TMP is the precise localization of helical segments spanning the membrane from high- (Zucic and Juretic 2004; Tusnady et al. 2005b; Lomize et al. 2006a; Lomize et al. 2006b) or intermediate resolution structures (Enosh et al. 2004). Indeed, the assignment of a regular secondary structure is not a trivial task; various criteria can be used to locate -helix and -sheet (Pauling and Corey 1951a; b). Hence, numerous Secondary Structure Assignment Methods (SSAMs) based upon energetic, geometrical and/or angular criteria exist, e.g., (Thomas et al. 2001; Majumdar et al. 2005; Taylor et al. 2005; Hosseini et al. 2008). The most popular approach DSSP (Kabsch and Sander 1983) is based on the identification of hydrogen bond patterns from the protein geometry and an electrostatic model. New approaches have extended the principles defined in DSSP, e.g., SECSTR that is dedicated to improve 310 and -helices detection (Fodje and Al-Karadaghi 2002) and STRIDE that also takes into account dihedral angles (Frishman and Argos 1995). On another way, DEFINE method (Richards and Kundrot 1988) uses only C positions. It computes inter-C distance matrix and compares it with matrices produced by
ideal repetitive secondary structures. KAKSI assignment uses both the inter-C distances and dihedral angles criteria (Martin et al. 2005). SEGNO uses also the and dihedral angles coupled with other angles to assign secondary structures (Cubellis et al. 2005a; Cubellis et al. 2005b). PSEA assigns the repetitive secondary structures from the sole C position using distance and angles criteria (Labesse et al. 1997). XTLSSTR uses all the backbone atoms to compute two angles and three distances (King and Johnson 1999). PCURVE generates a global peptide axis using an extended least-squares minimization procedure (Sklenar et al. 1989). The needs for developing so many approaches are related to their own specific limits and to the various specific interests of the authors. Precise description of various SSAMs can be found in reviews (Benros et al. 2007; Offmann et al. 2007) and in research article (Tyagi et al. 2009a).
As a consequence, these different assignment methods have generated specific problems. For example, the very classical and widely used DSSP can generate very long helices which can be classified as linear, curved or kinked (Kumar and Bansal 1998; Bansal et al. 2000). That was one of the motivations of KAKSI methodology to define linear helices instead of long kinked helices (Martin et al. 2005). Moreover, the disagreement between different SSAMs is not negligible for globular protein, leading to only 80% of agreement between two distinct methods (Colloc'h et al. 1993; Dupuis et al. 2004; Fourrier et al. 2004; Martin et al. 2005; Tyagi et al. 2009a). Most methods agree on the nature and the number of secondary structures but disagree on the limits of the secondary structure elements. This could modify the sequence – structure relationship and consequently the data for predicting.
In this work, we analyzed the differences between secondary structure assignments on TMP . The consequences of the disagreements on sequence – structure relationships and on secondary structure predictions were studied. Nine different SSAMs have been used. Moreover, we also analyzed the interest of Protein Blocks, a structural alphabet designed to
analyze and predict protein structures (de Brevern et al. 2000; de Brevern 2005; de Brevern et al. 2007; Tyagi et al. 2009a). This study is based on a protein databank already published to benchmark prediction methods (Zhou and Zhou 2003; Viklund and Elofsson 2004). However an updated version has been built to take into account novel protein structures. The specific assignment of this databank was also evaluated.
Materials and Methods
Data sets
The benchmark set of proteins is the Zhou and Zhou dataset (Zhou and Zhou 2003). It is composed of 73 proteins (http://www.smbs.buffalo.edu/phys_bio/service.htm). From the original dataset, we have selected only the proteins having at least one transmembrane helix and kept only X-ray crystallographic structures. Each chain was carefully examined with geometric criteria (mainly bond lengths) to avoid bias from zones with missing density. If the bond lengths were larger than the most adopted values, we considered that the chain was probably disrupted. We also compared the primary sequence given by the SEQRES field in the PDB file with the sequence deduced from the ATOM fields, i.e., the sequence with Cartesian coordinates. In case of difference, we looked at the structure for tracing missing residues. If the residues were really missing, the chain was separated into two parts. Concerning long extremities, we considered that Nter and Cter larger than 20 residues present some particularities that could bias the results. Consequently, we chose to eliminate these regions to focus on transmembrane domains and only kept few residues in these domains. A limit of 20 residues allowed keeping intact all loop regions between TM domains. We so selected 56 proteins (available at http://www.dsimb.inserm.fr/~debrevern/S2_TMalpha/). A novel updated dataset has been built. For this purpose, all transmembrane protein structures
were downloaded from Stephen White web site (http://blanco.biomol.uci.edu/Membrane_Proteins_xtal.html) (White 2009), PDBTM (Tusnady et al. 2004; 2005a) and OPM (Lomize et al. 2006b). More than 2200 protein chains were selected. X-ray structures with a correct resolution and sharing less than 25% sequence identity with the set previously used were kept; they correspond to 375 protein chains. A new clustering on this restricted dataset allows defining 51 clusters of sequence sharing less than 25% of sequence identity. One representative protein was chosen for each sequence cluster, and carefully examined with the same criteria aforementioned. The updated databank so comprises 107 proteins and is 2.5 times bigger than the previous one. Indeed, novel selected proteins are longer thanks to the improvement in transmembrane protein crystallization (Sarkar et al. 2008; Newby et al. 2009).
Protein Blocks
Protein Blocks correspond to a set of 16 local prototypes of 5 residues length based on a ( , ) dihedral angles description (de Brevern et al. 2000; de Brevern 2005). They are labeled from a to p (cf. Figure 1 of (Tyagi et al. 2009b)). They were obtained by an unsupervised classifier similar to Kohonen Maps (Kohonen 1982; 2001) and Hidden Markov Models (Rabiner 1989). The PBs m and d can be roughly described as prototypes for core -helices and core -strands, respectively. PBs a through c primarily represent -strand N-caps and PBs e and f, C-caps; PBs g through j are specific to coils, PBs k and l to -helix N-caps, and PBs n through p to C-caps. This structural alphabet allows a good approximation of local protein 3D structures (de Brevern 2005). PBs have been learned only on globular proteins.
Secondary structure assignments
We used nine distinct softwares: DSSP (Kabsch and Sander 1983) (CMBI version 2000), STRIDE (Frishman and Argos 1995), SECSTR (Fodje and Al-Karadaghi 2002) (version
0.2.3-1), XTLSSTR (King and Johnson 1999), PSEA (Labesse et al. 1997) (version 2.0), DEFINE (Richards and Kundrot 1988) (version 2.0), P-CURVE (Sklenar et al. 1989) (version 3.1), KAKSI (Martin et al. 2005) (version 1.0.1) and SEGNO (version 3.1) (Cubellis et al. 2005b). PBs (de Brevern et al. 2000) were assigned using an in-house software (available at http://www.dsimb.inserm.fr/~debrevern/DOWN/LECT/), that follows similar assignment rules done by PBE web server (http://bioinformatics.univ-reunion.fr/PBE/) (Tyagi et al. 2006a; Tyagi et al. 2006b). DSSP, STRIDE, SECSTR, XTLSSTR and SEGNO give more than three states, so we reduced them: -helix contains , 3.10 and - helices, -strand contains only the -sheets, and, coils everything else ( -bridges, turns, bends, Polyproline II and coil). Default settings are used. The curvature of helices was analyzed with dedicated software HELANAL (Bansal et al. 2000). It takes as input a PDB file and a description of helix boundaries. It calculates local axes every four residues. The geometry of a helix is determined by the angles between axes and the goodness of fit of the helix trace with a circle or a line. Helices are then classified as kinked (K), linear (L) or curved (C). HELANAL can leave a helix unclassified if its geometry is ambivalent. The minimum length for a helix to be analyzed is nine residues. Helices for the PB approach have been assigned to PB m, others are associated to coil state.
Segment overlap
The necessity for a structurally meaningful measure of secondary structure prediction accuracy has been pointed out by numerous authors (Rost et al. 1994). The segment overlap (SOV) provides this kind of measure as it takes into account the type and position of secondary structure segments rather than a per-residue assignment of conformational state. It is more related to the natural variation of segment boundaries among families of homologous proteins and should be sensitive to the ambiguity in the position of segment ends due to differences in secondary structure classification approaches.
SOV measure assesses the quality of overlapping between repetitive structures (Rost et al. 1994). In our case –as SOV is not a bijective measure- we have so fixed one SSAM as the reference to compute SOV, with its modified definition (Zemla et al. 1999):
N(i)
len(s
1 s(i))
len(s
1 s'(i))
with s1 and s2, the two studied sequences, maxov(s1,s2) is the length of the total extent for which either of the segments s1 or s2 has a residue in -helix state, and minov(s1, s2) the minimal length, len(s1) is the length of the reference sequence. is a parameter enabling in a fine manner the overlapping of repetitive structures.
2
/
;
2
/
,
,
,
min
,
2 1 2 1 2 1 2 1 2 1s
len
s
len
s
s
ov
min
s
s
ov
min
s
s
ov
max
s
s
Agreement rateTo compare two distinct secondary structure assignment methods, we used an agreement rate which is the proportion of residues associated with the same state ( -helix, -strand and coil). It is classically noted C3 (Fourrier et al. 2004; Tyagi et al. 2009a). Here, as we only focus on helices, we compute the C2, i.e., -strand and coil are merged into one state.
Z-score
The amino acid occurrences for each state have been normalized into a Z-score (as in (de Brevern et al. 2000; de Brevern et al. 2002; Etchebest et al. 2005; Tyagi et al. 2009a)):
th j i th j i obs j i j i n n n n Z , , , ,
100
*
)]
(
*
)
,
(
max
)
,
(
)
,
(
min
[
)
(
1
)
(
) ( 1 2 1 2 1 2 1 i Ss
len
s
s
ov
s
s
s
s
ov
i
N
i
sov
with
n
iobs,j the observed occurrence number of amino acid i in position j for a given state andth ij
n
the expected number. The product of the occurrences in position j with the frequency of amino acid i in the entire databank equals ton
ith,j. Positive Z-scores (respectively negative) correspond to overrepresented amino acids (respectively underrepresented); threshold values of 4.42 and 1.96 were chosen (probability less than 10-5 and 5.10-2 respectively).Asymmetric Kullback-Leibler measure
The Kullback-Leibler measure or relative entropy (Kullback and Leibler 1951), denoted by KLd, is a measure of conformity between two amino acid distributions, i.e., the amino acid distribution observed in a given position j and the reference amino acid distribution in the protein set (DB). The relative entropy KLd(j|Tx) in the site j for the state Tx is expressed as :
DB
i
aa
P
T
i
aa
P
T
i
aa
P
T
j
KLd
j x j i i j x x)
.
ln
(
20 1where P(aaj = i|Tx) is the probability of observing the amino acid i in position j (j = -w, …,0,
…, +w) of the sequence window given a state Tx, and, P(aaj = i|DB) the probability of
observing the same amino acid in the databank (named DB). Thus, it allows one to detect the "informative" positions in terms of amino acids for a given protein block (de Brevern et al. 2000; Etchebest et al. 2005).
Prediction
In a strategy of structure prediction from sequence (de Brevern et al. 2000; Etchebest et al. 2005; Elofsson and von Heijne 2007), we must compute for a given sequence window Saa =
{aa-w, …, aa0, …, aa+w}, the probability of observing a given state Tx, i.e., P(Tx | Saa). For
dimension l x 20 centered upon the state, with l = 2 w +1 (in the study, w =7). Using the Bayes theorem to compute this a posteriori probability P(Tx | Saa) from the a priori
probability P(Saa | Tx) deduced from the occurrence matrix allows to define the odds score Rx :
w j w j j x j x
P
aa
i
DB
T
i
aa
P
R
The highest score Rx corresponds to the most probable state (de Brevern et al. 2000). Qtot
value is the total number of true predicted states over the total number of predicted residues. Qpred is the percentage of correct prediction of helical residues (or probability of correct
prediction), and Qobs is the percentage of observed helical residues hat are correctly predicted
(or percent coverage).
Results
Analysis of repetitive secondary structures
The protein databank used is a benchmark created by Zhou and Zhou (Zhou and Zhou 2003) to assess their prediction method THUMBD. It has been used latter for the assessment of PRODIV-TMHMM prediction method (Viklund and Elofsson 2004). 56 proteins have been selected from the 73 original proteins. Among the 17 proteins excluded , 10 are composed of multiple NMR models, 2 have only C atoms and 4 were obtained with a good crystallographic resolution, but the transmembrane region is missing, i.e., only the extra-cellular domains is available. For the remaining protein, the PDB id and sequence cannot be found in PDB or another database. Figure 1 shows two examples of the excluded proteins. Figure 1a and 1n focuses on the membrane fd coat protein (PDB code 1FDM (Almeida and Opella 1997)). By using multidimensional solution NMR experiments on micelle samples, the
authors succeeded to determine that an amphipathic -helix and a hydrophobic -helix were found approximately perpendicular. Figure 1a shows the superimposition of the 20 different structural models using PyMol software (DeLano 2002). Figure 1b gives the distribution of helical residues propensities along the protein sequence. This Figure underlines the difficulty to define precisely the helical regions of the transmembrane domain. Figure 1c shows the HLA-B27 protein, a Class I Histocompatibility Antigen (HLA-B*2705, PDB code 1HSA (Madden et al. 1992)) which possesses a single transmembrane protein. However, it was not crystallized and so no precise assignment could be done (predicted positions can be found on Uniprot (Leinonen et al. 2004; UniProt_Consortium 2010)). They were so both excluded. We have encoded the protein structures in terms of secondary structure assignment with different secondary structure assignment methods (SSAMs), in terms of Protein Blocks (PBs) and also check the assignment defined by Zhou and Zhou (namely ZZ) to assess their prediction method (Zhou and Zhou 2003). The comparison of secondary structure frequencies do not show a high divergence between each method, the frequencies of -helix residues for the SSAMs range from 49 to 55%, while it decreases to 52% for PBs and 45% for ZZ. Nonetheless, the distributions of helices length is clearly distinct, we can notice two main clusters of helix lengths, the first one associated to long helices (>21 residues) with P-CURVE (21.6 residues), DEFINE (23.2 residues) and ZZ (26.1 residues). We can notice that ZZ assignment is associated to long helices. The second cluster is composed of short helices with all the other SSAMs; we can note that DSSP and PBs assignment have the shortest helices in average (14.7 residues and13.1 residues, respectively). Thus, we already observe strong discrepancies between the helix assignments.
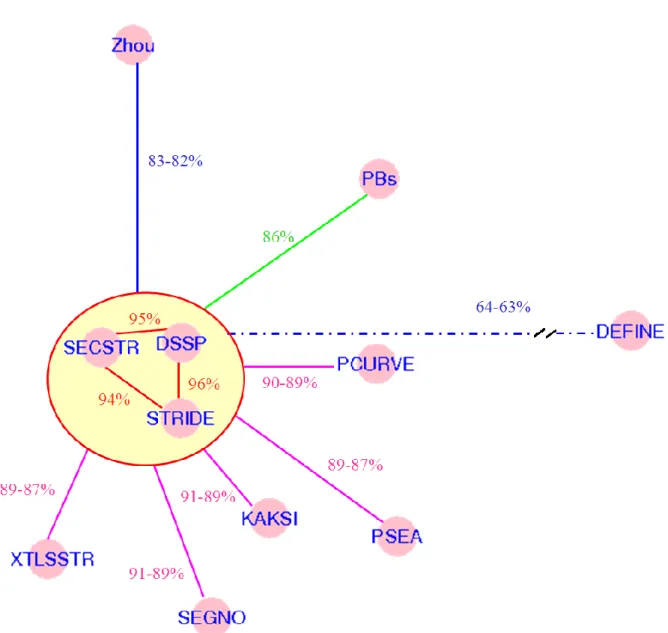
To compare, two SSAMs, an agreement rate noted C2 is computed, it corresponds to the percentage of residues associated to the same state (helix or not). Table 1 gives the comparison of SSAMs. Figure 2 gives a projection done with a Sammon map of this
information (Sammon Jr. 1969). It allows a simple representation of the difference of C2 values (see Figure 2 of (Tyagi et al. 2009a) for a similar approach performs on globular proteins). Only one cluster of SSAMs grouping highly similar assignments located in the circle in the middle of the Figure can be observed. The methods involved are all based on hydrogen bond assignment, i.e., DSSP, STRIDE and SECSTR, and have C2 values between themselves better than 94%. No other cluster can be defined. These three SSAMs have C2 values ranging from 87 to 90% with PCURVE, PSEA, KAKSI, SEGNO and XTLSSTR. These five last have C2 values ranging from 86 to 89% with each other (data not shown on the Figure for more clarity). Among all the automatic SSAMs, only DEFINE leads to a very distinct assignment given that C2 values are on average ~ 63%. These results are also in accordance with C3 values observed for globular proteins (Tyagi et al. 2009a). The two other methods which have specificities are PBs and ZZ, PBs’ C2 values are ~ 85% and ZZs’ is lower with C2 values ranging from 81 to 83%. In the same way, the Segment Overlap (SOV) was computed. In our case, it corresponds to the overlap of the helical structures of the different SSAMs to the helical regions defined by DSSP (taken coarsely as the reference as it is the most widely SSAM used, see supplementary material 1). Our analysis of the results took into account the potential differences between helix length, i.e., DSSP and PCURVE. SOV and C2 values highlighted similar behaviors. In the following, we have discarded DEFINE, this last one does not allow having a correct protein topology description.
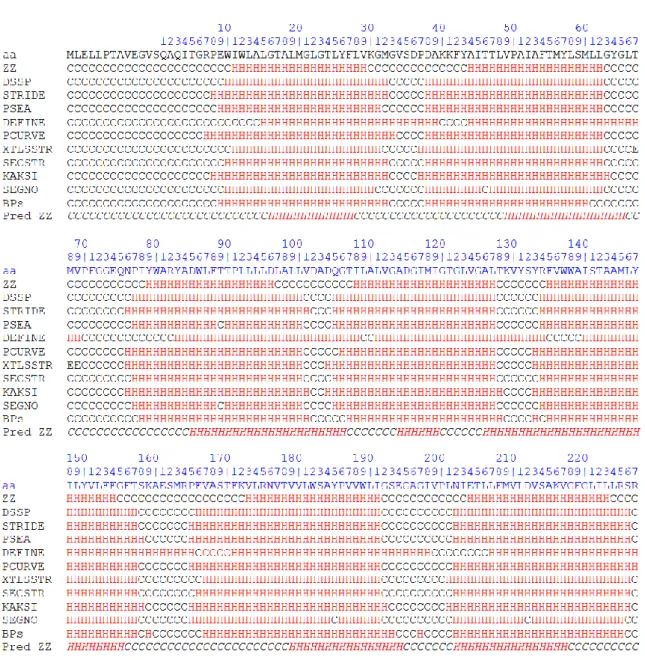
Figures 3 and 4 show an example of multiple secondary structure assignments of well-known bacteriorhodopsin (PDB code: 2BRD (Grigorieff et al. 1996)). In Figure 4, the prediction with THUMBD is given as an illustration. In Figure 3, the helices are colored in red and connecting regions in green. For the other SSAMs, we showed, with orange balls, the residues assigned as part of a helix by other SSAMs and not by DSSP. Inversely, blue balls represent residues assigned by DSSP as helical and not by the concerned SSAM. This figure underlines
two characteristics also found in other proteins of the databank: the discrepancies between SSAMs are mainly found in the extracellular regions of the transmembrane proteins. For instance, the N-cap of first helix starts at residue 10 for DSSP and SECSTR, 8 for STRIDE, 9 for PSEA and SEGNO, 7 for PCURVE, 11 for XTLSSTR. The C-cap is found at position 32 for DSSP, STRIDE, SECSTR and KAKSI and diverges by only one position for PSEA, PCURVE and XTLSSTR.
The analysis of long helices (>=9 residues) with HELANAL software did not show a specific tendency in comparison to globular proteins (Martin et al. 2005). Transmembrane helices are in majority (50%) curved. Kinked helices represent 29% of the helices. Only few of them are linear helices (8%). The remaining is not considered by HELANAL.
Sequence-structure relationship
We have analyzed the amino acid propensities within helices, coil, N and C-caps of helices (see Table 2 and supplementary material 2):
1. Concerning the N-cap of -helices (see supplementary material 2a): we find series of
characteristic over-represented amino acid [NDGS]0 followed by [PW]1 and [EW]2 (the
figures correspond to the positions, 0 for the last residue in coil, 1 for the position of the first helical residue). Thus, it is mainly composed of branched polar residues, of Tryptophan residue, a residue well known to be found at the membrane interface (von Heijne and Gavel 1988; de Planque et al. 1999; Fleishman et al. 2006), and amino acids which could be helix breakers (e.g., P). Transmembrane segments are in majority deformed helices, i.e., curved and kinked (79%). These series are found for DSSP, STRIDE, SECSTR, PCURVE, PSEA and SEGNO, shifted by +1 residue for KAKSI and XTLSSTR and -2 for the Protein Blocks. These strong over-representations, i.e., Z-score-value higher than 4.4, are limited and localized in the central region of transition from coil to helix. The under-representations are also limited, we can notice in position 0, the under-representation of hydrophobic residues,
e.g., Alanine and Valine. We can also note that, using the ZZ assignment, these amino acids are associated with the lowest informativity in terms of Kullback-Leibler values and also of Z-scores (only one strong over-representation observed).
2. Regarding the helices (see supplementary material 2b): only classical propensities are
found with over-representation of aliphatic residues (Leucine, Valine and Isoleucine) aromatic residues (Tryptophan and Phenylalanine) and hydrophobic Alanine, while under-representation concerns polar negatively charged Aspartate and Glutamate, polar positively charged Arginine and Lysine, small polar Serine and amino acids which could be helix breaker Proline, Glycine and Asparagine. No SSAM leads to new amino acid specificities with regards to the literature (Fleishman et al. 2006); we can notice that contrary to the previous case, ZZ assignment is the most informative one. This last observation is coherent with the fact that they have the longest helices and so the capping regions played a less important role in the estimation. The data for coil state is not presented because exactly opposed to the amino acid distributions for the helix state.
3. C-caps of -helices (see supplementary material 2b) are the less informative regions. A
simple amino acid series [NG]1 [P]2 [P]3 can be found and so is characteristic of the coil part.
The distinction between helical and coil region is clear for most of the SSAMs with over-representation of aliphatic residues, e.g., Leucine in the helical part and over-over-representation of breaker residues, e.g., Proline in the coil part. Only KAKSI is clearly shifted by -1 residue. Interestingly, polar residue Glutamine more often found under-represented in the helices is found over-represented at the last position of helices of STRIDE and SECSTR, Aspartate is also found at position -3 for DSSP and STRIDE. Thus, some amino acids can be found as potential signals of helix ends.
Prediction
approach based on Bayes’ rule (de Brevern et al. 2000). It makes possible to evaluate easily the predictive power of each assignment. To ensure a correct equilibrium between the protein used in the training and in the validation step, a random approach was used to select the sets for each protein; the training set representing 2/3 of the proteins, the validation the remaining 1/3. Two occurrence matrices are computed, one for the helical residue, another for the non-helical ones. Each residue in proteins is represented by the sequence fragment of 15 residue-long centered on it. Then the prediction is performed and assessed; this strategy is done 100 times independently, similarly to (Tyagi et al. 2009b). This approach gives two series of values, the average ones and the best ones (see Table 3). With the exception of DEFINE (prediction rate, Qtot, ~69% at best), all the SSAMs enable prediction rates better than 78%.
Differences between average (of the 100 simulations) and best values are within a fair range of [1.6; 3.2%].
Thus, secondary structure prediction rates using only single sequence are within a range from 78.26 to 80.95% for the SSAMs. A structural alphabet (PB) approach gives a slight better prediction (81.46%). Surprisingly, the secondary structure assignment used for benchmark set, ZZ, gives a prediction rate of 86.27%. This last remark is striking as it corresponds to a difference of 5% with the best SSAM, i.e., STRIDE, and 6.4% with DSSP, the most classical one. This higher value is associated also with a good MCC value equal to 0.73, more than 0.1 point betters to the best other MCC value. In the same way, Qobs and Qpred values have been computed; they correspond respectively to the percentage of helical residues correctly predicted for all the true helical residues (sensitivity), and to the percentage of helical residues correctly predicted for all the predicted helical residues (positive predictive value). Thus the behavior of ZZ is mainly due to a lower number of helix residues; therefore it gives the best Qobs value (or percent coverage), i.e., 93.7%, but a low Qpred value (or probability of correct prediction), i.e., 70.7%. In fact, it predicts 10% less helix than other approaches while its helix
frequency is only 5% lower.
Interestingly, the design of a consensus approach to improve the prediction (using DSSP as the standard) does not give any significant improvement and in many cases, any combination of multiple SSAM prediction methods goes to a decrease of Qtot value.
In the same way, C2 values have been computed for the predictions. C2 values for “prediction”
are better than C2 “assignment” values in every case (see supplementary data 3). It is entirely
consistent with the analysis of sequence – structure relationships (see section sequence-structure relationship) that shows limited differences between SSAMs. Hence, the predictions converge more to the same definition of helical and non-helical regions than the structure definition. Only ZZ does not show any important improvement emphasizing its specific definition.
As a last point, we examined the influence of the databank. Indeed, the databank, although used as a benchmark by other authors, was rather old. Moreover, the number of available structures has recently markedly increased. The databank has been updated with novel high-quality non-redundant protein structures (see Materials section). The protein databank is 2.5 times bigger than the original one. Similarly as previously done, prediction has been applied to this updated databank (see supplementary material 4). 100 independent simulations were performed for DSSP, STRIDE and PBs, average and best prediction rates were analyzed. On the average, very few differences can be found for MCC, Qobs and Qpred. Qtot values slightly
decrease whereas standard deviations slightly increase.
This last point is underlined by the results obtained from the best prediction simulation. The MCCs increase by 0.03 to 0.06, while all Qtot values increase by 1.8% for DSSP, 1.1 for
STRIDE and 1.6% for PBs, i.e., a value of 83.1%. Hence, the good results of this approach are improved with a larger dataset. However, we were not able to test ZZ assignment because it cannot be performed on new protein structures.
Discussion
This study focuses on precise localization of helices. We have used only X-ray 3D structures (Ikeda et al. 2003). Thus from the original dataset, some proteins have been excluded. As expected, SSAMs diverged as much for transmembrane protein as for globular ones (C2 values ~88%). PBs, which are characterized by shorter helices lengths, are a bit more distant with C2 values ~85%, while ZZ assignment has clearly distinct assignment with C2 values ~82% and 20% less residues associated to the helices than other SSAMs. DEFINE remains an outlier as it was also for the globular proteins (Fourrier et al. 2004). We can notice that DSSP is associated to short helices, it is an opposite behavior to the one observed with globular proteins (Martin et al. 2005). Hence, DSSP gives more breaks in transmembrane helices than other related approaches. Concerning the helix breaks, a fine analysis of some examples shows that they cannot be attributed to the sole assignment method used but are true disruption of the secondary structure. Moreover, we often observed Proline at the break position or in the close neighborhood. The role of these proline residues needs to be further investigated considering multiple sequence alignment to check the conservation of this position. This could bring clues about the structural and or functional role of this residue in the protein.
Precise analysis of the curvature of helices between the different SSAMs do not show significant differences between the different classical SSAMs, i.e., DSSP, STRIDE, SECSTR, PCURVE, PSEA, KAKSI, SEGNO and XTLSSTR. The percentage of linear helices remains low (<10%) while the curved helices still represent more than half of the helices. We observe only for PCURVE a slight increase of kinked helices, due to the fact that their helices are longer.
Analysis of the amino acid repartition shows that differences in terms of assignment has no consequence on the sequence structure relationships for helices, helices termini or coil states.
It corroborates equivalent analyses done on globular proteins (Tyagi et al. 2009b; a). The most diverging SSAM is again ZZ characterized by low informative helix extremities, but the most informative for the helix core. Nonetheless, all the different SSAMs describe propensities that support well the TM tendency scale defined by Zhao and London (Zhao and London 2006). Indeed, residues associated with a positive value for this scale are over-represented in helix (and over-represented in coil). In the same way, the most under-represented residues in helix (and over-under-represented in coil) are associated to strong negative values. Future work will deal more deeply with the comparative analysis of such features. Prediction of the automatic SSAMs gives very homogeneous prediction rates with the notable exception of ZZ assignment that bypasses the best prediction by 5%. Viklund and Elofsson have assessed the prediction rates of THUMBUP and their own method (Viklund and Elofsson 2004), PRODIV-TMHMM, given Qtot values of 84 and 88%. Both methods have been trained with ZZ dataset and are based on Hidden Markov Models with evolutionary information. Here, the simple Bayesian approach using only one sequence gives 2% better prediction rate than THUMBUP and 2% less than PRODIV-TMHMM. These two methods were dedicated to protein topology prediction. Nonetheless, the results of such a simple approach are quite good. Moreover, it is a robust approach as we have shown that it is not sensitive to sequence identity level (Tyagi et al. 2009b). This work also emphasizes the importance of a precise definition of the assignment. So, we clearly support the approach done by Cuthbertson and co-workers (Cuthbertson et al. 2005) that have compared numerous prediction methods in a very rigorous way. They defined TM helices within membrane protein structures using DSSP. They consider the full extent of each TM helix, including residues which may resideoutside the (presumed) limits of the lipid bilayer. They adopted this approachbecause any attempt to define simply the bilayerspanning element of a TM helix is contingent upon the model used to assign this latter. Indeed, the absenceof lipid molecules
from the majority of crystals of membraneproteins prevents any experimental delimitation. In this case, we can note that our Bayesian prediction gives a prediction rate of 79.9% for the original dataset and 81.6% with the updated dataset, thus 3-4 and 1.5-2.5% less than best (and rigorously) evaluated prediction methods (Cuthbertson et al. 2005).
To go further, we have analyzed on the original dataset with prediction performed by PSI-PRED (Jones 1999) and MINNOU (Cao et al. 2006). The first one is specialized on prediction of globular proteins, while the second is dedicated to TMP . MINNOU has a published prediction rate of 9% higher than our approach, a coherent result with regards to the classification method and information used (Cao et al. 2006). However, on our dataset, PSI-PRED prediction rate equals 82.5% while the second is slightly lower 81.8%. Both are greatly lower than THUMBD. Interestingly, only 82.8% of the residues have been predicted similarly by PSI-PRED and MINNOU. This confusion decreases with ZZ assignment and ZZ prediction (THUMBD); MINNOU has a C2 of 71.0% with ZZ assignment and only 60.0% with the prediction. Part of this result is due to (i) the databank by itself which had a significant influence, and (ii) to the absence of long protein extremities (composed only of coil residue always well predicted). The prediction rate decreases by 7% if long N and C termini are not taken into account.
Conclusions
This research shows that SSAMs differ in assignment even for transmembrane protein; it is coherent with previous remarks and researches on related subjects (Fourrier et al. 2004; Tusnady et al. 2004; Tyagi et al. 2009a). These divergences have no significant repercussion on sequence – structure relationships. Nonetheless, when a non automatic assignment like in ZZ work is done, a major and impressive difference is observed and could be related to the previous remarks done by Moeller and co-workers (Moller et al. 2001). This study highlights
also clearly the influence of the assignment and potential consequences on the way prediction is assessed. Moreover we have tested a more complex learning approach using neural agent that used also occurrence matrices. This approach does not increase greatly the prediction rate (1% on average for each method). In the same way, use of consensus approach does not provide significant gain, contrary to other approaches that used multiple distinct prediction methods (Ikeda et al. 2002; Nilsson et al. 2002) or different SSAMs to described the protein structure (Cuff and Barton 1999). This work also emphases the importance of an independent assessment of state-of-the-art approach as TMH Benchmark performed in the Rost Lab (Kernytsky and Rost 2003). Methods that employ evolutionaryinformation are mainly more accurate than methods based oninformation derived from a single sequence (Cuthbertson et al. 2005). However, we show here that single sequence methods gives quite impressive results compared to more complex approach. We can also noticed that the obtained Qtot values are superior to PSIPRED on PTM as evaluated by (Cao et al. 2006). As the number of structures used in the prediction research could vary from 73 (Cao et al. 2006) to 265 (Amirova et al. 2007), while others used datasets based on experimental evidences given the protein topology (Jones 2007; Roy Choudhury and Novic 2009), the comparison between methods is not straightforward. A curated structural benchmark could be a valuable tool for the scientific community, with clear description of the purpose and definition of the different states to be predicted (Moller et al. 2000). It will not change the quality of the prediction rates obtained that are high (Cuthbertson et al. 2005), but could clarify the difficulty of comparison.
It was already shown years ago that many prediction methods were biased when using prediction of TMP rather than structural information (Moller et al. 2001; Chen et al. 2002). Hence, this lack of consensus has implication for the conception of pertinent structural models (Law et al. 2005; Elofsson and von Heijne 2007). More than 10 tools are nowadays available for defining the number and the limits of the TM segments and all of them exhibit rather
comparable success rates (Shen & Chou, 2008)(Rangwala et al. 2009). The relevance of prediction tools well-tried on soluble proteins however is far to be proved for TM proteins. For instance, the extension of Rosetta approach to TM proteins (Yarov-Yarovoy et al. 2006), despite its interest, requires some specific evaluation criterion for assessing its generalization. The TM segments may not be considered as simple helical stretches but their structure requires a more accurate description (Bensel et al., 2008). This may be obtained with the help of a structural alphabet (Offmann et al. 2007; Joseph et al. 2010) as it has been used for defining DARC structural model (de Brevern et al. 2005; de Brevern 2009; de Brevern et al. 2009). The results herein described are quite important for molecular modelling of transmembrane proteins (de Graaf and Rognan 2009; Mornon et al. 2009), which are major medical drug targets, (Jacoby et al. 2006; Lacapere et al. 2007; Landry and Gies 2008; Arinaminpathy et al. 2009) and to improve protein topology prediction approaches (Harrington and Ben-Tal 2009; Klammer et al. 2009; Nugent and Jones 2009).
Acknowledgements
The authors would like to thank the reviewers for their comments that help improving the manuscript. They also thank Aurélie Urbain for her help to design the new updated databank. This work was supported by grants from the Ministère de la Recherche, Université Paris Diderot – Paris 7, National Institute for Blood Transfusion (INTS) and National Institute for Health and Medical Research (INSERM). AB had a grant from the Ministère de la Recherche. AdB is also supported by an Indo-French Collaborative grant (grant from CEFIPRA number 3903- E).
Figures & Tables
Figure 1 - Example of excluded proteins. (a) NMR models of membrane fd coat protein (PDB
code 1FDM (Almeida and Opella 1997))., (b) protein HLA-B27 (PDB code 1HSA (Madden et al. 1992)) with putative transmembrane position.
Figure 2 – Sammon map of C2 correspondence of SSAMs. The C2 distances have been used to build a Sammon map (Sammon Jr. 1969) using R software (Ihaka and Gentleman 1996). Some values are given to help the interpretation of the data (see Table 1 for all the values).
Figure 3 – 3D structure of the bacteriorhodopsin (Grigorieff et al. 1996) assigned by different SSAMs. (a) DSSP, (b) STRIDE, (c) SECSTR, (d)
SEGNO, (e) KAKSI, (f) ZZ, (g) PSEA, (h) XTLSSTR, (i) PCURVE and (j) the Protein Blocks. Visualization has been done with PyMol software (DeLano 2002). The helices are in red and the loops in green. Residues assigned by DSSP as helical but not by other SSAMs are represented as blue balls. The opposite case is represented by orange balls.
Figure 4 - The structure of bacteriorhodopsin (Grigorieff et al. 1996) assigned by different
SSAMs. Is given the amino acid sequence of bacteriorhodopsin with numbering corresponding to the PDB files, H corresponds to a helical state and C to a non- helical state (see Methods). See also Figure 3 for visualization.
Table 1 – Confusion matrix. C2 values between the different SSAMs.
DSSP STRIDE PSEA KAKSI DEFINE PCURVE XTLSSTR SECSTR SEGNO PBs STRIDE 95.96 PSEA 89.09 89.45 KAKSI 89.75 91.46 88.93 DEFINE 64.11 63.97 66.66 65.6 PCURVE 89.87 90.65 89.61 89.91 76.43 XTLSSTR 88.68 89.23 86.93 89.92 62.47 86.87 SECSTR 95.26 94.18 87.96 89.76 63.41 89.32 87.71 SEGNO 90.25 91.02 89.08 88.73 64.05 89.72 88.51 89.15 PBs 86.16 86.78 85.47 85.60 64.48 88.75 83.58 86.8 85.53 ZZ 83.67 83.87 82.71 83.11 63.52 84.99 81.73 82.96 81.37 81.71
Table 2 – amino acid over- and under-representations. Are given the over- and under-represented amino acid for the different SSAMs. (left part)
at the N termini of -helix, (center part) within a -helix, (part) at the C termini of -helix. The over-represented (respectively under-represented) amino acids have a Z-score value more than 1.96 (resp. less than -1.96). In blue bold, they have a Z-score value more than 4.4 (resp. less than -4.4). Larger window around these three positions are given in supplementary materials 2 to 4.
Sec. Struct. C C H H H H H H H C C + -1 0 1 2 -1 0 1 -1 0 1 2 DSSP D Q P N D G S P W E P W I L F W V A I L F W V A I L M F W V L A L N G H N G K P STRIDE P N D G S P W E W I L F W V A I L F W V A I L F W V L K A Q Y N G H K P SECSTR D G P N D P S T P W E W I L F W V A I L F W V A I L M F W V L Q F R N G N G K P PCURVE N D S N G P S E P W E W A I L F W V A I L F W V A I L F W V L K L N G P PSEA D Q N D S T P E P W A I L F W V A I L F W V A I L M F W V L C L N G T G P XTLSSTR P D F S N D G S P W A I L F W V A I L F W V A I L F W V L M L N G N K P KAKSI D T N D P S L P W I L F W V A I L F W V A I L F W V L G N K P P SEGNO Q P N D S T P W E W A I L F W V A I L F W V A I L F W V A L W A L N Q G H G K P PBs P W D E W D Q E R Q P W A I L F W V A I L F W V A I L F W V N D N R K D ZZ S N D N P Y E P A I L M F W V A I L M F W V A I L M F W V A L L M R K R N G - -1 0 1 2 -1 0 1 -1 0 1 2 DSSP A L F V N C M C R N D Q G E K P S R N D G E K P S R N D G E K P S D G P G P P W V STRIDE W A I L M F V G M S I V R N D Q G E K P S R N DG E K P S R N D G E K P S G P G I P E L P W V A SECSTR A A I L M F V S R N D G E K P R N D G E K P S R N D G E K P S D G P P W V A I L W PCURVE A L V A I K V L R N D E K P S R N D G E K P S R N D G E K P S D G E P T G H P A PSEA A Q L V A G S R N D Q G E K P S R N D G E K P S R N D G E K P S G P D G P A E L L XTLSSTR Y A L F V G M R N D G E K P R N D G E K P S R N D G E K P S N G P D P V E P A V KAKSI A A E M V A R D G E K P R N D G E K P R N D G E KP S G P E P SEGNO L A L M C Q G C R N D Q G E K P R N D Q G E K P S R N D G E K P S G K P D G P E P A L PBs C V C I V S V R N D G E K P S R N D G E K P S R N D G E K P S V G I V ZZ A L R N D Q E K P S R N D Q E K P S R N D Q E K P S P P W L
best DSSP STRIDE PSEA KAKSI DEFINE PCURVE XTLSSTR SECSTR SEGNO PBs ZZ
MCC 0.6 0.58 0.59 0.59 0.36 0.59 0.57 0.58 0.57 0.61 0.73
Qobs 76.58 85.45 77.45 85.36 64.20 72.62 75.22 86.37 85.85 87.19 93.71
Qpred 81.51 84.98 78.25 82.31 61.54 78.42 80.07 83.74 81.03 83.00 70.70
Qtot 79.87 80.95 79.71 80.36 68.93 80.38 78.26 80.73 79.63 81.46 86.27
average DSSP STRIDE PSEA KAKSI DEFINE PCURVE XTLSSTR SECSTR SEGNO PBs ZZ
MCC 0.56 0.56 0.56 0.54 0.26 0.53 0.53 0.56 0.54 0.58 0.70
Qobs 76.35 77.08 76.9 75.75 64.82 74.52 75.1 76.5 75.73 77.6 88.73
Qpred 79.41 80.72 77.6 77.01 46.76 72.88 77.97 80.43 76.92 80.14 67.74
Qtot 78.26 78.64 78.42 77.53 63.93 77.17 76.74 78.26 77.58 79.67 84.39
sd 0.92 1.13 0.86 1.52 4.24 1.37 1.06 1.36 1.15 1.16 1.39
Table 3 - Prediction of transmembrane proteins. For each kind of assignment, is given using Bayesian prediction the Mathews Correlation
Coefficient (MCC (Matthews 1975)), Qobs, Qpred and Qtot, (upper): best results, (lower) average values for the 100 independent simulations; (sd)
References
Ahram, M., Litou, Z.I., Fang, R., and Al-Tawallbeh, G. 2006. Estimation of membrane proteins in the human proteome. In Silico Biol 6: 379-386.
Almeida, F.C., and Opella, S.J. 1997. fd coat protein structure in membrane environments: structural dynamics of the loop between the hydrophobic trans-membrane helix and the amphipathic in-plane helix. J Mol Biol 270: 481-495.
Amirova, S.R., Milchevsky, J.V., Filatov, I.V., Esipova, N.G., and Tumanyan, V.G. 2007. Study and prediction of secondary structure for membrane proteins. J Biomol Struct Dyn 24: 421-428.
Arai, M., Ikeda, M., and Shimizu, T. 2003. Comprehensive analysis of transmembrane topologies in prokaryotic genomes. Gene 304: 77-86.
Arinaminpathy, Y., Khurana, E., Engelman, D.M., and Gerstein, M.B. 2009. Computational analysis of membrane proteins: the largest class of drug targets. Drug Discov Today
14: 1130-1135.
Bagos, P.G., Liakopoulos, T.D., and Hamodrakas, S.J. 2006. Algorithms for incorporating prior topological information in HMMs: application to transmembrane proteins. BMC Bioinformatics 7: 189.
Bansal, M., Kumar, S., and Velavan, R. 2000. HELANAL: a program to characterize helix geometry in proteins. J Biomol Struct Dyn 17: 811-819.
Becker, O.M., Marantz, Y., Shacham, S., Inbal, B., Heifetz, A., Kalid, O., Bar-Haim, S., Warshaviak, D., Fichman, M., and Noiman, S. 2004. G protein-coupled receptors: in silico drug discovery in 3D. Proc Natl Acad Sci U S A 101: 11304-11309.
Benros, C., Martin, J., Tyagi, M., and de Brevern, A.G. 2007. Description of the local protein structure. I. Classical approaches. In Recent Adv. In Structural Bioinformatics. (ed. A.G. de Brevern), pp. 1-33. Research signpost, Trivandrum.
Berman, H.M., Westbrook, J., Feng, Z., Gilliland, G., Bhat, T.N., Weissig, H., Shindyalov, I.N., and Bourne, P.E. 2000. The Protein Data Bank. Nucleic Acids Res 28: 235-242. Beuming, T., and Weinstein, H. 2004. A knowledge-based scale for the analysis and
prediction of buried and exposed faces of transmembrane domain proteins. Bioinformatics 20: 1822-1835.
Cao, B., Porollo, A., Adamczak, R., Jarrell, M., and Meller, J. 2006. Enhanced recognition of protein transmembrane domains with prediction-based structural profiles. Bioinformatics 22: 303-309.
Chen, C.P., Kernytsky, A., and Rost, B. 2002. Transmembrane helix predictions revisited. Protein Sci 11: 2774-2791.
Chen, C.P., and Rost, B. 2002a. Long membrane helices and short loops predicted less accurately. Protein Sci 11: 2766-2773.
Chen, C.P., and Rost, B. 2002b. State-of-the-art in membrane protein prediction. Appl Bioinformatics 1: 21-35.
Colloc'h, N., Etchebest, C., Thoreau, E., Henrissat, B., and Mornon, J.P. 1993. Comparison of three algorithms for the assignment of secondary structure in proteins: the advantages of a consensus assignment. Protein Eng 6: 377-382.
Cubellis, M.V., Caillez, F., Blundell, T.L., and Lovell, S.C. 2005a. Properties of polyproline II, a secondary structure element implicated in protein-protein interactions. Proteins
58: 880-892.
Cubellis, M.V., Cailliez, F., and Lovell, S.C. 2005b. Secondary structure assignment that accurately reflects physical and evolutionary characteristics. BMC Bioinformatics 6
Cuff, J.A., and Barton, G.J. 1999. Evaluation and improvement of multiple sequence methods for protein secondary structure prediction. Proteins 34: 508-519.
Cuthbertson, J.M., Doyle, D.A., and Sansom, M.S. 2005. Transmembrane helix prediction: a comparative evaluation and analysis. Protein Eng Des Sel 18: 295-308.
de Brevern, A.G. 2005. New assessment of Protein Blocks. In Silico Biology 5: 283-289. de Brevern, A.G. 2009. New opportunities to fight against infectious diseases and to identify
pertinent drug targets with novel methodologies. Infect Disord Drug Targets 9: 246-247.
de Brevern, A.G., Autin, L., Colin, Y., Bertrand, O., and Etchebest, C. 2009. In silico studies on DARC. Infect Disord Drug Targets 9: 289-303.
de Brevern, A.G., Etchebest, C., Benros, C., and Hazout, S. 2007. "Pinning strategy": a novel approach for predicting the backbone structure in terms of Protein Blocks from sequence. J Biosciences 32: 51-70.
de Brevern, A.G., Etchebest, C., and Hazout, S. 2000. Bayesian probabilistic approach for predicting backbone structures in terms of protein blocks. Proteins 41: 271-287. de Brevern, A.G., Valadie, H., Hazout, S., and Etchebest, C. 2002. Extension of a local
backbone description using a structural alphabet: a new approach to the sequence-structure relationship. Protein Sci 11: 2871-2886.
de Brevern, A.G., Wong, H., Tournamille, C., Colin, Y., Le Van Kim, C., and Etchebest, C. 2005. A structural model of a seven-transmembrane helix receptor: The Duffy antigen/receptor for chemokine (DARC). Biochim Biophys Acta 1724: 288-306. de Graaf, C., and Rognan, D. 2009. Customizing G Protein-coupled receptor models for
structure-based virtual screening. Curr Pharm Des 15: 4026-4048.
de Planque, M.R., Kruijtzer, J.A., Liskamp, R.M., Marsh, D., Greathouse, D.V., Koeppe, R.E., 2nd, de Kruijff, B., and Killian, J.A. 1999. Different membrane anchoring positions of tryptophan and lysine in synthetic transmembrane alpha-helical peptides. J Biol Chem 274: 20839-20846.
DeLano, W.L.T. 2002. The PyMOL Molecular Graphics System DeLano Scientific, San Carlos, CA, USA. http://www.pymol.org.
Dupuis, F., Sadoc, J.F., and Mornon, J.P. 2004. Protein secondary structure assignment through Voronoi tessellation. Proteins 55: 519-528.
Elofsson, A., and von Heijne, G. 2007. Membrane Protein Structure: Prediction vs Reality. Annu Rev Biochem 76: 125-140.
Enosh, A., Fleishman, S.J., Ben-Tal, N., and Halperin, D. 2004. Assigning transmembrane segments to helices in intermediate-resolution structures. Bioinformatics 20 Suppl 1: I122-I129.
Etchebest, C., Benros, C., Hazout, S., and de Brevern, A.G. 2005. A structural alphabet for local protein structures: Improved prediction methods. Proteins 59: 810-827.
Faham, S., Yang, D., Bare, E., Yohannan, S., Whitelegge, J.P., and Bowie, J.U. 2004. Side-chain contributions to membrane protein structure and stability. J Mol Biol 335: 297-305.
Fleishman, S.J., and Ben-Tal, N. 2006. Progress in structure prediction of alpha-helical membrane proteins. Curr Opin Struct Biol 16: 496-504.
Fleishman, S.J., Unger, V.M., and Ben-Tal, N. 2006. Transmembrane protein structures without X-rays. Trends Biochem Sci 31: 106-113.
Fodje, M.N., and Al-Karadaghi, S. 2002. Occurrence, conformational features and amino acid propensities for the pi-helix. Protein Eng 15: 353-358.
Fourrier, L., Benros, C., and de Brevern, A.G. 2004. Use of a structural alphabet for analysis of short loops connecting repetitive structures. BMC Bioinformatics 5: 58.
Frishman, D., and Argos, P. 1995. Knowledge-based protein secondary structure assignment. Proteins 23: 566-579.
Grigorieff, N., Ceska, T.A., Downing, K.H., Baldwin, J.M., and Henderson, R. 1996. Electron-crystallographic refinement of the structure of bacteriorhodopsin. J Mol Biol
259: 393-421.
Gromiha, M.M., and Suwa, M. 2006. Discrimination of outer membrane proteins using machine learning algorithms. Proteins 63: 1031-1037.
Harrington, S.E., and Ben-Tal, N. 2009. Structural determinants of transmembrane helical proteins. Structure 17: 1092-1103.
Hosseini, S., Sadeghi, M., Pezeshk, H., Eslahchi, C., and Habibi, M. 2008. PROSIGN: a method for protein secondary structure assignment based on three-dimensional coordinates of consecutive C(alpha) atoms. Comput Biol Chem. 32: 406-411.
Ihaka, R., and Gentleman, R. 1996. R: a language for data analysis and graphics. J Comput Graph Stat 5: 299-314.
Ikeda, M., Arai, M., Lao, D.M., and Shimizu, T. 2002. Transmembrane topology prediction methods: a re-assessment and improvement by a consensus method using a dataset of experimentally-characterized transmembrane topologies. In Silico Biol 2: 19-33. Ikeda, M., Arai, M., Okuno, T., and Shimizu, T. 2003. TMPDB: a database of
experimentally-characterized transmembrane topologies. Nucleic Acids Res 31: 406-409.
Jacoby, E., Bouhelal, R., Gerspacher, M., and Seuwen, K. 2006. The 7 TM G-protein-coupled receptor target family. ChemMedChem 1: 761-782.
Jones, D.T. 1998. Do transmembrane protein superfolds exist? FEBS Lett 423: 281-285. Jones, D.T. 1999. Protein secondary structure prediction based on position-specific scoring
matrices. J Mol Biol 292: 195-202.
Jones, D.T. 2007. Improving the accuracy of transmembrane protein topology prediction using evolutionary information. Bioinformatics 23: 538-544.
Joseph, A.P., Bornot, A., and de Brevern, A.G. 2010. Local Structure Alphabets. In Protein Structure Prediction (eds. H. Rangwala, and G. Karypis), pp. in press. wiley.
Kabsch, W., and Sander, C. 1983. Dictionary of protein secondary structure: pattern recognition of hydrogen-bonded and geometrical features. Biopolymers 22: 2577-2637.
Kall, L., Krogh, A., and Sonnhammer, E.L. 2004. A combined transmembrane topology and signal peptide prediction method. J Mol Biol 338: 1027-1036.
Kall, L., Krogh, A., and Sonnhammer, E.L. 2005. An HMM posterior decoder for sequence feature prediction that includes homology information. Bioinformatics 21 Suppl 1: i251-257.
Kauko, A., Illergard, K., and Elofsson, A. 2008. Coils in the membrane core are conserved and functionally important. J Mol Biol 380: 170-180.
Kernytsky, A., and Rost, B. 2003. Static benchmarking of membrane helix predictions. Nucleic Acids Res 31: 3642-3644.
King, S.M., and Johnson, W.C. 1999. Assigning secondary structure from protein coordinate data. Proteins 35: 313-320.
Klammer, M., Messina, D.N., Schmitt, T., and Sonnhammer, E.L. 2009. MetaTM - a consensus method for transmembrane protein topology prediction. BMC Bioinformatics 10: 314.
Kohonen, T. 1982. Self-organized formation of topologically correct feature maps. Biol. Cybern 43: 59-69.
Kohonen, T. 2001. Self-Organizing Maps (3rd edition). Springer, pp. 501.
Krishnamurthy, H., Piscitelli, C.L., and Gouaux, E. 2009. Unlocking the molecular secrets of sodium-coupled transporters. Nature 459: 347-355.
Krogh, A., Larsson, B., von Heijne, G., and Sonnhammer, E.L. 2001. Predicting transmembrane protein topology with a hidden Markov model: application to complete genomes. J Mol Biol 305: 567-580.
Kullback, S., and Leibler, R.A. 1951. On information and sufficiency. Ann Math Stat 22: 79-86.
Kumar, S., and Bansal, M. 1998. Geometrical and sequence characteristics of alpha-helices in globular proteins. Biophys J 75: 1935-1944.
Labesse, G., Colloc'h, N., Pothier, J., and Mornon, J.P. 1997. P-SEA: a new efficient assignment of secondary structure from C alpha trace of proteins. Comput Appl Biosci
13: 291-295.
Lacapere, J.J., Pebay-Peyroula, E., Neumann, J.M., and Etchebest, C. 2007. Determining membrane protein structures: still a challenge! Trends Biochem Sci 32: 259-270. Landry, Y., and Gies, J.P. 2008. Drugs and their molecular targets: an updated overview.
Fundam Clin Pharmacol 22: 1-18.
Law, R.J., Capener, C., Baaden, M., Bond, P.J., Campbell, J., Patargias, G., Arinaminpathy, Y., and Sansom, M.S. 2005. Membrane protein structure quality in molecular dynamics simulation. J Mol Graph Model 24: 157-165.
Leinonen, R., Diez, F.G., Binns, D., Fleischmann, W., Lopez, R., and Apweiler, R. 2004. UniProt archive. Bioinformatics 20: 3236-3237.
Lomize, A.L., Pogozheva, I.D., Lomize, M.A., and Mosberg, H.I. 2006a. Positioning of proteins in membranes: a computational approach. Protein Sci 15: 1318-1333.
Lomize, M.A., Lomize, A.L., Pogozheva, I.D., and Mosberg, H.I. 2006b. OPM: orientations of proteins in membranes database. Bioinformatics 22: 623-625.
Madden, D.R., Gorga, J.C., Strominger, J.L., and Wiley, D.C. 1992. The three-dimensional structure of HLA-B27 at 2.1 A resolution suggests a general mechanism for tight peptide binding to MHC. Cell 70: 1035-1048.
Majumdar, I., Krishna, S.S., and Grishin, N.V. 2005. PALSSE: A program to delineate linear secondary structural elements from protein structures. BMC Bioinformatics 6: 202. Martelli, P.L., Fariselli, P., and Casadio, R. 2003. An ENSEMBLE machine learning
approach for the prediction of all-alpha membrane proteins. Bioinformatics 19 Suppl
1: i205-211.
Martin, J., Letellier, G., Marin, A., Taly, J.-F., de Brevern, A.G., and Gibrat, J.-F. 2005. Protein secondary structure assignment revisited: a detailed analysis of different assignment methods. BMC Structural Biology 5: 17.
Moller, S., Croning, M.D., and Apweiler, R. 2001. Evaluation of methods for the prediction of membrane spanning regions. Bioinformatics 17: 646-653.
Moller, S., Kriventseva, E.V., and Apweiler, R. 2000. A collection of well characterised integral membrane proteins. Bioinformatics 16: 1159-1160.
Mornon, J.P., Lehn, P., and Callebaut, I. 2009. Molecular models of the open and closed states of the whole human CFTR protein. Cell Mol Life Sci 66: 3469-3486.
Newby, Z.E., O'Connell, J.D., 3rd, Gruswitz, F., Hays, F.A., Harries, W.E., Harwood, I.M., Ho, J.D., Lee, J.K., Savage, D.F., Miercke, L.J., et al. 2009. A general protocol for the crystallization of membrane proteins for X-ray structural investigation. Nat Protoc 4: 619-637.
Newstead, S., Ferrandon, S., and Iwata, S. 2008. Rationalizing alpha-helical membrane protein crystallization. Protein Sci 17: 466-472.
Nilsson, J., Persson, B., and Von Heijne, G. 2002. Prediction of partial membrane protein topologies using a consensus approach. Protein Sci 11: 2974-2980.
Nugent, T., and Jones, D.T. 2009. Transmembrane protein topology prediction using support vector machines. BMC Bioinformatics 10: 159.