HAL Id: inserm-00580193
https://www.hal.inserm.fr/inserm-00580193
Submitted on 20 Apr 2011
HAL is a multi-disciplinary open access
archive for the deposit and dissemination of sci-entific research documents, whether they are pub-lished or not. The documents may come from teaching and research institutions in France or abroad, or from public or private research centers.
L’archive ouverte pluridisciplinaire HAL, est destinée au dépôt et à la diffusion de documents scientifiques de niveau recherche, publiés ou non, émanant des établissements d’enseignement et de recherche français ou étrangers, des laboratoires publics ou privés.
for medical images.
Ke Wu, Carole Garnier, Jean-Louis Coatrieux, Huazhong Shu
To cite this version:
Ke Wu, Carole Garnier, Jean-Louis Coatrieux, Huazhong Shu. A preliminary study of moment-based texture analysis for medical images.. Conference proceedings : .. Annual International Conference of the IEEE Engineering in Medicine and Biology Society. IEEE Engineering in Medicine and Biology Society. Annual Conference, Institute of Electrical and Electronics Engineers (IEEE), 2010, 2010, pp.5581-4. �10.1109/IEMBS.2010.5626789�. �inserm-00580193�
A Preliminary Study of Moment-based Texture Analysis for Medical
Images
Ke Wu, Carole Garnier, Jean-Louis Coatrieux, Fellow, IEEE, Huazhong Shu, Senior Member, IEEE
Abstract—A moment-based approach is proposed for texture
analysis of medical images. The neighborhood of texture pixel is calculated by moments for texture feature extraction. After verified on Brodatz textures, the moment-based texture analysis method is applied on CT liver scan classification and prostate ultrasound segmentation. A support vector machine and a multi-channel active contour model are used in our application. The result shows that our method works well but still have some limitations.
I. INTRODUCTION
N the past decades, the major advance of medical imaging such as Computer Tomography (CT), Magnetic Resonance Imaging (MRI) and ultrasound imaging techniques provides great assistant for medical diagnosis. The medical image analysis and processing became an active research field. Since many medical images do not exhibit regions of uniform and smooth intensities but homogeneous structures and patterns, texture plays an important role in medical image processing. Texture analysis presents the possibility of automatic image processing and quantification of the pathology information which is detected visually by the radiologist. It also increases in the amount of information taken from the image by adding the information that cannot be perceived visually by the observer.
The application of a texture analysis method generally consists in extracting a set of parameters to characterize texture, each texture parameter expresses a special property of the texture such as coarseness, homogeneity, or the local contrast. The texture feature extraction is carried out either at the level of each pixel by calculating the textural parameters on very small neighborhood, or at the level of Region of Interest (ROI) defined by the user which corresponds in
practice to a large number of pixels. Many texture feature extraction methods have been reported in the literature. Among them, the statistical measurement methods calculate simple statistical properties (e.g. first order parameters) or sophisticated properties (e.g. co-occurrence matrices [1] or gray level run length [2]) of image. Other texture feature extraction approaches are based on models (Markova random field and fractals [3]), mathematical morphology [4] or classical transform methods (Fourier, Gabor, wavelet transform [5]). These texture analysis methods have been applied to image segmentation and disease detection.
Manuscript received April 22, 2010. This work was supported by the National Natural Science Foundation of China under Grant 60911130370 and the National Basic Research Program of China under Grant 2010CB732503. It has been realized thanks to the French-Chinese cooperation framework associating SouthEast University, Inserm and the University of Rennes 1.
Ke Wu and Huazhong Shu are with the Laboratory of Image Science and Technology, Department of Computer Science and Engineering, Southeast University, and also with Centre de Recherche en Information Biomédicale Sino-Français (CRIBs), 210096 Nanjing, China (e-mail: wukehello@gmail.com, shu.list@seu.edu.cn).
Carole Garnier and Jean-Louis Coatrieux are with the INSERM U642, 35000 Rennes, France, with Laboratoire Traitement du Signal et de l’Image, Université de Rennes I, 35000 Rennes, France, and also with Centre de Recherche en Information Biomédicale Sino-Français (CRIBs), 35000 Rennes, France (e-mail: carole.garnier@univ-rennes1.fr, jean-louis.coatrieux@univ-rennes1.fr).
In this paper, we propose a moment-based approach for medical texture analysis. Moments are statistical measures used to obtain the relevant information of an object. Since Hu introduced moments in image analysis [6], moment functions are widely applied in many scientific areas. In 1994, Tuceryan discussed texture feature extraction and texture analysis based on geometric moment [7]. Begum applied the complex moments to texture segmentation [8]. However, both geometric moments and complex moments contain redundant information and are sensitive to noise. This is due to the fact that the kernel polynomials are not orthogonal. Teague suggested the use of orthogonal moments such as Legendre moment and Zernike moment [9]. Mukundan introduced the discrete Tchebichef moments [12]. Yap presented another set of discrete moments known as Krawtchouk moments [13]. The medical image texture analysis based on the orthogonal moments is discussed in this paper.
The organization of the paper is as follows. In section 2, we review the definition of moments. Then we give the details of moment-based texture feature extraction. In section 3, the proposed method is applied to texture analysis from Brodatz database. And a classifier is proposed to evaluate feature characterization. The characterization of moments is evaluated. Then we apply the method to real medical image. The discussion is provided in section 4.
II. METHOD
A. Definition of moments
Legendre moment
The (n+m)th order of Legendre moment, Lnm, is defined as [9] 1 1 1 1 (2 1)(2 1) ( ) ( ) ( , ) 4 nm n m n m L P x P y f x y dxdy
, (1)I
where Pn(x) is the nth order of Legendre polynomial given by / 2 2 0 1 (2 2 )! ( ) ( 1) !( )!( 2 )! 2 n k n n n k n k P x x k n k n k
k. (2) Zernike momentThe 2D Zernike moments, Znm, of order n with repetition m, are defined in polar coordinates (r, q) inside the unit circle as [9] 1 2 0 0 1 ( ) jm ( , ) nm nm n Z R r e f r rdrd
0 |m| n, n – |m| is even, (3)where Rnm(r) is the nth order of Zernike radial polynomial given by ( )/ 2 2 0 ( )! ( ) ( 1) ! ( 2 ) / 2 ! ( 2 ) / 2 ! n m k nm k n k R r r k n k m n k m
n k (4) Tchebichef momentsFor a digital image f(x, y) with size NN, the (n+m)th order Tchebichef moments are defined as [4]
1 1 0 0 1 ( ) ( ) ( , ) ( , ) ( , ) N N nm n m x y T t x n N m N
t y f x y , (5)where the scaled Tchebichef polynomials { ( are given by )} n t x ( ) ( ) ( , ) n n t x t x n N (6) 3 2 ( ) (1 ) ( , ,1 ;1,1 ;1) n n t x N F n x n N (7) 2 ( , ) ( , ) ( , ) n N n N n N , ( , ) (2 )! (8) 2 1 N n n N n n
Here, (n, N) is a suitable constant which is independent of
x and 3F2( ) is the hypergeometric function defined as
1 2 3 3 2 1 2 3 1 2 0 1 2 ( ) ( ) ( ) ( , , ; , ; ) ( ) ( ) ! k k k k k k k a a a z F a a a b b z b b k
(9)with (a)k the Pochhammer symbol given by
( ) ( ) ( 1) ( 1) ( ) k a k a a a a k a (10) Krawtchouk moment
The Krawtchouk moment of order (n+m) of an image f(x, y) with size NN is defined as [15]
1 1 1 2 0 0 ( ; , 1) ( ; , 1) ( , ) N N nm n m x y Q K x p N K y p N f
x y (11)where the set of weighted Krawtchouk polynomials {K x p Nn( ; , )} is defined by ( ; , ) ( ; , ) ( ; , ) ( ; , ) n n w x p N K x p N K x p N n p N (12) 2 1 ( ; , ) ( , ; ;1/ ) n K x p N F n x N p , 0 x, n N – 1. (13) ( ; , ) N x(1 )N x w x p N p p x , 0 < p < 1, (14) 1 ( ; , ) ( 1) ( ) n n n p n n p N p N ! (15) Here, 2 1F( ) is the hypergeometric function defined as
2 1 0 ( ) ( ) ( , ; ; ) ( ) ! k k k k k a b z F a b c z c k
(16)B. Texture feature extraction and classification
In our work, texture features are extracted by computing the moments in neighborhood of each pixel. Small NN local windows around pixel are taken for computation. The size N of is important in feature extraction. As the window size increases, more global features are detected. So the choice of the window size should be tied to the contents of image.
Because Legendre and Zernike moments are defined on [-1,1], the image must be transformed to this range. However, such a process is not required for Tchebichef moments and Krawtchouk moments.
The moments of order up to four are respectively calculated by (1), (3) (5) and (11) to get texture parameters. For each moment, texture features consist of 15 parameters for texture characterization.
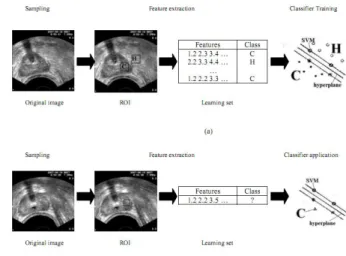
The first step in applying any classification is preparation of the learning set, which will be used to generate the classifier. The learning set is created from some samples which are labeled by our priori knowledge. When the classifier is built it can be applied in prediction of new samples. Figure 1 presents the schematic process of classifier induction based on previously described samples. For a sample image, the ROIs from texture 1 and texture 2 are labeled before classification. Then the sets of texture parameters that will create feature vectors of a learning set are calculated for texture characterization of each ROI. Finally, the classifier is induced from the learning set composed of the labeled feature vectors. After its generation, the classifier can be used in recognition of unknown texture regions. For a given texture image, a ROI is traced but now the class of the concerned ROI is not known. The same set of features as it
Fig. 1. The overall process. (a) classifier training, (b) classifier application.
was utilized during the process of classifier induction is then calculated for this image region. Applying a set of previously generated classifiers allows us to make a decision and associate one of the classes with the analyzed ROI.
In our work, support vector machine (SVM) is chosen as classifier for texture characterization. The purpose of SVM is to find an optimal separating hyper plane by maximizing the margin between the separating hyper plane and the features. More details of SVM can be found in [14]. Features of class labeled texture ROIs are entered to SVM for training. After that, the features of unknown textures can be characterized
III. EXPERIMENTAL RESULTS
A. Moment-based texture analysis for Brodatz texture
Before considering medical image data, the proposed moment-based algorithm has been tested on the Brodatz database. Nine 256×256 images with very different patterns have been selected: D1, D11, D84, D57, D112, D8, D15, D4, and D9. They were analyzed by pairs. These images were decomposed into non-overlapping windows (with size going from 5 to 15) onto which the 15 moment coefficients were computed. 800 samples have been randomly selected to build the SVM training set, 2000 of the remaining ones being used for estimating the performance of the method. The results show that the classification rates, for the whole moments described above, are higher than 95% in all cases.
In order to prove the efficiency of moments for texture characterization, we needed image data sets for which a reference is available in the literature. We selected a work published in [13] and more detailed in [14] to carry out this study: it concerns CT images of the liver at different contrast medium injection phases (i.e. multiphase CT). We also completed this analysis by adding a second example on the segmentation of ultrasound images of the prostate.
B. Moment-based texture analysis on liver CT images
The approach reported in [14] was based on various sets of texture parameters such as Run-Length Matrix, Co-occurrence and Laws’ filters. We applied our moment-based approach by following the same experimental conditions. For each tissue type (normal liver, hepato-carcinoma and cholangiocarcinoma confirmed by a histopathological analysis) and each acquisition phase (non-enhanced images and, after contrast product injection, in arterial and portal phases), 150 ROIs from 13 different patients have been chosen. The four above moments were used as previously for texture feature extraction. The window size is chosen as 21. Four experiments have been conducted for each of the aforementioned sets of features. In the first three ones, feature vectors corresponding to three acquisition phases (N, A, P) were analyzed separately. In the last one, “multiphase” feature vectors (created from three regions of interest corresponding to the three images in subsequent acquisition instants) were analyzed simultaneously. The texture features were classified by Support Vector Machine
(SVM). The learning sets used for classifier induction were composed of 75 observations corresponding to each acquisition phase (225 observations in total). Test sets of equal number of feature vectors were used for the validation. The training ROIs and testing ROIs are from different patients. The results are summarized in TABLE I. They show that the classification performance is rather high. The classification rate achieved by using moments is higher than the best result reported in [14]. It also confirms not only the capability to discriminate between normal and pathological tissues but also the interest to use multiphase CT.
TABLEI
CLASSIFICATION RATES FOR NON-ENHANCED, ARTERIAL AND PORTAL
PHASE OBTAINED WITH THE DIFFERENT MOMENTS.
no contrast (N) arterial phase (A) portal phase (P) N + A + P Legendre 94.11% 92.22% 90.78% 97.67% Zernike 92.89% 91.89% 91.67% 98.55% Krawtchouk 94.78% 89.89% 90.33% 98.67% Tchebichef 91.78% 90.78% 90.33% 94.33% all above mixed 93.67% 92.33% 92.22% 98.67%
C. Moment-based texture analysis for ultrasound image
The prostate images have been acquired on the Ablatherm High Intensity Focused Ultrasound (HIFU) device. The pixel is 0.154×0.15 mm2 and the size of the images size
corresponds to 500×490 pixels. Two images selected among different patients and different plane positions have been used and the window size was set to 15.
The results displayed in Figure 2 have been obtained by using a multi-channel active contour model for segmentation [15]. An initial contour is given by interpolating four edge points of the prostate defined by a radiologist. Then, the moments are used for texture extraction. All these features are entered into the model without edge information. A level-set
(a)
(b)
(c)
Fig. 2. (a) Examples of original images (sets 1 and 2) with expert contours, (b) and (c) Contours of set 1 and set 2 respectively, obtained with Legendre, Zernike, Krawtchouk and Tchebichef moments
m
method is then applied to compute the contour evolution. A detailed description of this method can be found in [16].
Three standard area-based metrics have been defined based on the true positive (TP) area (the common region between the manual outline and the algorithm outline), the false positive (FP) area (the region enclosed by the algorithm outline but outside of the manual outline) and the false negative (FN) area (the region enclosed by the manual outline that is missed by the algorithm).
They are fractional area difference (FAD): / d d P A A , (17) sensitivity: / s m C TP A , (18) and accuracy: 1 ( ) / a C FP FN Am (19) Here, the area enclosed by the manual outline is
m
A TP FN , (20) and the area difference is
( ) ( )
d
A TP FP TP FN FP FN . (21) The results are shown in TABLE II.
IV. DISCUSSION
Our objective in this paper was to show that moment-based texture characterization could bring some positive cues to tissue discrimination. The first example confirms that moments can offer high performance and compare well with previous attempts. The second example, however, deals with a much more complex problem. The ultrasound images are highly non-stationary, inside and outside the prostate, and the boundaries at the extremities are badly defined. In those areas, the moment features do not provide enough relevant information to obtain a precise prostate segmentation. We performed other studies not reported here on MRI data sets [17] for which no improvement was observed in comparison to classical methods. As mentioned above, a few important points have to be considered and in particular the window size and the moment order. They have not been addressed here due to space limitations.
V. CONCLUSIONS
In this paper, a moment-based texture analysis method is introduced in medical images. Texture features are extracted by calculating moments in texture pixel neighborhood. Their
capability to discriminate different textures has been verified on Brodatz textures. The method is applied to liver tumor recognition and prostate image segmentation. It has been shown that high performance can be achieved on multiphase CT images of the liver and ultrasound prostate images by using different families of moments. Although more experiments are required to assess their general interest in medical imaging, we think that they offer a sound alternative to the well established methods applied up to now.
ACKNOWLEDGMENT
The authors are indebted to J Bezy and to EDAP-TMS for providing the data sets used in this study.
REFERENCES
[1] H. Peckinpaugh, “An improved method for computing gray-level Cooccurrence Matrix based texture measures,” CVGIP, Graphical
Models and Image Processing, vol. 53, pp. 574-580, Nov. 1991.
[2] V. Dasarathy and B. Holder, “Image characterizations based on joint gray level-run length distribution,” Pattern Recognition Letters, vol. 12, pp. 497-502, Aug. 1991.
[3] B. B. Mandelbort, The fractal geometry of natural. San Fransisco: Freeman, 1984.
[4] J. Serra, “Introduction to mathematical morphology.” Computer Vision,
Graphics and Image Processing, vol. 35, pp. 283-305, Sept. 1986.
TABLEII
FAD, SENSITIVITY AND ACCURACY TEXTURE SEGMENTATION RESULTS
FAD (%) Sensitivity (%) Accuracy (%) Set1 Set2 Set1 Set2 Set1 Set2
Legendre -5.10 4.24 93.46 94.81 92.04 85.37
Zernike -6.24 2.43 91.78 93.43 89.79 84.42
Krawtchouk -5.00 4.20 94.17 94.74 93.34 85.28
Tchebichef -6.24 2.46 91.79 93.45 89.82 84.45
[5] S.G. Mallat, “A theory for mulitresolution signal decomposition: the wavelet representation”. IEEE Trans. On Pattern analysis and machine
Intelligence, vol. 11(7), pp. 674-693, July. 1989.
[6] M. K. Hu, “Visual pattern recognize by moment invariants,” IRE Trans
on Information Theory, vol. 8(1), pp.179-187, 1962.
[7] M. Tuceryan, “Moment based texture segmentation,” Pattern
Recognize Letters, vol. 15(7), pp. 659-668, July. 1994.
[8] J. Bigun, “N-folded symmetrics by complex moments in Gabor space and their application to unsupervised texture segmentation,” IEEE
Trans on Pattern Analysis and Machine Intelligence, vol. 16(1), pp.
80-87, Jan. 1994.
[9] M. R. Teague, “Image analysis via the general theory of moments,”
Journal of the Optical Society of America, vol. 70(8), pp. 920-930, Aug,
1980.
[10] R. Mukundan, S. H. Ong and P. A. Lee, “Image analysis by Tchebichef moment.” IEEE Trans Image Processing, vol. 10(9), pp. 1357-1364, 2001.
[11] P. T. Yap, P. Raveendran and S. H. Ong, “Image analysis by Krawtchouk moments,” IEEE Transactions on Image Processing, vol. 12(11), pp.1367-1377, 2003.
[12] R. G. Steve, “Support Vector Machines for Classification and Regression,” Faculty of Engineering and Applied Science Department of Electronics and Computer Science, University of Southampton, Tech. Rep, May, 1998.
[13] D. Duda, M. Kretowski and J. Bezy-Wendling, “Texture-Based Classification of Hepatic Primary Tumors in Multiphase CT,” Medical
Image Computing and Computer-assisted Intervention Proceedings,
Part 2, 2004.
[14] D. Duda, M. Kretowski and J. Bezy-Wendling, “Texture Characterization for Hepatic Tumor Recognition in Multiphase CT,”
Biocybernetics and Biomedical Engineering, vol. 26, no. 4, pp.15-24,
2006.
[15] B. Sandberg, T. Chan and L. Vese, “A Level-Set and Gabor-based Active Contour Algorithm for Segmenting Textured Images,” UCLA Department of Mathematics CAM report, 2002.
[16] T. F. Chan, L. A. Vese, “Active Contours without Edges,” IEEE
transactions on image processing, vol. 10(2), pp.266-277, 2001.
[17] D. Mahmoud-Ghoneim, M. K. Alkaabi, J. D. de Certaines and F. M. Goettsche, “The impact of image dynamic range on texture classification of brain white matter,” BMC Med Imaging, vol.8(18), Dec, 2008.