HAL Id: inserm-02510466
https://www.hal.inserm.fr/inserm-02510466
Submitted on 17 Mar 2020
HAL is a multi-disciplinary open access
archive for the deposit and dissemination of
sci-entific research documents, whether they are
pub-lished or not. The documents may come from
teaching and research institutions in France or
abroad, or from public or private research centers.
L’archive ouverte pluridisciplinaire HAL, est
destinée au dépôt et à la diffusion de documents
scientifiques de niveau recherche, publiés ou non,
émanant des établissements d’enseignement et de
recherche français ou étrangers, des laboratoires
publics ou privés.
Identification of Novel Human Monocyte Subsets and
Evidence for Phenotypic Groups Defined by
Interindividual Variations of Expression of Adhesion
Molecules
F. Merah-Mourah, Shannon Cohen, Dominique Charron, N. Mooney, Alain
Haziot
To cite this version:
F. Merah-Mourah, Shannon Cohen, Dominique Charron, N. Mooney, Alain Haziot. Identification
of Novel Human Monocyte Subsets and Evidence for Phenotypic Groups Defined by Interindividual
Variations of Expression of Adhesion Molecules. Scientific Reports, Nature Publishing Group, 2020,
10 (1), pp.4397. �10.1038/s41598-020-61022-1�. �inserm-02510466�
Identification of Novel Human
Monocyte Subsets and Evidence
for Phenotypic Groups Defined
by Interindividual Variations of
Expression of Adhesion Molecules
F. Merah-Mourah
1,2, S. O. cohen
1,2, D. charron
1,2, N. Mooney
1,2& A. Haziot
1,2*Monocytes contribute to immune responses as a source for subsets of dendritic cells and macrophages. Human blood monocytes are classified as classical, non-classical and intermediate cells. However, the particular functions of these subsets have been hard to define, with conflicting results and significant overlaps. One likely reason for these ambiguities is in the heterogeneity of these monocyte subsets regrouping cells with divergent functions. To better define monocyte populations, we have analysed expression of 17 markers by multicolour flow cytometry in samples obtained from 28 control donors. Data acquisition was tailored to detect populations present at low frequencies. Our results reveal the existence of novel monocyte subsets detected as larger CD14+ cells that were CD16+ or CD16neg. These large monocytes differed from regular, smaller monocytes with respect to expression of various cell surface molecules, such as FcR, chemokine receptors, and adhesion molecules. Unsupervised multidimensional analysis confirmed the existence of large monocytes and revealed interindividual variations that were grouped according to unique patterns of expression of adhesion molecules CD62L, CD49d, and CD43. Distinct inflammatory responses to TLR agonists were found in small and large monocytes. Overall, refining the definition of monocyte subsets should lead to the identification of populations with specific functions.
Monocytes, which are mostly precursors of some macrophage and dendritic cell populations, have been hard to divide into populations with clear-cut inflammatory and immune functions. This may be due in part to the high number and complexity of phenotypes present in monocyte populations.
A classification of human blood monocyte subsets based on the expression of CD14 and CD16 cell surface receptors was proposed1 and refined over the years2,3. It consisted initially of two populations described as
“clas-sical” monocytes, which express CD14 but no CD16, and “nonclas“clas-sical” monocytes with low CD14 and strong CD16 expression. Further analysis identified CD14+CD16+ monocytes with expression of CCR5 and
interme-diate expression of receptors divergently expressed in the two other subsets (e.g. CCR2 and CX3CR14. This
addi-tional subset was identified as “intermediate”5. Evidence for this third subset was confirmed in transcriptome
analysis6–10.
Despite progress in phenotypic analysis, immune functions associated with monocyte subpopulations in the steady state remained ill defined. Marked functional redundancies between the sub-populations were found, and contradicting results in the literature added to the puzzling difficulties in assigning functions to specific popu-lations11–13. Thus, intermediate monocytes were described as the major source of pro-inflammatory cytokines
upon stimulation14,15. In contrast, non-classical monocytes were also described as the most inflammatory
mono-cytes3,13,16. Similarly, anti-inflammatory cytokine secretion was alternatively found high in intermediate13 or in
classical monocytes6,11,17.
Therefore, production of pro-inflammatory and anti-inflammatory cytokines upon activation, a hallmark property of monocytes, remains hard to ascribe unambiguously to given subsets.
1INSERM U976, Hôpital Saint-Louis, Paris, France. 2Institut de Recherche Saint-Louis, Université Paris-Diderot, Paris,
France. *email: [email protected]
www.nature.com/scientificreports
www.nature.com/scientificreports/
In this study, we stringently assessed the phenotypic heterogeneity of human blood monocytes by multicolour cell surface labelling, flow cytometry analysis, and unsupervised detection of clusters and analysis of their phe-notypes. To look for conserved phenotypes, the analysis was extended to 28 healthy Caucasian donors. Results identified novel populations of monocytes with unique morphologic and phenotypic characteristics, and with distinct inflammatory responses to TLR agonists. Although monocyte populations had heterogeneous pheno-types among healthy donors they could nonetheless be resolved into phenotypic groups based on interindividual variations of expression.
Results
Identification of populations of monocytes in human healthy donors.
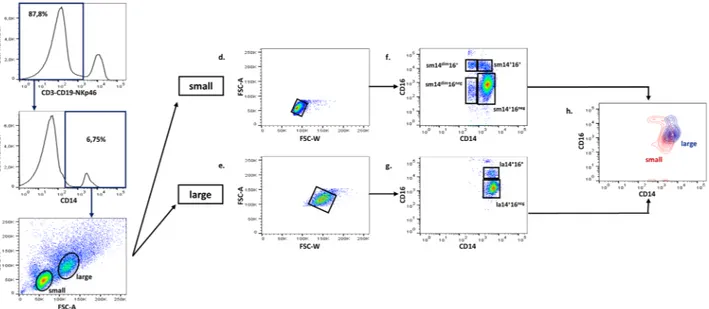
In order to further define human blood monocyte populations, we have analysed labelled PBMC from 28 healthy individuals by flow cytometry (Supplementary Table S1). Settings, which were chosen to achieve a comprehensive study of monocyte populations, included an optimized procedure to reduce non-specific labelling, the acquisition of 1 × 10⁶ eventsto analyse rare populations, and the exclusion of non-myeloid cell lineages (CD3+, CD19+, and NKp46+ (CD335)
cells) as initial step (Fig. 1a). CD14 expression was considered a necessary condition for inclusion in monocyte populations (Fig. 1b). In PBMC analysed in these conditions, CD14+ cells formed two main clusters
accord-ing to their size and granularity, as shown in Fig. 1c. In addition to a main cluster representing 78.4 ± 14.0% (mean ± SD, n = 28) of CD14+ cells and appearing to correspond to the commonly defined monocyte population,
a distinct cell population was identified. This clearly visible set of larger cells was present in all donors and consti-tuted 8.8 ± 6.0% of CD14+ cells. Cells in this cluster were named large monocytes (la) in contrast to the denser set
of smaller CD14+ cells, thus named small monocytes (sm). After exclusion of doublets in each subset (Fig. 1d,e),
the expressions of CD14 and CD16 were analysed in these two populations. To show that large monocytes did not result from density gradient separation with Ficoll, monocytes were analysed in whole blood. After exclusion of lymphocytes and granulocytes, small and large monocyte populations were clearly identified in CD14+ cells
(Supplementary Fig. S1).
In CD14/CD16 plots, small monocytes were divided into four populations (Fig. 1f). A major CD14+/CD16neg
population consisted of 77.2 ± 13.0% of this cell cluster and were named sm14+16neg. Populations of CD14+/
CD16+ cells (4.4 ± 2.3%) named sm14+16+, and of CD14dim/CD16+ cells (3.2 ± 2.6%) named sm14dim16+ were
also identified in all donors. A fourth population of CD14dim/CD16neg cells named sm14dim16neg was identified in
16 out of 28 donors where it represented 2.4 ± 1.5% of small monocytes.
Large monocytes (Fig. 1g) were divided in two populations, a CD14+/CD16neg population representing
79.2 ± 10.0% of large monocytes and named la14+16neg, and a CD14+/CD16+ population (10.0 ± 5.2%) named
la14+16+. Thus, this newly described set of large monocytes differed from small monocytes with respect to FSC
scatter and levels of CD14 expression.
Figure 1. Gating strategy and identification of monocyte subpopulations. PBMC were separated and stained
with antibodies directed at various cell surface molecules (Supplementary Table S2). Lineage markers were used to exclude lymphocyte subsets (a) and CD14+ cells were selected (b). Forward and side scatter identified small and large clusters of monocytes (c). After exclusion of doublets from each cluster49 (d,e), the expressions of
CD14 and CD16 were analysed in gated cells (f,g). The higher expression of CD14 in large monocytes is shown in panel h where the profiles of CD14 and CD16 expressions in large (blue contours) and small monocytes (red contours) were overlaid. A substantial part of la14+16neg monocytes had a higher CD14 expression
than sm14+16neg cells, and almost all la14+16+ monocytes expressed more CD14 than sm14+16+ cells. Data
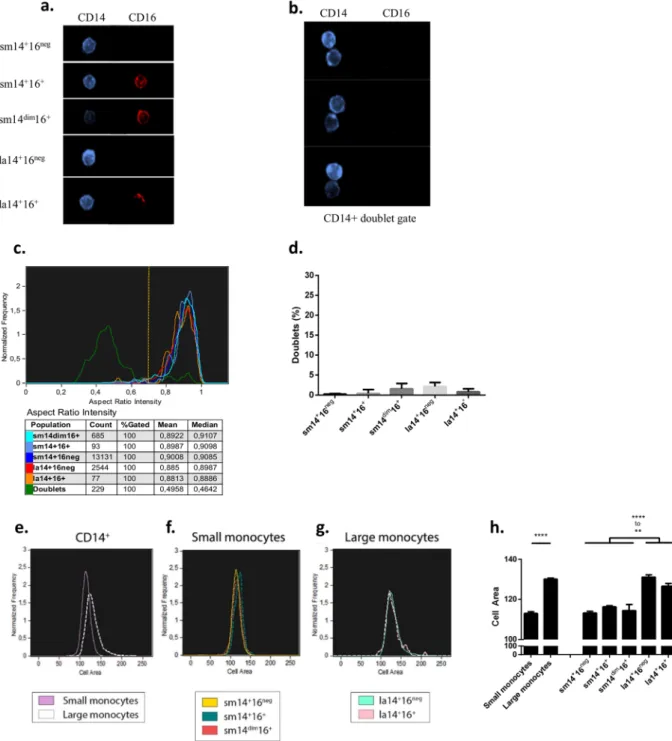
To dismiss the possibility that large monocytes were doublets, PBMC were analysed by imaging flow cytome-try. Large monocytes appeared as single cells (Fig. 2a) and shape analysis of cells in large monocyte gates showed that over 95% of the cells were spheroids in contrast to oblong objects present in doublet gate (Fig. 2b,c). Cell size was also analysed in imaging flow cytometry using a mask delimited by CD14 expression. Results showed that large monocytes had a significantly larger size than small monocytes (Fig. 2e,h). Cell diameters were inferred from cell size and were determined to be 12.84 microns for large monocytes and significantly larger than small monocytes that had a diameter of 11.98 microns (Supplementary Fig. S2).
Therefore, a total of six populations of monocytes were distinguished according to our gating strategy based on sequential use of lineage selection, SSC and FSC cluster analysis, doublet exclusion in gated monocyte popu-lations, and levels of CD14 and CD16 expression.
Phenotypic characterization of each newly defined populations of monocytes.
To further char-acterize the identified monocyte populations, the expression of 15 cell surface receptors associated with impor-tant functions of monocytes was analysed in cells obtained from our panel of 28 donors. Thus, in addition to exclusion markers for lymphocyte populations (CD3, CD19, NKp46), monocyte population markers CD14, a LPS co-receptor18, and CD16, the Fc receptor FcRIII1, other markers analysed included chemokine receptors, CCR2,CX3CR1, and CCR5, that have been instrumental in distinguishing classical, non-classical and intermediate monocytes16, Fc receptors FcRI/CD64 and FcRII/CD32, antigen presentation molecule HLA-DR and
co-stimulation molecules CD80 and CD86, as well as adhesion molecules CD62L/L-selectin, CD162/P-selectin ligand, CD43/leukosialin, CD49d/VLA-4, and CD56/N-CAM. The expressions of the scavenger receptor CD16319,20 and the immunoglobulin superfamily CD7 molecule21 were also determined. Marker expression for
each of the six monocyte populations is presented in individual panels (Fig. 3a–f). The results confirm the widely shown preferential expression of CCR2 and CX3CR1 in CD16neg (Fig. 3a,b,f) and CD16+ (Fig. 3c,d,e) monocytes,
respectively22. Differences of expression between monocyte populations were identified, with higher expression
of antigen presentation molecules HLA-DR (MFI) and CD86 (percent of positives) in la14+16neg compared to
sm14+16neg (Fig. 3a,b), higher intensity of expression of adhesion molecules CD49d, CD162, and CD62L in
la14+16+ compared to sm14+16+ (Fig. 3d,e). A globally lower expression of most markers characterized sm14
dim-16neg monocytes (Fig. 3f). Individual variation between donors was however one of the salient feature of the
analysis of expression for many markers. Remarkably, similar variations were identified in donors, which were unrelated, allowing the identification of groups among our panel of Caucasian donors. In sm14+16neg monocytes
(Fig. 3a), 15 out of the 28 donors had a high percentage of monocytes positive for CD49d and CD162 (CD49dhi
and CD162hi) with a MFI in the bright to medium range (CD49d , CD162
bri med hi
bri med hi
/ / ). Among this group, two
donors were set apart based on CD62Lmedhi expression defining profile OP-02, and three others were distinguished
according to a CD43dimlo expression (OP-03). The remainder was named OP-01. Similarly, a second group of five
donors was individualized based on a CD49dmedint and CD43dim phenotype, a profile named OP-04. A final group
of three donors (OP-05) was identified with the common phenotype CD49dmedint lo/ and CD43med dim/ . In these two
last groups, a CD162 and CD62Lbrihi brihi expression was found. Five donors from this panel could not be categorized
along a unique phenotype.
Similarly, the other monocyte populations could also be split according to the patterns of expression of adhe-sion molecules. Among large monocytes, la14+16neg monocytes (n = 28) (Fig. 3b) were distinct from their
CD16neg counterpart sm14+16neg monocytes (Fig. 3a) in their overall stronger expression of several cell surface
molecules (CD163, HLA-DR, CD86, CX3CR1, and CCR2). In contrast, adhesion molecules CD162 and CD62L were in general similarly expressed in la14+16neg and sm14+16neg. Several groups of donors were defined in
la14+16neg monocytes according to the expression of adhesion molecules CD49d and CD43 with a
CD49d , CD43brihi dim hi phenotype (n = 8), a CD49d , CD43 bri med hi med dim hi / / phenotype (n = 10), and a
CD49d , CD43brihi dimint phenotype (n = 3), and were named OP-10, OP-11, and OP-12, respectively. In 7 donors,
atypical profiles with CD43brihi (n = 2), CD43neg (n = 3), and CD49dmed dimint hi// , CD43dimint hi/ (n = 2) were found.
In sm14+16+ monocytes (Fig. 3c), the expression of CD49d and CD162 was relatively conserved among most
of the donors with a large majority of donors (20 out of 26) phenotyped as CD49dbri medhi/ andCD162bri medhi/ .
Among these, three profiles could be identified according to CD43 and CD62L expression with the following phenotypes CD43dimhi and CD62Lmedhi (n = 7) with a low level of CCR5 expression in some donors, CD43medhi
(n = 10), and CD43 , and CD62Ldimhi variable
hi (n = 3). These profiles were named OP-20, OP-21, and OP-22. Six
donors had distinct patterns of expressions of these markers and were not grouped.
la14+16+ monocytes (n = 23) (Fig. 3d) differed from sm14+16+ monocytes (Fig. 3c) with a stronger
expres-sion of adheexpres-sion molecules CD49d, CD162, and CD62L, and of CD163, and a brighter expresexpres-sion of CCR2 when expressed. Donors were grouped based on expression of adhesion molecules CD49d and CD43 with a CD49d , CD43brihi dimhi group (n = 6), a CD49d , CD43brihi himed group (n = 7), a CD49dbri medhi/ , CD43med dimhi / group
(n = 5), and a CD49d , CD43brihi bri
hi group (n = 3). These groups were termed OP-30 to OP-33. Two donors with
atypical combinations of expression of adhesion molecules were left ungrouped (numbers 26 and 28).
Less individual variability with respect to adhesion molecules was detected in sm14dim16+ monocytes (n = 23)
(Fig. 3e). A fairly consistent expression of CD49d, CD162, as well as HLA-DR, and CX3CR1 was found in these cells with the exception of four donors (on the right side of the figure) with lower expression of CD49d and/or CX3CR1. Two main patterns named OP-40 and OP-41 were identified with a CD49d , CD43 , and CD162brihi
dim hi
bri hi
phenotype (n = 9) in which varying degrees of CD62L expression were distinguished, and a CD49d , CD43brihi medhi
phenotype (n = 10) including 7 donors characterized as CD162 and CD62Lbrihi medhi . Four donors had a
CD49d , CD162inthi bri int hi
www.nature.com/scientificreports
www.nature.com/scientificreports/
Figure 2. Imaging flow cytometry analysis of monocyte subpopulations. PBMC (n = 5) were stained and
analysed by imaging flow cytometry (ImageStream, Amnis). After exclusion of lymphocytes, selection of CD14-positive cells, and doublet exclusion, small and large monocytes were visualized. (a) Representative images of small and large monocytes. (b) Representative images of cells in the CD14+ doublet gate. (c) Shape analysis of
all events in small and large monocyte gates and in doublet gate using the aspect ratio feature (IDEAS software) in a representative donor. The ratio between the minor and major axis of each event in monocyte gates was calculated and compared to the corresponding ratio of cells in the doublet gate. A vertical bar drawn at the nadir between singlet and doublet curves (Aspect Ratio Intensity around 0.7) served as threshold to quantify singlets and doublets in each population. (d) Quantification of doublets present in gates used to define small and large monocyte subpopulations, calculated as events located left of the threshold bar drawn in panel c (mean ± s.d.) and expressed as percent of cells in the gate; doublets represented less than 5% of the cells in large monocyte gates, a percentage similar to that of small monocyte gates. (e) Cell size was determined using Area Feature (IDEAS software) with a mask delimited by CD14 expression in small and large monocytes, (f) in small monocyte subpopulations, and (g) in large monocytes subpopulations from a representative donor. (h) quantification of cell sizes for each subpopulation in 5 donors; sm14+16neg, sm14+16+, and sm14dim16+
monocytes had a similar size distribution, and large monocyte subpopulations la14+16neg and la14+16+ had also
The sm14dim16neg monocyte population (Fig. 3f) could be analysed in 16 donors only, due to its varying
pres-ence among monocyte populations. Profiles of expression in this population were strikingly different from its CD16+ counterpart, sm14dim16+ monocytes (Fig. 3e) with low expression of adhesion molecules CD49d, CD162,
CD62L and of chemokine receptor CX3CR1. Remarkably, HLA-DR was similarly expressed but this expression was coupled with scant CD86 expression in most donors. Groups were defined along expression of CD49d and CD62L with 5 donors characterized as CD49d , CD62Lmedhi
dim
int lo/ , and six donors as CD49d , CD62L
med int lo
med hi int
/ /
named OP-50 and OP-51, respectively. Five donors remained without classification.
From these results, it appears that variations in the expression of selected markers (CD49d, CD43, CD162, and CD62L) did not occur randomly in the monocyte subpopulations and may correspond to a concerted profile of gene expression.
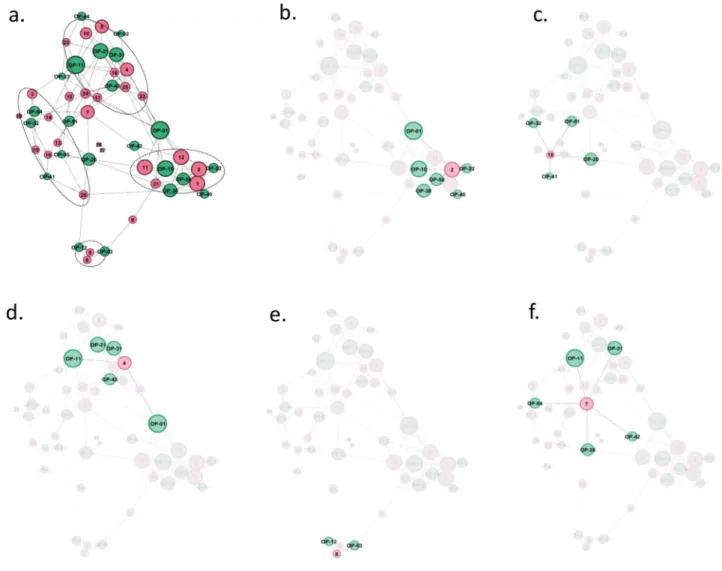
In an attempt to further define monocyte phenotypes across the sub-populations, we set out to determine which profiles detected in small and large monocytes were more likely to be associated in healthy donors. We used the network analysis tool Gephi23,24 to map the connectivity between profiles OP-01 to OP-51 based on the
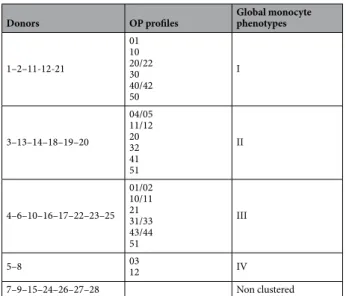
28 donors analysed. As shown in Fig. 4, OP profiles formed clusters based on relations to profiles found in each donor. Four clusters were identified. They consisted of profiles from each monocyte sub-populations that are more likely to be associated in a whole monocyte population (Table 1). Overall, identification of these monocyte phenotypes in donors further reinforces the notion that monocyte expression of adhesion molecules best reflects the phenotypes of these cells in subsets within subpopulations.
We then looked for associations between Gephi-defined clusters and donor characteristics such as age and sex. Interestingly, as shown in Supplementary Fig. S3, although the numbers were relatively small in each cluster, subjects in cluster III were older than subjects in cluster I (mean ± sd 51.6 ± 13.4 vs. 34.4 ± 9.5 years). The dif-ference was statistically significant (p = 0.045, Mann-Whitney U test). No other age difdif-ference between clusters
Figure 3. Phenotypes of monocyte subpopulations as analysed with our typing platform. PBMC from
28 donors were separated and stained with antibodies directed at various cell surface receptors such as Ig FcR (CD64 and CD32 in addition to CD16), chemokine receptors (CCR2, CCR5, and CX3CR1), antigen presentation and co-stimulatory molecules (HLA-DR, CD86, and CD80), adhesion molecules (CD62L, CD162, CD43, CD49d, and CD56). The expressions of scavenger receptor CD16319,20 and immunoglobulin superfamily
molecule CD721 were also determined (y-axis and Supplementary Table S2). Cells were analysed as described
in Fig. 1. Fluorochrome-matched isotype controls were used to determine specific MFI and percentage of positive cells. Expression levels are presented as dots of colour and size reflecting MFI and percentage of positive cells, respectively, according to colour and size scales shown in legend. Monocytes subsets: (a) sm14+16neg,
(b) la14+16neg, (c) sm14+16+, (d) la14+16+, (e) sm14dim16+ and (f) sm14dim16neg. Variations in the number of
donors analysed in each monocyte population were due to the inability to assess the expression of markers when cell numbers were too low. For each sub-population, donors were grouped according to similar expression of markers as noted at the top of the panels and recapitulated with the OP nomenclature at the bottom of the panels.
www.nature.com/scientificreports
www.nature.com/scientificreports/
reached statistical significance. Sex ratios in most clusters were unremarkable (Supplementary Fig. S4). However, in cluster I females were underrepresented and males were overrepresented compared to the parent population 98% confidence interval. These results suggest that age and sex may be contributing factors in the variations of monocyte phenotypes.
Identification of clusters of defined phenotypes within monocyte populations.
Having estab-lished the overall expression of selected markers in newly defined monocyte populations, we sought to analyse the combined expression of the markers at a single cell level and to identify cell clusters with similar profiles of expression in an unsupervised manner. We used SPADE, a hierarchical analysis generating branched tree struc-ture of related cells, followed by analysis with viSNE, which allows visualization of high-dimensional single-cell data.Figure 4. Connectivity map between donors and defined phenotypic profiles. To determine which phenotypic
profiles identified in subpopulations of monocytes were more likely to be associated in a given donor, a network analysis was performed using Gephi23. Green dots represent phenotypic profiles (OP, Fig. 3) and pink dots
represent donors. The size of the dots is proportional to the number of links. (a) Complete network with ovals around clustered donors as listed in Table 1; (b–e) one donor representative of each cluster with links to corresponding phenotypic profiles; (f) one non-clustered donor. Thus, monocyte phenotype I was composed of profiles OP-01, -10, -22 or -20, -30, -40 or -42, and -50 and was present in 5 donors (see Table 1). In monocyte phenotype II, no profile was strongly associated with la14+16neg monocytes, with donors 3 and 14 having profile
OP-11, donor 20 having profile OP-12, and donors 13, 18, and 19 having no characteristic la14+16neg profile.
However, in other monocyte sub-populations, these donors shared profiles OP-04 or -05, -20, -32, -41, and -51. Monocyte phenotype III included profiles OP-01 or -02, -11, -21, -31, and -43 or -44 with however some divergence in donors 22 (with OP-33), 23 and 25 (with OP-10). Donors 17 and 25 had profile OP-51 in sub-population sm14dim16neg whereas no other donor had distinctive profiles in this sub-population. Monocyte
phenotype IV was much less defined and included profiles OP-03 and -12 found in only two donors (5 and 8). Conspicuous in these two donors was the paucity of CD16 positive monocytes, a feature also found in donor 9. Monocyte phenotypes II and III were also linked by donors 7, 15, and 24 that shared parts of their profiles.
SPADE analysis. We used SPADE25 for 20 markers at high resolution and specificity to generate a hierarchy of
cell clusters, represented as a tree, for each donor. Analysis of side and forward scatter properties of each branch of the tree together with CD14 expression allowed us to identify branches corresponding to small and large mono-cytes (Supplementary Fig. S5).
This unsupervised analysis validated the individualization of small and large monocytes as subpopulations.
viSNE analysis. Small and large monocyte populations identified by SPADE were subjected to analysis with the
viSNE algorithm. viSNE creates 2-D plots where the expression of each marker is taken into account to deter-mine the position of each cell26. Analysis of these profiles showed a large extent of variations between donors,
with multiple clusters of monocytes detected. Strikingly, among these interindividual variations, common pat-terns were distinguishable in groups of unrelated donors. These shared features were particularly visible when data sets were visualized with selected markers, CD49d, CD43 (used in x and y axis) and CD62L (selected for MFI color-coded representation) (Fig. 5). In sm14+16+ monocytes we identified 3 subpopulations that were
present in 9 donors. These three subpopulations were formed of CD43+CD49d+CD62Lhi cells, CD43dim/neg
CD-49dhiCD62Ldim cells, and CD43negCD49ddimCD62Lhi cells (Fig. 5a) and their concomitant presence in one donor
was defined as profile a. In a second set of donors (n = 5), only populations CD43dim/negCD49dhiCD62Ldim cells,
and CD43negCD49ddimCD62Lhi were identified defining profile b (Fig. 5b). A third profile (named c, n = 4)
con-sisted of CD43+CD49d+CD62Lhi cells and CD43dim/negCD49dhiCD62Ldim cells together with an intermediate
population in between these two and of variable CD43 expression (Fig. 5c). A d profile was found in four donors and consisted of CD43+CD49d+CD62Lhi cells and CD43dim/negCD49dhiCD62Ldim cells as in profile c but
with-out the intermediate cells (Fig. 5d). Finally, only one donor (donor 10) had a unique profile (named e) with a CD43+CD49dhiCD62Ldim major cell population and a CD43hiCD49dhiCD62Lhi minor cell population (Fig. 5e).
Interestingly, donors regrouped according to these patterns of expression in sm14+16+ monocytes turned out to
share similarities of expression for several markers in all other monocyte sub-populations. Therefore, classifica-tion of donors into profiles a to d initially defined in sm14+16+ monocytes revealed clusters of donors with shared
patterns of expression across all monocytes populations (Table 2).
From these results, it appeared that numerous populations of monocytes could be distinguished and some were shared between donors. Most importantly, many monocyte populations were present in a fraction of the donors, defining complex intertwined phenotypic groups (a, b, c, d, and e) in our panel of 28 Caucasian healthy donors. The existence of such phenotypic groups among a population of healthy donors may further refine the definition of monocytes subsets. Overlooking these variabilities might have been an impediment in the definition of functional populations among global monocyte populations or even among the three monocyte subsets so far described in the literature.
We checked whether donors’ age and sex were associated with the identified clusters. As shown in Supplementary Fig. S6, age appeared randomly distributed among the clusters and no statistically significant difference was found. In contrast, significantly different sex ratios in clusters a and b were found compared to the parent population 98% confidence interval (Supplementary Fig. S7), suggesting that profile a and b may be more frequent in females and males, respectively.
Divergences between groups defined according to mean expression in a population versus
sin-gle cell expression of multiple markers.
Results presented in Figs. 3 and 5 clearly indicated that similar patterns of inter-individual variations of expression of markers, mostly adhesion molecules, were recognizable in our panel of 28 non-related donors. However, comparison of Tables 1 and 2 shows that groups of donors con-stituted from composite profiles of mean expression of adhesion molecules in monocyte subpopulations (Fig. 3)Donors OP profiles Global monocyte phenotypes
1–2–11-12-21 01 10 20/22 30 40/42 50 I 3–13–14–18–19–20 04/05 11/12 20 32 41 51 II 4–6–10–16–17–22–23–25 01/02 10/11 21 31/33 43/44 51 III 5–8 0312 IV 7–9–15–24–26–27–28 Non clustered
www.nature.com/scientificreports
www.nature.com/scientificreports/
and combined expression of multiple markers at the single cell level (Fig. 5) do not coincide. This suggests that composite phenotypes in donors can be achieved by different combinations of single cell profiles of expression and points to the existence of intricate patterns of regulation of gene expression in this cell type. It also raises the question of which biological significance may be attached to each classification. Identification of immune cell populations with defined phenotypes has been highly instrumental to advancing the understanding of immune functions and their mechanisms. Consequently, groups based on complex phenotypes determined at the single cell level might seem more relevant to the biology of monocytes (Table 2). Alternatively, since monocytes are innate, non-clonal immune cells with limited functions inside the vasculature aside patrolling of the endothe-lium by non-classical monocytes11, functional relevance may depend on the expression of discrete molecules
Figure 5. viSNE profile of sm14+16+ monocytes. Small and large monocyte populations identified with SPADE
(Supplementary Fig. S5) were analysed with viSNE and specific expression profiles of adhesion molecules were identified in donors. The expression of CD43, CD49d and CD62L (x, y, z) in sm14+16+ monocytes was
represented here in dot plot profiles, with CD62L expression shown according to a colour scale (right hand side axis). Profiles shown in (a–e) correspond to monocyte sub-populations a, b, c, d, e identified in Table 2. In panel a, a schematic representation of monocyte populations identified in profile a and that are found in various combinations in profiles b, c, d, e is shown. Plots shown are from representative donors expressing a to e profiles.
in cells which otherwise express disparate phenotypes. Adhesion molecules would be candidates for such a role given their involvement in cell recruitment and tissue infiltration. Thus, phenotypic groups defined according to expression of specified adhesion molecules may associate with particular cell functions. In vitro functional studies and analysis in patients should help determine the associations between the classifications proposed here and functional significance in different settings.
Profiles of expression of transcription factors in human monocyte subpopulations.
To further determine the identity of monocyte subpopulations, the expression of selected transcription factors was exam-ined by qRT-PCR in purified monocyte populations obtaexam-ined from three healthy donors. Factors that had been shown to discriminate between currently defined monocyte populations were selected9. These included CREB5for its strong expression in classical monocytes, HES4 and MXD3 for nonclassical monocytes, and HES1 and EGR1 for intermediate ones9. NR4A1, which has been shown to be preferentially expressed in CD14dimCD16+
monocytes27 was also included. SPI1 (PU.1), which is strongly expressed in precursor and circulating myeloid
cells28, was used as a positive control.
As shown in Fig. 6, CREB5 was strongly expressed in sm14+16neg and in la14+16neg. This may be expected if
both subsets would be considered as part of CD16neg classical monocytes analysed by others9,29. However, it was
also expressed in la14+16+ monocytes at a level similar to those of CD16neg monocytes. No expression was found
in sm14dim16+ and sm14+16+ monocytes.
HES4 and MXD3 were strongly expressed in sm14dim16+ monocytes (Fig. 6) that are likely to correspond to
nonclassical monocytes9. However, expression in other subsets was also found. HES4 expression was found in
other CD16+ monocytes (sm14+16+ and la14+16+). MXD3 was expressed in all monocyte subsets although the
level of expression was significantly lower in sm14+16neg, la14+16neg, and la14+16+ monocytes.
Expression of HES1 and EGR1 was found in sm14+16+ monocytes but was also strong in other
subpopula-tions (Fig. 6). HES1 expression was strong in sm14dim16+ monocytes and EGR1 was similarly expressed in all
monocytes.
NR4A1 was also expressed in all monocytes with no significant difference between sm14dim16+ cells and other
monocytes subsets in contrast to a previous report27.
Overall, although no difference could be detected between sm14+16neg and la14+16neg populations in this
analysis, la14+16+ were clearly distinguished from sm14+16+ with respect to CREB5 expression.
Cytokine production by small and large monocyte subpopulations in response to TLR agonists.
To determine if phenotype differences between small and large monocyte subpopulations, as described above, would identify populations with distinct functions, we analysed the responses of purified subpopulations isolated from 3 donors to several TLR agonists. Cells were exposed to increasing concentrations of LPS and Pam3CSK4 (Fig. 7), and poly (I:C), imiquimod, and CpG ODN (not shown), and we assayed TNF and IL-1β present in super-natants, as well as IL-10 (not shown).
As seen in Fig. 7, although extensive diversity of responses was evident in donors, clear, dose-response depend-ent, statistically significant differences between small and large monocytes were found in individual donors.
Most notably, in donor 10, among CD16-negative cells, sm14+16neg monocytes were more responsive to LPS
and Pam3CSK4 than la14+16neg monocytes (TNF and IL-1β). In CD16+ cells, la14+16+ monocytes produced
more IL-1β in response Pam3CSK4 than sm14+16+cells. In donor 9, la14+16neg monocytes responded more
intensely to Pam3CSK4 than sm14+16neg cells, and la14+16+ monocytes produced more TNF in response to
LPS and more IL-1β in response to Pam3CSK4 compared to sm14+16+ cells. Finally, in donor 7, sm14+16neg and
la14+16neg had minimally different responses to LPS and Pam3CSK4. In this donor, sm14+16+ monocytes
pro-duced more TNF in response to LPS and Pam3CSK4, whereas predominant production of IL-1β was alternatively found in la14+16+ monocytes (LPS) and in sm14+16+ monocytes (Pam3CSK4). Additional differences between
large and small monocytes were found in responses to poly(I:C), imiquimod, and CpG ODN (data not shown). Together, these results indicate that small and large monocytes strongly differ in their responses to inflam-matory molecules. However, no clear bias toward pro- or anti-inflaminflam-matory responses were identified in small vs. large monocyte subpopulations. Differences in monocyte subpopulation responsiveness may be donor dependent. It should be noted that no unique pattern of responsiveness was also identified in CD16neg versus
CD16+ monocytes. This is not unexpected in view of the disparities of responsiveness in classical, intermediate,
and non-classical monocytes reported in the literature11–17. Differences in monocyte subpopulations responses
viSNE
Profile Donors Phenotype in sm14+16+
a 2–4–8–14–15–16–19– 21–25
CD43+CD49d+CD62Lhi
CD43dim/negCD49dhiCD62Ldim
CD43negCD49ddimCD62Lhi
b 1–3–6–12–13 CD43CD43dim/negnegCD49dCD49ddimCD62LhiCD62Lhidim
c 7–9–22–23 CD43
+CD49d+CD62Lhi
in-between population CD43dim/negCD49dhiCD62Ldim
d 17–18–20–24 CD43CD43+dim/negCD49dCD49d+CD62LhiCD62Lhi dim
www.nature.com/scientificreports
www.nature.com/scientificreports/
between donors may be associated with the phenotypic diversity of monocytes populations. Donors 7, 9, and 10 were not part of a same phenotypic group in our donor panel (Fig. 4, Tables 1 and 2).
Discussion
The definition of human monocyte subsets has progressed by distinguishing “intermediate” CD14+CD16+
mono-cytes from bona fide “non-classical” CD14dimCD16+ cells within CD16+ monocytes5. However, monocyte
func-tions often did not align with these clusters, with considerable discrepancies and overlaps in the assignment of inflammatory and immunologic roles to these subsets11–17. Further dissection of monocyte populations is
there-fore warranted in order to progress in the definition of less ambiguous functional human monocyte populations. To advance toward this goal, we have performed a comprehensive flow cytometry analysis of multicolour-labelled human monocytes present in PBMC. First, we showed that additional populations of larger monocytes were readily detectable by flow cytometry when high numbers of events (≥1 × 10⁶) were analysed.
These larger cells may have been excluded from analysis in previous studies since they can overlap with doublets in heterogeneous populations of PBMC consisting mostly of smaller cells such as lymphocytes. Here, to avoid this pitfall, we excluded doublets in populations of similar cell diameters. The larger size of these monocytes was con-firmed in imaging flow cytometry. Small monocytes are seemingly included within the “classical”, “intermediate” and “non-classical” subpopulations so far described. In addition, within small monocytes, a CD14dim CD16neg
population was also identified. Its expression of CD14, HLA-DR and CD86 together with lack of expression of lymphocyte lineage markers support its belonging to the monocyte cell type, confirming and extending results by others30.
Within these six monocyte populations, analysis of expression of 15 additional myeloid markers (such as FcRs, chemokine receptors, antigen presentation molecules, adhesion molecules) showed substantial variability of expression in healthy donors. Interestingly, variations in phenotype did not come out as random. Instead, groups of donors could be delineated with similar patterns of expression, and this was found in manual analysis of the data as well as in unsupervised algorithm-based analysis. Manual analysis was used to define receptor expression profiles at the subpopulation level. Combinations of these profiles defined signatures of markers expression that characterized the whole monocyte phenotype present in a donor. In addition, unsupervised analysis indicated, at the single cell level, the existence of four phenotypic groups of monocytes based on inter-individual variations of expression.
Significant differences were found between phenotypic groups defined using manual and unsupervised meth-ods. This is however not unexpected since in manual analysis groups were coarsely defined according to mean expression of markers (mostly adhesion molecules) in whole subpopulations of monocytes. In contrast, in unsu-pervised analysis, combined expression of adhesion molecules at the single cell level was the basis for group
Figure 6. Differential expression of selected transcription factors in monocyte subpopulations. PBMC (n = 3)
were isolated, stained, and analysed as described in Fig. 1, and sub-populations were purified by cell sorting. Purified cells were lysed, and RNA was purified and used as a template for cDNA synthesis. Samples were probed for the quantitative expression of indicated genes in a Taqman expression system. Data were expressed using the 2−ΔΔCt method. (*p < 0.05; **p < 0.01 Mann-Whitney U test).
definition. The significance of each of the methods of grouping will have to be determined in functional studies. A composite phenotype at the single cell level common to a group of monocytes may seem more likely to convey a specific immunologic cell function. However, taking into account the non-clonal nature of the cell type under study leads to an alternative hypothesis. Recruitment of monocytes to a tissue may depend on the expression of key cell surface adhesion molecules irrespective of the associated phenotype, and subsequent differentiation of monocytes in the tissues may follow cues from the environment31, superseding the original expression program
present in the cells. Therefore, the differential grouping of donors using these various methods may not be com-peting or exclusive, and may be considered as clustering of donors according to distinct characteristics of their monocytes.
Analysis of cytokine production induced by several TLR agonists in dose-response experiments clearly showed that small and large monocytes subpopulations responded differently within donors, further suggesting that these are distinct monocyte populations. Comparison of responses between small and large populations did not reveal patterns of responsiveness, pro- or anti-inflammatory, shared by donors. Actually, within an indi-vidual donor, dominant pro-inflammatory responses were alternatively detected in small and large subpopula-tions depending on the TLR agonist used. For example, in donor 9 TNF responses were stronger in la14+16+ vs.
sm14+16+ in response to LPS (Fig. 7), whereas the opposite was found for responses to imiquimod (data not
shown); similarly, in donor 7, IL-1β production was stronger in la14+16+ in response to LPS but not in response
to Pam3CSK4 (Fig. 7). Differences in signalling and/or transcriptional pathways in monocytes subpopulations may account for these opposite responses. Diversity of cytokine responses between donors was extensive and may mirror phenotype differences.
Although variability among donors in the expression of multiple genes in human monocytes has been previ-ously described by cytofluorometry and transcriptome analysis6,32,33, clustering of individuals in distinct profiles
of expression has not been achieved. The mechanisms leading to shared interindividual variations in monocyte phenotypes described here are unknown. Evidence has recently accumulated showing monocyte specific effects of sex and single nucleotide polymorphisms (SNP), epigenetic modifications particular to monocytes, age related
Figure 7. TNF and IL-1β production induced by TLR agonists in monocyte subpopulations isolated from 3
donors. Subpopulations of monocytes from donors 10, 9, and 7 (upper to lower row, respectively) were sorted and incubated overnight with increasing concentrations of LPS and Pam3CSK4, as indicated. TNF and IL-1β were assayed in supernatants by ELISA and concentrations were normalized to 1 × 10⁵ monocytes. For each
condition, monocyte subpopulations with related phenotypes were grouped in a same graph: sm14+16neg
(light blue) and la14+16neg (orange); sm14+16+ (dark blue) and la14+16+ (red). sm14dim16neg monocytes were
inconsistently detected in donors and were not included in the study; therefore, their CD16+ counterpart,
sm14dim16+ monocytes, were not shown. Results are presented as mean and standard deviation of duplicate
determinations. When error bars are not seen, they fall within the symbol. *p < 0.05, **p < 0.01, ***p < 0.001, Student’s unpaired t test.
www.nature.com/scientificreports
www.nature.com/scientificreports/
alterations, as well as environmentally linked changes in monocytes (with factors such as viral infections, micro-biota composition, serum lipid levels, and lifestyle choices)34–43.
Some of these variations have been directly linked to phenotype changes. SNPs in the FcGR2 locus were associated with levels of CD32 expression in monocytes, but not in B lymphocytes34. In our results, no cluster of
donors was defined based on CD32 expression, and this may be due to the smaller size or higher heterogeneity of our cohort of donors.
Sex difference has also been linked to various monocyte phenotypes and functions35–37. Particularly, the
expression of CD163 was higher in intermediate monocytes from women38, a pattern however not found in this
study even after dividing monocytes into subpopulations and OP profiles. In our results, although cluster sizes were small, several phenotypes were associated with sex indicated by overrepresentation of females or males in different clusters.
Age is a well-known source of variations in the immune system35–39. Interestingly, although our clusters
included small numbers of donors, our results suggested that monocyte phenotypes might be related to the age of donors, particularly when the overall phenotype of monocyte subpopulations was considered (Supplementary Fig. S3 and Fig. 4).
Epigenetic profiles specific to individuals have been described in blood monocytes. In epigenome wide asso-ciation studies (EWAS), analysis of locus specific DNA methylation signatures in classical monocytes has shown interindividual variable CpG site methylations associated with disease susceptibilities and tobacco exposure and these were specific to monocytes39. In bulk non-fractionated monocytes, interindividual variations in DNA
meth-ylation were linked to cis-located SNPs40. In addition, epigenetic modifications that were not linked to genetic
variants in cis were associated with specific profiles of expression of NFkappaB, CXCL8, and IL-10 in classical monocytes41.
Infections and particularly CMV status has been shown to be associated with immune cell phenotypes36,37.
CD64 expression in classical, intermediate, and non-classical monocytes was slightly but significantly increased in CMV positive subjects38.
Overall, these studies suggest that multiple mechanisms are likely to affect steady-state gene expression in monocytes, and combinations of intrinsic and environmental factors may determine phenotype differences between individuals.
Complete equivalence between sm14+16neg, sm14+16+, and sm14dim16+ monocytes described in this study
and classical, intermediate, and non-classical monocytes, respectively, is unlikely since CD14 and CD16 expres-sions in small and large monocytes partly overlapped (Fig. 1h). Small and large monocytes needed to be care-fully distinguished according to their light scattering properties in order to be individualized in CD14/CD16 scatter plots. It is likely that in many previous studies classical monocytes included sm14+16neg and parts or
all la14+16neg cells, and similarly intermediate monocytes included sm14+16+ and some la14+16+. sm14dim16+
monocytes appeared to fit with the definition of non-classical monocytes. Therefore, cell populations used pre-viously for characterization of phenotypic or functional properties of classical and intermediate monocytes may include contaminating la14+16neg and la14+16+ monocytes, respectively. Recently, two new populations of
human monocytes have been described by RNA-seq analysis44, although one of them (Mono4) may correspond
to contaminating NK cells45,46. More recently, human blood monocytes were analysed by multiparameter mass
cytometry47. Non-classical monocytes were subdivided in three populations, and four clusters were identified in
classical monocytes, one of which (population 8) may correspond to a subset of circulating dendritic cells cDC246.
Relationships of these populations, some of them defined according to transcriptomic profiles, with populations described here will have to be determined.
Materials and Methods
Donors.
Blood samples from 28 healthy Caucasian donors (Supplementary Table S1) were obtained from the local blood bank in accordance with institutional regulations from the Etablissement Français du Sang, Paris, France. Written informed consent was obtained from all donors. This work was carried out in accordance with the European Code of Conduct for Research Integrity – revised edition (2017). The study was approved by the Cochin Hospital Ethics Committee (3 CCPPRB 2061) as part of an analysis of blood monocyte populations in septic patients (F. M-M, V. Faivre, A.C. Lukaszewicz, D. Payen, N. M., A. H., unpublished).Cell separation.
Peripheral Blood Mononuclear Cells (PBMC) were isolated from venous blood collected in the presence of ACD, by density gradient centrifugation on a cushion of Ficoll as described48.Briefly, blood was diluted (1:2) with sterile nonpyrogenic Phosphate Buffered Saline (PBS) and gently layered on 15 ml of Ficoll in a 50 mL Falcon tube. After centrifugation for 15 min at 800 x g at room temperature without brake, PBMC were collected and cells were washed twice (10 min, 300 × g, 4 °C) with cold PBS 1X supplemented with 10% decomplemented human AB serum (HABSDEC). To saturate cell surface nonspecific binding sites, cells
were then incubated in 10 ml PBS supplemented with 10% HABSDEC (PBS/10% HABS) for 15 min on ice. PBMC
were then collected by centrifugation (5 min, 300 × g, 4 °C), re-suspended in PBS/10% HABS at a concentration of 4 × 10⁶ cells/ml, and aliquoted in FACS tubes for further use.
Cell staining.
Monoclonal antibodies (MAb) listed in Supplementary Table S2 were used. Staining of PBMC was designed for 8-color analysis with 3 sets of stained cells. Each set included lineage markers CD3, CD19, CD335/NKp46 all labelled with phycoerythrin (PE) to allow exclusion of T and B lymphocytes and NK cells, respectively. Each set also included CD14 and CD16 for monocyte subsets identification. Other markers, were unique to each set and consisted of CD64, CD32, CCR2 CCR5, CX3CR1 (set 1), CD80, CD86, HLA-DR, CD163, CD7 (set 2), and CD62L, CD162, CD43, CD49d, CD56 (set3). MAb were added to the cell suspension (2 × 10⁶by MAbs was determined in preliminary titration experiments. Cells were then washed once in PBS/10% HABS (5 min, 300 × g, 4 °C), and once in 1 ml of PBS supplemented with EDTA (0.5 mM) (5 min, 300 × g, 4 °C). Cell pellets were recovered in 0.2 mL PBS EDTA 0.5 mM, placed on ice in the dark and analysed immediately by flow cytometry. Cell viability was analysed with Sytox-Pacific Blue dead cell stain in separate samples in order to allow use of all fluorescence channels for analysis of expressed markers. Dead cells were in most cases undetectable and never above 0.05% of the cells.
Flow cytometry analysis.
Stained cells were analysed on a FACS Canto II flow cytometer equipped for 8-color analysis. Calibration was performed as recommended in instructions provided by the manufacturer with setup procedures using 7-color Cytometer Setup and Tracking beads and automated setup adjustments keeping variations within acceptable limits set by the manufacturer. Unstained cells, isotype controls coupled to the same fluorochrome used for the marker (except for control MAb for CD32 where Pacific Orange was used as a control for Krome Orange due to lack of availability) and single labelled cells were used to set thresholds for positivity and to correct for spillovers. Compensations were automatically set by DIVA and manually checked and adjusted.Manual analysis. Manual gating was performed using FlowJo V10. Doublet identification and exclusion was
achieved based on fluorescence width versus area pulse measurements49.
Gating of cells of interest allowed us to validate compensations for each label. Thresholds for positivity were set to exclude 99% of the label obtained with isotype controls (Ig) for each marker. Percentage of positive cells and specific mean fluorescence intensity (MFI) for each label and for each subpopulation were then determined. Specific MFI was calculated as:
MFI=MFIMAb−MFIIg
Percentage of positive cells and specific MFI were presented in bubble and colour map graphs using OriginPro (Northampton, MA). MFI were designated as dim, med, and bri (for dim, medium, and bright, respectively) according to the intensity of expression of a marker in a population. Percentage of positive cells were noted as lo, int, and hi (for low, intermediate, and high, respectively) to reflect the proportion of cells that were positive for a marker in a population. MFI and percentage of positivity were written as subscript and superscript, respectively (XMFIpercent pos), when both were assigned to a marker. Network visualization of associations of sub-group
pheno-types in donors was performed using Gephi version 0.9.123. In Gephi, the layout map was obtained using the
ForceAtlas 2 algorithm with repulsion and attraction strengths set at 1 000 and 1.0, respectively24.
Unsupervised analysis. Unsupervised multidimensional analysis was performed using two algorithms.
SPADE (Spanning tree Progression of Density normalized Events)25 was used as provided in the Cytobank
suite (https://premium.cytobank.org/cytobank/login). SPADE is an unsupervised data analysis algorithm, which
organizes cells into hierarchies of related phenotypes (trees) and identifies population clusters. The number of tar-get nodes was set to 600, and the size of downsampled events tartar-get was set to 10,000. Identification of populations of interest in SPADE allowed us to characterize and to define clusters of monocytes through single cell measure of 11 simultaneous parameters (FSC-A, FSC-H, FSC-W, SSC-A, SSC-H, SSC-W, CD14, CD16, CD3-CD19-NKp46, Density and Cluster).
viSNE (visualization of high-dimensional single-cell data)26 was also used in the Cytobank suite (
https://pre-mium.cytobank.org/cytobank/login). viSNE analysis was applied to SPADE branches that included small and
large monocytes.
Imaging flow cytometry.
Imaging flow cytometry was performed on a two-camera Amnis Image Stream X Mark II with INSPIRE acquisition software (Merck, Darmstadt, Germany). All images were captured with a 20x magnification objective. All cells within a gate were analysed.Shape analysis of events used the aspect ratio feature (IDEAS software, Amnis/Millipore Corp.), and ratios between minor and major axis of each event was calculated in defined gates.
For size determination, we created a mask (IDEAS software) that traces the boundaries of cells according to CD14 expression in the image of each cell analysed. The area defined within this mask was directly related to the cell size determined with the Area Feature, and diameters were calculated from circles that had the same area as the cells (Diameter Feature, IDEAS software).
qRT-PCR.
Monocytes were isolated from PBMC by cell sorting on a FACS Aria Cell Sorter II. Cell sorting was based on negative selection against CD3, CD19 and NKp46, in order to exclude T cells, B cells and NK cells, respectively, and on the expression of CD14 and CD16.Purified cells were lysed in TriReagent and stored at −20 °C. RNA was purified by chloroform extraction and isopropanol precipitation. RNA was dissolved in 10 µL RNAse-free water and stored at −80 °C or directly used for a reverse transcription. Quality and quantity of RNA samples were assessed using a NanoDrop 2000 Spectrophotometer.
RNA samples were used as a template for cDNA synthesis using the kit SuperScript III First-Strand Synthesis system kit and random hexamers provided by the kit were used as primers (Invitrogen, Thermo Fischer Scientific).
The quantitative expression of early growth response 1 (EGR1), cAMP responsive element binding pro-tein 5 (CREB5), spleen focus forming virus proviral integration oncogene (SPI1), hairy and enhancer of split 4 (HES4), actin beta (ACTB) and 18 s ribosomal RNA (18S) genes were measured using the kit Takyon
™
Low Rox Probe MasterMix dTTP Blue (Eurogentec, Seraing, Belgium). The necessary primers and probes (Applied Biosystems, Thermo Fischer Scientific) for qPCR use the Taqman technology, or probe hydrolysis, and were labeled at the 5′-end by FAM fluorophore and a NFQ quencher at the 3′-end. qPCR was achieved by followingwww.nature.com/scientificreports
www.nature.com/scientificreports/
the recommendations of Takyon
™
kit, using a 7500 Real-Time PCR system (Applied Biosystems). The sequences recognized by the probes were:EGR1: TGACCGCAGAGTCTTTTCCTGACAT; CREB5: TTGATGCCAATGGAGCGACAAATGT; SPI1: CAGTCTTGGCCACCAGGTCTCCTAC; HES4: CAGGTGACGGCCGCGCTCAGCGCCG; ACTB: CCTTTGCCGATCCGCCGCCCGTCCA; 18S: CCATTGGAGGGCAAGTCTGGTGCCA.
Data was normalized to the expression of internal controls (ACTB and 18S) to obtain the ΔCt (Cycle Threshold). The relative quantification of the expression of mRNA was determined by using the 2−ΔΔCt method.
Monocyte activation and cytokine determinations.
Monocytes sorted as described above (2–10 × 106/ml in RPMI-10% FCS) were incubated overnight (37° C, 5% CO2) with increasing concentrations of TLR
ago-nists. LPS O111:B4 (L-2630, Sigma-Aldrich, St Louis, MO) was re-purified by repeated phenol extractions50 and
induced no response in TLR2 transfected HEK 293 cells. Pam3CSK4 (InvivoGen, Toulouse, France) was used as recommended by the supplier. Agonists were tested in preliminary experiments to determine optimal activation concentrations.
Supernatants were collected by centrifugation (5 min, 300 × g). Cytokine concentrations were determined by ELISA in duplicate assays using TNF and IL-1β (DuoSet, R&Dsystems, Minneapolis, MN) detection kits and were normalized to the cell number. Minimal concentrations detected were 15.6 and 3.9 pg/ml for TNF and IL-1β, respectively.
Statistical analysis.
The statistical significance of differences between subpopulations of monocytes was determined by Mann-Whitney U test (qRT-PCR, donors’ age in phenotypic clusters), confidence interval of bino-mial proportions (sex ratio in phenotypic clusters), one-way ANOVA (ImageStream) and Student’s unpaired t test (ELISA) using GraphPad Prism.Data availability
The datasets generated during the current study are available from the corresponding author on reasonable request.
Received: 21 October 2019; Accepted: 10 February 2020; Published: xx xx xxxx
References
1. Passlick, B., Flieger, D. & Ziegler-Heitbrock, L. Identification and characterization of a novel monocyte subpopulation in human peripheral blood. Blood 74, 2527–2534 (1989).
2. Grage-Griebenow, E., Flad, H. & Ernst, M. Heterogeneity of human peripheral blood monocyte subsets. J. Leukoc. Biol. 69, 11–20 (2001).
3. Belge, K.-U. et al. The proinflammatory CD14+CD16+DR++ monocytes are a major source of TNF. J. Immunol. 168, 3536–3542 (2002).
4. Ancuta, P. et al. Fractalkine preferentially mediates arrest and migration of CD16+ monocytes. J. Exp. Med. 197, 1701–7 (2003). 5. Ziegler-heitbrock, L. et al. Nomenclature of monocytes and dendritic cells in blood. e-Blood 116, e74–e80 (2010).
6. Wong, K. L. et al. Gene expression profiling reveals the defining features of the classical, intermediate, and nonclassical human monocyte subsets. Blood 118, e16–31 (2011).
7. Zawada, A. M. et al. SuperSAGE evidence for CD14 ++CD16 + monocytes as a third monocyte subset. Blood 118, e50–61 (2011). 8. Frankenberger, M. et al. A defect of CD16-positive monocytes can occur without disease. Immunobiology 218, 169–174 (2013). 9. Schmidl, C. et al. Transcription and enhancer profiling in human monocyte subsets. Blood 123, 90–100 (2014).
10. Gren, S. T. et al. A single-cell gene-expression profile reveals inter-cellular heterogeneity within human monocyte subsets. Plos One
10, 1–20 (2015).
11. Cros, J. et al. Human CD14dim monocytes patrol and sense nucleic acids and viruses via TLR7 and TLR8 receptors. Immunity 33, 375–386 (2010).
12. Skrzeczynska-Moncznik, J. et al. Peripheral blood CD14 high CD16+ monocytes are main producers of IL-10. Scand. J. Immunol.
67, 152–159 (2008).
13. Mukherjee, R. et al. Non-Classical monocytes display inflammatory features: Validation in Sepsis and Systemic Lupus Erythematous.
Sci. Rep. 5, 13886 (2015).
14. Semnani, R. T. et al. Human monocyte subsets at homeostasis and their perturbation in numbers and function in filarial infection.
Infect. Immun. 82, 4438–4446 (2014).
15. Rossol, M., Kraus, S., Pierer, M., Baerwald, C. & Wagner, U. The CD14 bright CD16+ monocyte subset is expanded in rheumatoid arthritis and promotes expansion of the Th17 cell population. Arthritis Rheum. 64, 671–677 (2012).
16. Wong, K. L. et al. The three human monocyte subsets: Implications for health and disease. Immunol. Res. 53, 41–57 (2012). 17. Smedman, C. et al. FluoroSpot analysis of TLR-activated monocytes reveals several distinct cytokine-secreting subpopulations.
Scand. J. Immunol. 75, 249–258 (2012).
18. Haziot, A. et al. Resistance to endotoxin shock and reduced dissemination of gram-negative bacteria in CD14-deficient mice.
Immunity 4, 407–14 (1996).
19. Kristiansen, M. et al. Identification of the haemoglobin scavenger receptor. Nature 409, 198–201 (2001).
20. Bover, L. C. et al. A Previously unrecognized protein-protein interaction between TWEAK and CD163: potential biological implications. J. Immunol. 178, 8183–8194 (2007).
21. Stillwell, R. & Bierer, B. E. T cell signal transduction and the role of CD7 in costimulation. Immunol. Res. 24, 31–52 (2001). 22. Geissmann, F., Jung, S. & Littman, D. R. Blood monocytes consist of two principal subsets with distinct migratory properties.
Immunity 19, 71–82 (2003).
23. Bastian, M., Heymann, S. & Jacomy, M. Gephi: An open source software for exploring and manipulating networks. Third Int. AAAI
24. Jacomy, M., Venturini, T., Heymann, S., & Bastian, M. ForceAtlas2, a continuous graph layout algorithm for handy network visualization designed for the Gephi software. Plos One 9, 1–12 (2014).
25. Qiu, P. et al. Extracting a cellular hierarchy from high-dimensional cytometry data with SPADE. Nat. Biotechnol. 29, 886–891 (2011). 26. Amir, E. D. et al. viSNE enables visualization of high dimensional single-cell data and reveals phenotypic heterogeneity of leukemia.
Nat. Biotechnol. 31, 545–552 (2013).
27. Hanna, R. N. et al. NR4A1 (Nur77) deletion polarizes macrophages toward an inflammatory phenotype and increases atherosclerosis. Circ. Res. 110, 416–427 (2012).
28. Chen, H. M. et al. Neutrophils and monocytes express high levels of PU.1 (Spi-1) but not Spi-B. Blood 85, 2918–28 (1995). 29. Ingersoll, M. et al. Comparison of gene expression profiles between human and mouse monocyte subsets. Blood 115, 10–20 (2010). 30. SelimogluBuet, D. et al. Characteristic repartition of monocyte subsets as a diagnostic signature of chronic myelomonocytic
leukemia. Blood 156, 649–654 (2015).
31. Rivollier, A., He, J., Kole, A., Valatas, V. & Kelsall, B. L. Inflammation switches the differentiation program of Ly6Chi monocytes from antiinflammatory macrophages to inflammatory dendritic cells in the colon. J. Exp. Med. 209, 139–55 (2012).
32. Hudig, D., Hunter, K. W., Diamond, W. J. & Redelman, D. Properties of human blood monocytes. II. Monocytes from healthy adults are highly heterogeneous within and among individuals. Cytom. Part B Clin. Cytom. 86, 121–134 (2014).
33. Segura, V. et al. In-depth proteomic characterization of classical and non-classical monocyte subsets. Proteomes 6, 8 (2018). 34. Roederer, M. et al. The genetic architecture of the human immune system: a bioresource for autoimmunity and disease pathogenesis.
Cell 161, 387–403 (2015).
35. Piasecka, B. et al. Distinctive roles of age, sex, and genetics in shaping transcriptional variation of human immune responses to microbial challenges. Proc. Natl. Acad. Sci. USA 115, E488–E497 (2018).
36. Liston, A., Carr, E. J. & Linterman, M. A. Shaping variation in the human immune system. Trends Immunol. 37, 637–646 (2016). 37. Brodin, P. & Davis, M. M. Human immune system variation. Nat. Rev. Immunol. 17, 21–29 (2017).
38. Puissant-Lubrano, B. et al. Distinct effect of age, sex, and CMV seropositivity on dendritic cells and monocytes in human blood.
Immunol. Cell Biol. 96, 114–120 (2018).
39. Hachiya, T. et al. Genome-wide identification of inter-individually variable DNA methylation sites improves the efficacy of epigenetic association studies. npj Genomic Med. 2, 1–13 (2017).
40. Schröder, C. et al. Regions of common inter-individual DNA methylation differences in human monocytes: Genetic basis and potential function. Epigenetics and Chromatin 10, 1–18 (2017).
41. Chen, L. et al. Genetic drivers of epigenetic and transcriptional variation in human immune cells. Cell 167, 1398–1414 (2016). 42. Patel, V. K., Williams, H., Li, S. C. H., Fletcher, J. P. & Medbury, H. J. Monocyte inflammatory profile is specific for individuals and
associated with altered blood lipid levels. Atherosclerosis 263, 15–23 (2017).
43. Brodin, P. et al. Variation in the human immune system is largely driven by non-heritable influences. Cell 160, 37–47 (2015). 44. Villani, A. C. et al. Single-cell RNA-seq reveals new types of human blood dendritic cells, monocytes, and progenitors. Science 356,
eaah4573 (2017).
45. Smiljanovic, B. et al. Comment on “Single cell RNA-seq reveals new types of human blood dendritic cells, monocytes and progenitors”, https://www.charite-bioinformatik.de/publikationen_science_comment2017.php (2017)
46. Dutertre, C. A. et al. Single-cell analysis of human mononuclear phagocytes reveals subset-defining markers and identifies circulating inflammatory dendritic cells. Immunity 51, 1–17 (2019).
47. Hamers, A. A. J. et al. Human monocyte heterogeneity as revealed by high-dimensional mass cytometry. Arterioscler. Thromb. Vasc.
Biol. 39, 25–36 (2019).
48. Faivre, V. et al. Human monocytes differentiate into dendritic cells subsets that induce anergic and regulatory T cells in sepsis. Plos
One 7, e47209 (2012).
49. Wersto, R. P. et al. Doublet discrimination in DNA cell-cycle analysis. Commun. Clin. Cytom. 46, 296–306 (2001).
50. Vasselon, T., Detmers, P. A., Charron, D. & Haziot, A. TLR2 recognizes a bacterial lipopeptide through direct binding. J. Immunol.
173, 7401–5 (2004).
Acknowledgements
We wish to thank Dr. N. Dulphy for extensive and continuous help in the operation of the BD FACSCANTO, Dr. E. Clave and C. Douay for expert assistance in setting the qRT-PCR protocols, Dr. N. Setterblad, Dr. S. Duchez, and C. Doliger from the Imaging, Cell Selection and Genomics Core Facility at Institut de Recherche Saint-Louis, Université Paris – Diderot for excellent assistance in cell sorting experiments, and the cell sorting technological platform at Institut Imagine, Université Paris Descartes for access to the imager flow cytometer Amnis Imagestream. We are greatly indebted to Dr. H. Haziot-Thalhammer for invaluable insight in graph theory. This work was supported by institutional funding from INSERM, Paris, France, and has been published under the framework of the LABEX TRANSPLANTEX [ANR-11-LABX-0070_TRANSPLANTEX] and benefits from funding from the French government, managed by the French National Research Agency (ANR) as part of the Investments for the Future program.
Author contributions
A.H., N.M. and D.C. contributed to the conception of the work; F.M.M., S.O.C. and A.H. designed the experiments; F.M.M. and S.O.C., acquired data; F.M.M., S.O.C., and A.H. analysed the data; F.M.M., S.O.C., N.M. and A.H. wrote the paper.
Competing interests
The authors declare no competing interests.
Additional information
Supplementary information is available for this paper at https://doi.org/10.1038/s41598-020-61022-1.
Correspondence and requests for materials should be addressed to A.H. Reprints and permissions information is available at www.nature.com/reprints.
Publisher’s note Springer Nature remains neutral with regard to jurisdictional claims in published maps and