Decision Tools for Electricity Transmission Service and Pricing:
A Dynamic Programming Approach
by
Özge Nadia Gözüm
B.S., Electrical Engineering and Computer Science
Massachusetts Institute of Technology (2000)
Submitted to the Department of Electrical Engineering and Computer Science
in Partial Fulfillment of the Requirements for the Degree of
Master of Engineering in Electrical Engineering and Computer Science
at the
MASSACHUSETTS INSTITUTE OF TECHNOLOGY
May 16, 2001
© Özge Nadia Gözüm, MMI. All rights reserved.
The author hereby grants to MIT permission to reproduce and to distribute publicly paper
and electronic copies of this thesis document in whole or in part.
Author__________________________________________________________________
Department of Electrical Engineering and Computer Science
May 16, 2001
Certified by______________________________________________________________
Marija D. Ilic
Senior Research Scientist
Accepted by_____________________________________________________________
Arthur C. Smith
Chairman, Department Committee on Graduate Theses
Decision Tools for Electricity Transmission Service and Pricing:
A Dynamic Programming Approach
by
Özge Nadia Gözüm
Submitted to the Department of Electrical Engineering and Computer Science
on May 16, 2001, in partial fulfillment of the
requirements for the degree of
Master of Engineering in Electrical Engineering and Computer Science
Abstract
For a deregulated electricity industry, we consider a general electricity market structure
with both long-term bilateral agreements and short-term spot market such that the system
users can hedge the volatility of the real-time market. From a Transmission Service
Provider’s point of view, optimal transmission resource allocation between these two
markets poses a very interesting decision making problem for a defined performance
criteria under uncertainties. In this thesis, the decision-making is posed as a stochastic
dynamic programming problem, and through simulations the strength of this method is
demonstrated. This resource allocation problem is first posed as a centrally coordinated
dynamic programming problem, computed by one entity at a system- wide level. This
problem is shown to be, under certain assumptions, solvable in a deterministic setup.
However, implementation for a large transmission system requires the algorithm to
handle stochastic inputs and stochastic cost functions. It is observed that the curse of
dimensionality makes this centralized optimization infeasible. Thesis offers certain
remedies to the computational issues, but motivates a partially distributed setup and
related optimization functions for a better decision making in large networks where the
intelligent system users drive the use of network resources. Formulations are introduced
to reflect mathematical and policy constraints that are crucial to distributed network
operations in power systems.
Thesis Supervisor: Dr. Marija D. Ilic
Title: Senior Research Scientist
Acknowledgements
I wish to express my deepest gratitude to my thesis supervisor Marija Ilic, for teaching
me the pleasure of doing research and thinking broadly. With her advice, help and
encouragement, not only do I finish my degree, but I also have a better understanding of
how to think scientifically.
I would also like to thank Philip Yoon, Petter Skantze, Poonsaeng Visudhiphan
for their support and brainstorming sessions. I am in debt to Michael R. Wagner for being
a great teammate, and always being at the other end of the line when I needed a break.
During my years at MIT, I have had the good fortune of being a student to
invaluable professors and instructors. I would like to thank Prof. Dimitri Bertsekas, Prof.
Alan Oppenheim, Prof. Alan Grodzinsky and Prof. George Verghese for their inspiration,
and Maya Said for being a great role model.
I would like to extend my deepest thanks to everyone at LIDS, Shan-Yuan
‘HoHo’ Ho for reminding me to make time for myself, and Asuman and Emre Köksal for
boosting my mood and endurance at all times. And, I cannot thank Todd P. Coleman
enough for always being there, putting me in good spirits and without knowing
encouraging me to bring the best out of me in my work.
I would like to thank all my friends who supported me patiently during my studies
when I was not being the friend I wanted to be. Especially Zeyad F. Moussa, Ipek
Kismet, Kutlu Kazanci, Asli Leblebicioglu, my cousin Melis Izgi, Daniele de Francesco,
Petros Boufounos and Hugo Barra. And many thanks to Ashok Sivakumar, Rania Khalaf,
Chee We Ng and Xiaomin Mou for always taking the time to make sure I am always
doing fine.
My experience at MIT would not be the same without my ‘sister’ Carol S. Chow
who has taught me so much by just being herself.
Finally, I would like to dedicate this thesis to my parents Meral and Sait, and
brother Sinan, whose unconditional courage and love have always been with me. I hope I
was able to make them proud all these years that I have been away to return their favors.
The work in this thesis was partially funded by the EPRI/DoD project on Complex
Interactive Networks, headed by Prof. Yu-Chi Ho of Harvard University. This support is
greatly appreciated.
To my family,
Meral, Sait and Sinan.
Contents
1. Introduction
8
1.1 Problem Statement
9
1.1.1 Centrally Coordinated Operation
9
1.1.2 Partially Distributed Operation
10
1.2 Thesis Summary and Contribution
11
2. Transmission System Design and Tools
13
2.1 Overview of Electricity Markets
13
2.2 Time Frames and Event Characteristics
14
2.3 Reliability and Uncertainties
16
2.3.1 Physical System Uncertainty
17
2.3.2 Market Input Uncertainty
18
2.4 Technical Background
19
2.4.1 Dynamic Programming and Curse of Dimensionality
19
2.4.2 Optimal Power Flow
21
3. Coordinated System Operation with Static Topology
22
3.1 Coordinated Decision Making by the TSP
22
3.2 Deterministic User Requests
24
3.3 Stochastic User Requests
29
3.4 Possible Approaches to the Curse of Dimensionality Problem
33
3.4.1 Application of Markov Decision Processes
34
3.4.2 Rollout Algorithms
35
3.4.3 Conservative Dynamic Programming
38
3.4.4 Neuro- Dynamic Programming
39
4. Coordinated System Operation with Dynamic Topology
42
4.1 TSP Objective Function
42
4.2 Reliability Analysis for Large Transmission Systems
45
4.2.1 Narrow Definition of Transmission Reliability
48
4.3 Priority Pricing in Centralized Setup
52
4.4 Extension of Priority Pricing to Distributed Decision Making
54
4.5 Near Real Time Feedback
56
5. Partially Distributed Decision Making
59
5.1 Motivation
59
5.2 Procedure
61
5.3 Distributed Operation Under Static Topology
62
5.3.1 Determination of Price Signals
63
5.3.2 System User Optimizations
65
5.4 Distributed Operation Under Dynamic Topology
69
5.5 Distributed Operation with Local Information
71
5.6 Bounds on Optimality
73
6. Simulations and Results
75
6.1 Basic 2-Bus Example and the Assumptions
75
6.2 Simulated Cases
77
6.2.1 Dynamic vs. Static Decision Making
78
6.2.2 Different Spot Market Conditions
79
6.2.3 System Uncertainties
82
7. Conclusion
85
7.1 Preliminary Conclusions
85
7.2 Future Research
87
List of Figures
1-1
Decision flow in the coordinated model.
10
1-2
Decision flow in the distributed model.
10
2-1
Load diagram for a week in May, New England1
18
2-2
Average monthly patterns of daily load, New England
19
3-1
Tree of uncertainties
22
3-2
Time line of events
23
3-3
DP tree for a 2-Bus system
27
3-4
Detailed DP tree
28
4-1
Tree of uncertainties
42
4-2
Description of possible events
43
4-3
Detailed DP tree with system uncertainties
45
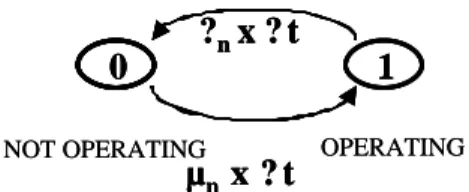
4-4
Markov chain for the status of a line
50
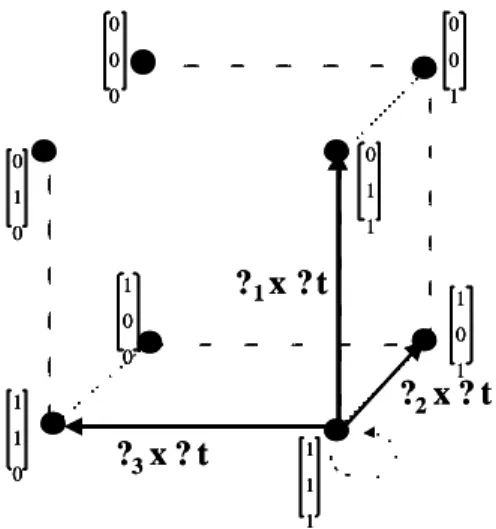
4-5
State space for a 3- line system physical reliability
51
5-1
Time line of distributed operations
61
5-2
Base and neighbors in a cluster
72
6-1
Sample 2-Bus system
75
Chapter 1
Introduction
This thesis aims to develop decision-making tools for the partic ipants of the newly evolving electricity transmission market where demand and supply determine the value of the transmission service. Traditionally, transmission system has been treated as a passive, static pipe-like system for transmission of energy. However, with deregulation transmission system is now treated as an individual entity. It can no longer be assumed passive and static. It is not passive because it is a scarce resource and responds to usage levels. It is dynamic because it has usage-based and reliability-based uncertainties. These realized concepts show why transmission is a service, which bundles the right to use capacity with reliability of service delivery.
Transmission capacity is a scarce resource whose pricing and allocation pose a very challenging problem. Not only is the problem itself very intriguing, but determining a solution or a solution set, is also very interesting especially when various versions of market setup are considered. This thesis will focus on two setups that form the basis for two qualitatively different ways of transmission service and pricing in the evolving energy markets: One, where there is a central decision maker and one where distributed decision making by the smart system users is allowed. Even though the setups are very different, the decision makers in both cases are faced with the same basic question of allocation of transmission capacity. Briefly, the goals are to:
• In a coordinated setup: From a Transmission Service Provider (TSP) point of view, find the optimal capacity allocation between selling long term forward contracts for delivery prices ex ante and selling delivery rights in the spot market priced ex post depending on the real time congestion levels determined by the real time demand, supply and system-related reliability constraints.
• In a distributed setup: From a system user point of view, a generator or a consumer, find the optimal combination of buying rights to transmit power through long term
contracts or by buying transmission service in the real time market price determined by other users’ demand and system reliability.
The challenge of finding the right combination of long term forward contracts and the real time spot market for transmission service is parallel to the challenge observed, in the forward and spot energy markets. We assume existence of an electricity daily spot market as well as the longer-term bilateral contracts between suppliers and consumers. The scope is limited to bilateral contracts and does not include multi-lateral ones nor any arbitrage activities by intermediary trading bodies. In order for the supply/demand transactions at the energy level to be implemented, arrangements must also be made for their delivery from the supplier to the consumer at the transmission leve l. Although the two mechanisms seem similar, transmission service allocation is more complex due to high number of interactions as well as due to strict technical constraints of the network. And while much progress has been made in the energy trading, transmission service allocation is not as well studied and requires much work on the formulation side to lay the foundations for development of practical algorithmic tools.
In this thesis, the goal is to design the tools at a formulation level. Transmission service and its pricing to the electricity market participants are posed as a stochastic optimization problem. The uncertainties of the system stem from both market activities of other users and from the uncertain equipment status. The theory of dynamic programming is utilized extensively to structure the stochastic optimization functions.
1.1 Problem Statement
The goal is to detail the optimal allocation of transmission line capacities to maximize the objective function of the decision maker within system constraints. Since the two setups described above have different decision makers, there are two sub problems to define under the problem statement:
1.1.1 Centrally Coordinated Operation
The centrally coordinated operation can be represented as shown in Figure 1.1 where boxes define functions, and arrows define inputs. The system users submit service requests from
which the decision maker chooses those that maximize his revenue and those that can be implemented without stability problems, and this forms the U function. S maps those chosen injections to line flows.
Figure 1.1: Decision Flow in the Coordinated Model.
From S(U(X)), the system revenue, RevenueSystem(
f
1(S(U(X)))) can be derived and itcan also be seen that U has ensured that resulting line flows are within limits as well as that it tends to maximizing revenue. All components of the formula are dynamic with changing values requiring use of expected values in the above formulation. Unlike this approach, the majority of the literature for electric power transmission provision assumes a type of centralization but treats the problem as a deterministic, non-linear static optimization, as does the optimal power flow analysis [37].
1.1.2.
Partially Distributed Operation
Below is the representation of the distributed decision-making. The price signal for using the transmission from a supervisor is communicated to the system users, so system user at each node i uses this data and expectation of the other users actions to make his decision xi = f2(P,xj) , for all nodes j.
Figure 1.2: Decision Flow in the Distributed Model. User Input x1 User Input xN User Input x2
.
.
.
.
Decision Maker Selection Control Function UX
U(X)
Physical Systemwith Uncertainties S S(U(X))
X
Physical System with Uncertainties S S(X) Price Signal P User Input x1 User Input xN User Input x2.
.
.
.
As it can be seen, that there is no central control that ensures the results of S(X) to be within system limits, which is the main challenge in the distributed model. The responsibility of making sure that system constraints are met is left to the price signal whose calculation is crucial. Distributed control of the transmission syste m is a rarely studied problem due to its complexity and high level of uncertainties. Allocation of network resources in a distributed manner between real time and forward market is a very new approach that is presented in this thesis.
1.2 Thesis Summary and Contribution
Currently, there is no tool deployed in decision making for bilateral agreements along with spot market trades. This is due to the fact that the volume of bilateral agreements is still not a major part of the electricity market. However, we believe that the use of such long-term contracts, both physical and financial will increase in the future under the deregulated regime. This evolution requires better planning and scheduling to which the dynamic programming algorithm is a solution. Besides developing decision-making tools for optimal allocation, we also intend to contribute, through this thesis, models and frameworks for both central coordination and distributed control of the transmission network. In addition, what distinguishes the problem formulation in this thesis from many other existing references is the consideration of system uncertainties in these models.
Chapter 2 provides the background for the overall setup and technical tools as well as the framework that the thesis presents. Chapter 3 formulates the basic problem of resource allocation in a centrally coordinated setup, where transmission service provider (TSP) is the decision maker. This chapter points out the computational issues faced by the implementation of the formulations and offers some approximation approaches. Chapter 4 again builds the decision-making problem for a central body, but this time factors in the physical, reliability-related, uncertainties of the system. This new version requires some background on electric power system reliability and risk in transmission networks, which is included in Chapter 4. Both Chapter 3 and Chapter 4 define the problem of resource allocation fully, but assert that in a market environment distributed decision-making might be as effective and also could alleviate the computational issues. Chapter 5 explores and formulates the distributed decision making problem. Chapter 6 demonstrates the strength of the proposed methods through
simulations and Chapter 7 concludes the thesis. Appendix A has the source code for the simulations.
Chapter 2
Transmission System Design and Tools
This chapter provides the definitions and setups proposed for the transmission capacity market. It presents a set of current tools that are used to operate the market and points out the need for new tools. The chapter also provides background to the technical tools that are used in the thesis, namely dynamic programming and optimal power flow analysis.
2.1 Overview of Electricity Markets
The optimization suggested under both the coordinated and the distributed schemes is proposed in a market setup in which the TSP offers long-term bilateral contracts at a premium to enable the load and the supply to hedge against the volatility of the spot prices [35]. As mentioned before, the roles of the intermediary traders and secondary markets are excluded for this analysis and that leaves only three players to analyze, the supply, the load and the TSP. Two types of transactions will be available to the market players:
1.Long Term Bilateral Contracts: These are contracts between a supply-load pair that designate the obligation of supply to produce a certain amount of power at a negotiated price for a defined time period in the future. These energy contracts are matched with transmission right contracts to deliver the chosen quantity. The failure to provide this service will incur a penalty to the TSP. For this study, the agreements can be established only between nodes that are physically connected with a single line, and agreements between three or more parties are not permitted. And the price of any contract, in this thesis, refers to the injection price the users are willing to pay the TSP for the access to transmission service.
2.Real Time Spot Market: This is the traditional regulated spot market where demand meets supply and market clears at a spot price determined by demand and supply curves. The price depends on the cost functions as well as on the demand elasticity functions of the loads. The spot transmission service market matches the energy spot market to provide the capacity. Like in any market environment, the level of demand, which is stochastic, determines the demand for the price of the transmission service.
The load and supply can choose which type of transactions they would like to participate in between the deterministic risk-free bilateral agreements at a premium and the risky spot market at the market clearing price. In other words, the generators generally produce for both the spot market and the bilateral agreements, similarly the loads buy their electricity through both types of setups. They do this in a fashion to maximize their individual welfare functions. Under the coordinated setup, the TSP also makes decisions to determine whether to allocate its resources, line capacity, to the bilateral agreements requests or to the spot market participants again to maximize its revenues.
2.2 Time Frames and Event Characteristics
The decisions of the players belong to either one of the time frames, season-ahead or the near real-time. Season-ahead decisions are made using forecasts of market behavior that also include the uncertainties of the physical system. They are either concerned with provision of a service or with the risk hedging for the future. Season-ahead decisions by the transmission system owner dictate how its lines will be allocated between the forward market and the spot market as well as which long term contracts to choose among all requests. The system users make a set of similar decisions. The loads decide from whom to obtain their power and how much they are willing to pay for it. The generators decide to whom they should sell their power to, at what price and for how long. Both users also determine their priorities for the transmission service in light of the uncertainties. In this thesis, season ahead planning is considered long term; whereas, long-term decision-making has been traditionally thought of as investment level decision making for long horizon projects. The incentive for investment or recovery of investment in transmission system is not studied in this thesis. Moreover, since the long-term in the thesis is about three months, a season, discounting of the costs and revenues are ignored.
Near real-time decisions are modifications made to long-term decisions as more current information becomes available in addition to the spot market. With more information, load and supply may decide to call off a bilateral agreement or establish one, similarly the TSP can decide to curtail an agreement it had accepted before or respond near real-time to near real-time decisions made by the other players. Most of the actions taken by the TSP in the short run will be to deal with congestion appearing in the system, and calculating profit
through congestion charges and ensuring reliable service. For example, if a load believes that spot prices will be high in the next period, it may choose to strike a bilateral agreement and the supply side might find this acceptable, as it will itself hedge against the risk of elastic load. In another setting, the TSP can decide to curtail a bilateral agreement with the expectation of making higher profits in the spot market even after paying a penalty.
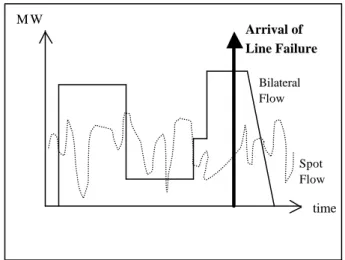
The motivation for the players to operate in these two different dimensions is a result of the volatility of the spot market. It is an attempt to avoid congestion ahead of time or be at least prepared for it. Not only does the existence of two options make it harder for the users to plan cleverly, but it also makes any system optimization hard. Including these two different time frames in the same optimization function, each having different characteristic, is very challenging. As there are different times frames to consider, looking at it more closely, it can be seen that spot market and long term bilateral market inputs have very dissimilar characteristics in the way they evolve in time. The bilateral agreements can be treated as asynchronous discrete events that start and end at certain times; whereas, the spot market is a continually evolving continuous time input. These two market inputs come together in terms of continuous flows in real time, but in analysis they present a hybrid system model that lends way to a discrete event dynamic system (DEDS) formulation. In this context, the control for discrete inputs to the system is determined by the current state of both continuous and the discrete elements [12]. Looking at these more closely:
Time Driven Spot Market:
topology physical the of state the is at time agreements bilateral of control the is generation system total the is demand system total the is flows the determines and nodes between flow Continuous 1 1 T(t) t u(t) (t) P (t) P T(t)) (t), u(t), (t), P (P f (t) F f j. i F G D G D ij j i = =
Event Driven Bilateral Agreements:
state.
current
the
determine
to
events
incoming
the
it to
applies
and
period
time
pervios
on the
based
control
the
determines
1
t;
at time
d
implemente
is
t
vector tha
agreement
bilateral
the
defines
2 2u(t)
f
(t), u(t))
), BA
(
f
BA(t)
BA(t)
new=
Total System Control:
ij.
all
for
F
|
(t)
F
|
2.
(t)
P
(t)
P
1.
s
constraint
system
the
respect to
with
max
U.
space
control
total
over the
revenue
system
the
maximizes
system
hybrid
for this
control
Optimal
max ij ij G D 3=<
=
=
∑
∑
t))
(BA(t), u(
f
(t)
R
U systemWhile the above expressions define a complex problem, when looked into the function f3, it is observed that the available computational tools to calculate system revenue
of the real time flows, cannot handle a hybrid market definition. Rather total system dispatch control uses a discretized version of the continually-evolving real time spot market. (This refers to the optimal power flow analysis that uses a snapshot of the system to determine optimal operational dispatch, thus highest profits. Please see later Section 2.3.2.) Moreover, function f1 is also hard to use due to the non-linearity it exhibits with the distribution factors.
This is the main motivation behind abandoning a DEDS formulation of a hybrid system. We prefer to use discrete models for all inputs and the system to make use of the optimal power flow analysis for revenue calculations of the spot market. Our model treats the bilateral agreements the same as the hybrid model, but instead of a continuous treatment of the spot market, it takes snapshots of the spot market at fixed time intervals and combines it with the bilateral discrete inputs to develop a dynamic programming approach.
2.3 Reliability and Uncertainties
There are two kinds of reliability that are considered in the thesis. One is the reliability issues arising from physical uncertainties, second is the reliability issues related to the usage of the system determined by system inputs, which can be at normal operating conditions or lead to network congestion.
2.3.1 Physical System Uncertainty
In both the centrally coordinated and the distributed modes of operation, TSP needs to model its system accurately to insure system reliability and incorporate risk of its system into his objective functions. In the coordinated scheme, as the decision maker, TSP, has to know the uncertainties inherent to the system, i.e. equipment outages, in order to make sound long-term decisions. Similarly, in the partially distributed set-up TSP is responsible for sending the right price signals, which have the incorporated information about the system conditions. Uncertainties inherent in the grid are numerous, but this thesis will focus on line outages as a subset of equipment uncertainties only. Methods developed in this sub-case can be extended to substation, generation outages and their likes. We consider the line outage problem to be the most complex because the effect of any outage event effects the system topology, i.e. it determines how well the system can absorb and cover up for that outage. A line outage could be viewed as a high impact, low probability uncertain event and cannot be ignored as TSP develops his decision tools for serving electricity market participants, studied in Chapter 4. In [19] it is shown how due to a line outage, the topology of a transmission network can change so drastically that some isolated parts of the network can be formed where some generations units can exert market power and become monopolies even in a competitive energy environment. This is a perfect example why transmission reliability is a big issue. Chapter 4 will go into detail about line outages and their incorporation into the decision-making process.
The concept of reliability is a big topic in itself and a revisit to the current reliability tools is necessary due to the unbundling of the reliability services in the industry. The currently practiced (N-1) reliability test requires that the grid be used under normal conditions (prior to any equipment outages) somewhat conservatively; the reliability test requires sufficient generation and transmission reserve capacity in a stand-by mode in order to supply the consumer in an uninterrupted way in case any single equipment outage takes place. The regulated industry approach to reliability treated transmission system and generation systems as a single unit and collected the work under bulk system reliability analysis. Under the vertically integrated utility, this makes sense because then, if one line of the transmission system owned by utility A were to fail, then utility A would re-dispatch its own generator units in the area to make sure that all the loads were served. Since this was
possible, they used a conservative method to run their system: the (N-1) security criteria. This method suggests that the maximum operation be bounded by the limits imposed on the system derived from cases where there is loss of a major component of the bulk system, mainly lines and generators. [20] ana lyzes some of these issues in depth. Chapter 4 suggests a less conservative reliability analysis.
2.3.2 Market Input Uncertainty
Market uncertainties can be grouped in two classes: 1) Spot Market Uncertainties
2) Bilateral Agreement Uncertainties
Spot market uncertainties capture the volatility of the real-time operations. Changing demand and changing supply result in a rapidly varying behavior. Figure 2.1 shows the load diagram for a week in May in New England [33].
Figure 2.1: Load diagram for a week in May, New England
And Figure 2.2 shows a plot of average 24-hour load patterns for each month in New England [33]. 0 2000 4000 6000 8000 10000 12000 14000 16000 1 2 3 4 5 6 7
Day of the week
Load (MW)
Figure 2.2: Average monthly patterns of daily load, New England
Bilateral uncertainties refer to the possible quantity, price and duration parameters that any BA can take. In addition, the unknown arrival time of the agreements is another element of uncertainty.
2.4 Technical Background
A brief background is appropriate to introduce two tools used in the thesis. Dynamic Programming is a decision making tool. The optimal power flow analysis is an optimal dispatch tool used by the transmission operators.
2.4.1 Dynamic Programming and Curse of Dimensionality
The formulations of the resource allocation problems studied in the thesis are posed as dynamic programming problems. Dynamic Programming (DP) is a very effective way to pose problems that feature discrete-time dynamic systems with additive cost over multi
0 5 1 0 1 5 20 25 0 5 1 0 15 0.6 0.8 1 1.2 1.4 1.6 1.8 x 10⁴ Hour Daily load shape, Mu
Month
stages. These problems involve decision making at each stage whose outcome depends on other parameters of the future stages. Therefore, the desirability of any current decision is calculated by their current cost and expected future costs. It is important to state the notation of the DP formulations beforehand. k designates the discrete time index taking values between 0 and N. x is used to describe the state of interest, u the control or decision variable, belonging to an admissible space, that evolves x into future states. w is the random noise that introduces uncertainty. Function g calculates the per stage cost, g(x,u,w). The optimization function can now be represented as [3]:
The strength of the formulation comes from the principle of optimality where optimal solutions to tail sub-problems can all together define the overall optimal solution:
This is the objective function form that is used in this thesis for network allocation formulations and the algorithms for their simulations. While the expression looks compact, it is usually hard to find a closed form representation of J which leads to enumeration based methods. Computational effort can get very expensive with bigger control space and longer time periods, higher k, hindering the desirability of DP. Such cases are classified under the Curse of Dimensionality, which will be referred to in the thesis to motivate approximation methods.
Please note that the dynamic programming formulations, in this thesis, are defined in discrete time. One can think of the whole time horizon as a season and each time increment can be a day. If there are T days in a season the optimization will go from k=1 to k=T. The definitions belong to a system with NG generators and NL load, demand, nodes.
( )
( )
(
)
+ =∑
− = ∈ 1 , , min N k i i i i i N N u k g x g x u w x J k ε U (2.1)( )
( )
( )
{
k(
k k k)
k(
k(
k k k)
)
}
u k k N N N Nw
u
x
f
J
w
u
x
g
x
J
x
g
x
J
k,
,
,
,
min
+1 ∈+
=
=
ε
U (2.2)2.4.2 Optimal Power Flow
The use of Optimal Power Flow (OPF) has increased with deregulation where the solution of this static optimization reveals the locational-based marginal prices of electricity (LBMP) which are considered to be optimal prices under perfect market assumptions. This solution also is called the economic dispatch. The idea is to aggregate all the demand and supply bids for resources at a single node in the system to determine the market-clearing price for that node using generation cost functions. This price then in return determines the injections and withdrawals that optimize system operation and maximize social welfare. These are also called the spot market prices and quantities. Let NL be the load nodes and NG the supply
nodes, given the demand at each load node
{
}
T L L L L NP
P
P
,
,
1L
=
the optimal generation dispatch is∑
( )
=
=
NG i i i G G G G P Pc
P
1 min arg * withsubject to system constraints :
1) Load-Generation Balance
∑
∑
= ==
G i l j N i G N j LP
P
1 12) Line Capacity Limits Pij ≤ Pijmax
Any time the thesis refers to the calculations of spot prices, spot injection, the above optimization is used. For large systems of many nodes, this optimization can also get very costly [36]. Given these tools, the specific problem formulations of interest in this thesis can be derived.
Chapter 3
Coordinated System Operation with Static Topology
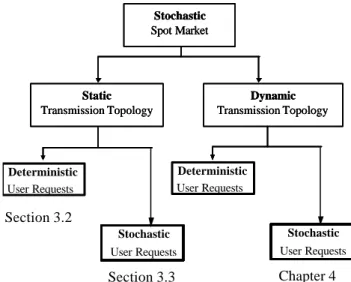
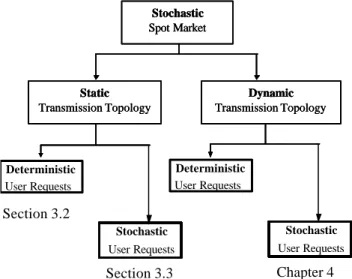
This chapter formulates an approach to a centrally coordinated transmission allocation. Depending on design, the formulations differ as a function of uncertainties considered. Figure 3.1 shows the tree of uncertainties. This chapter develops the tools under the static topology assumption. Computational issues and some solutions to the above cases are discussed.
3. 1 Coordinated Decision Making by the TSP
This centralized scheme is a direct extension of the TSP’s role as a transmission provider in a regulated industry. The new component is the operation of bilateral agreements that allows the TSP to collect a profit other than charging the spot market users for transmission service. Bilateral and spot markets both influence the quantity of power flow on the lines, which have a certain carrying capacity. The higher the congestion on one line, the higher the price due to high demand for the line flow usage. Even though it may seem that the TSP would like to use as much of its lines as possible, thus accept any incoming bilateral and spot market requests,
Static Transmission Topology Dynamic Transmission Topology Stochastic Spot Market Static Transmission Topology Dynamic Transmission Topology Stochastic Spot Market Static Transmission Topology Dynamic Transmission Topology Stochastic Spot Market Deterministic User Requests Stochastic User Requests Deterministic User Requests Stochastic User Requests Figure 3.1: Tree of Uncertainties
Section 3.2
a different scheduling system is shown to yield higher revenue. Bilateral agreements that are accepted in one period of time, e.g. a day, might impact the line congestion levels of the next. While maximizing revenue for one period, they may decrease it for the next compared to the case where the agreement had not been accepted. Or, an agreement may take up capacity that would be more profitable to sell later to another party. This is analogous to the problem of asset allocation among investments.
In short, we are looking at a finite horizon, multi stage decision-making problem under uncertainties for the TSP. The goal is to a build a tool and a framework where the system revenue is maximized, season-ahead, by the TSP who chooses the optimal combination of the incoming bilateral agreements, implements them in addition to the spot market in consideration of limited transmission resources. Using dynamic programming tools, this near real time resource allocation problem can be solved effectively.
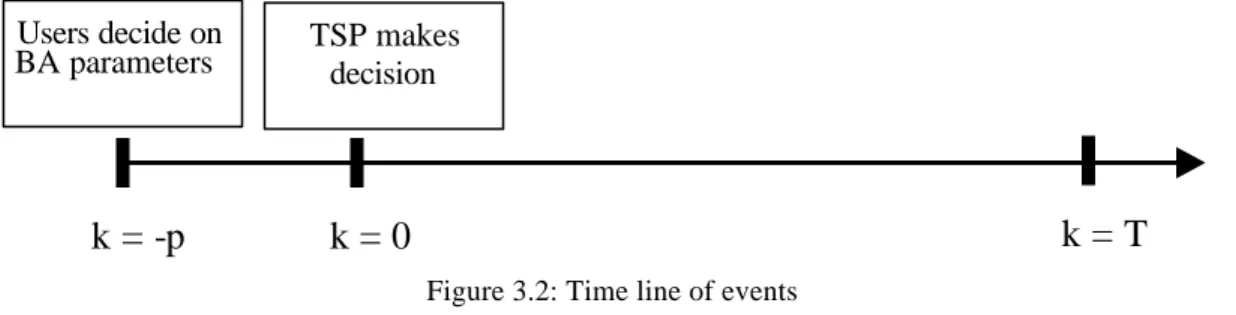
Figure 3.2 shows the procedure under the coordinated scheme. At time t = -p with reference to the beginning of the season at time t = 0, system users decide on the parameters of the bilateral agreements they would like to participate in. These parameters are quantity, price to be paid as access fee to transmission network, the start and end time of the contract. Under this setup, the resource allocation optimizations carried out by the system users while determining the agreements they would like to arrange, is not discussed in detail. For centrally coordinated operation, this simplification is acceptable since TSP has the final word in deciding which agreements get implemented. Sections on priority pricing and decentralized models attempt to detail user decision-making processes in Chapter 5.
Under the assumption of static physical system topology, once the supply and demand units make their own allocation decisions season ahead, two variations of centrally coordinated operation can be designed:
k = 0
k =
-
p
k = T
Users decide on
BA parameters TSP makes decision
Case 1: Users communicate their contract information to TSP between t=-p and t=0. This is depicted by Deterministic user requests branch in Figure 3.1. (Section 3.2) Case 2: Users do not communicate any information. This is depicted by Stochastic user requests branch in Figure 3.1. (Section 3.3)
Under both cases, rejection of an agreement prior to its start does not incur any compensation payments to the TSP; whereas, curtailment in real time requires compensation. To compensate, TSP agrees to provide the service demanded by the load from the spot market at the load bus.
3.2 Deterministic User Requests
Users inform the TSP of the agreements they would like to buy transmission service for. TSP can then go ahead and use this information combined with forecasted spot load to determine the optimal decision-control path. In a system of NG generators and NL loads, TSP objective
function is as follows:
uij [k]: The control decision of accept of rejecting BAs injecting at bus i and withdrawing
at bus j at time t = k.
Z [k] : The vector of bilateral agreements whose elements are
Zij[k] = [ Q Z ij[k], P Z ij[k], tr Z
ij[k] ] which are the BAs communicated to the TSP and
begin at t = k.
X [k] : The vector of BAs, which have been accepted by TSP prior to k, and TSP has the
responsibility of delivering this service whose elements are: Xij[k] = [ QXij[k], PXij[k], trXij[k] ].
PWs [k] : The column vector of probable spot prices for all buses in the system PWsi[k]. PWsi[k] is a row vector of b possible spot price values with probabilities ?:
PWsi[k] = [ (PWsi,b[k], ?i,b[k]) ] for all b.
QWs [k] : The vector of probable spot demands for all buses in the system QWsij[k], injected
from bus i to bus j at t = k in the spot market. QWsij[k] is a row vector of c possible
values with probabilities f :
Ws[k] : Vectors that capture the randomness in PWs [k] and QWs [k].
The performance to be maximized is the revenue collected by the system. The revenue has two flows: One from the execution of the agreements, and the other from the spot market at that time period. These two elements need to be related since the transmission capacity used up by the bilateral agreements has an influence on the spot prices and therefore the revenue. Optimal power flow calculation is used to calculate the spot market revenue taking into consideration the line capacities altered by acceptance of the bilateral agreement. The seasonal revenue is maximized over the decision space U. The decision space contains the decisions TSP makes as to whether to accept or reject BAs. The first line in the expression defines the revenue collected from the agreements that are accepted at time t = k . The second line defines the revenue collected from agreements already being implemented and last line defines the expected revenue collected from the spot market as a product of nodal price differences between the injection and the withdrawal bus and the expected quantity carried between them:
Given the above cost function, the detailed dynamic programming algorithm is as follows (3.2):
(
)
{
}
(
)
{
N
N
}
i
j
j
i
F
[k]
Flow
k
Q
k
P
k
P
k
Q
k
P
k
Q
k
P
k
u
R
k
R
k
R
R
L G ij ij k ij W ij W j W i ij X ij X ij ij Z ij Z ij ij W season W U k S BA season S S S s s≠
∈
∀
≤
−
+
+
=
+
=
∑
∑
∑
∑
∑
,
,
.
subject to
]
[
]
[
]
[
]
[
]
[
]
[
]
[
]
[
]
[
]
[
max maxarg
ε
ε
(3.1)
The above expression does not explicitly show the optimal power flow analysis that determines the spot prices and quantities for the purpose of compactly expressing the algorithm. (Note: This particular definition partially violates the elements of the disturbance matrix to be independent from one another since it is well studied that spot market behavior of consecutive time periods are related. This will be corrected in Section 3.4.4 under the discussion for state augmentation.)
(
)
(
)
{
}
(
)
(
)
(
)
{
[
],
[
],
[
],
[
]
1
(
[
],
[
],
[
],
[
]
)
}
]
[
max
arg
])
[
(
)
(
)
(
:
equality
s
Bellman'
it with
combining
and
expression
go
-to
-cost
determine
to
together
functions
cost
the
Putting
]
[
]
[
]
[
]
[
]
[
]
[
]
[
]
[
]
[
],
[
],
[
],
[
:
becomes
function
cost
The
1
]
[
]
1
[
1
]
[
0
]
[
]
[
]
[
1
]
[
])
[
(
:
commitment
the
update
or
agreement
an
s
terminate
T
where
]
1
[
])
[
*
]
[
(
])
[
(
]
[
],
[
],
[
:
function
evolution
State
]
]
[
]
[
]
[
[
]
[
:
BA
Incoming
Expected
]
]
[
]
[
]
[
[
]
[
:
State
Current
S Wg
k
k
k
Z
k
k
J
k
f
k
k
Z
k
k
k
u
k
k
J
N
N
g
N
N
J
ij
k
S
W
ij
Q
k
S
W
j
P
k
S
W
i
P
ij
k
X
ij
Q
k
X
ij
P
ij
k
Z
ij
Q
k
Z
ij
P
k
ij
u
s
W
k
k
Z
k
k
g
s
W
k
tr
k
tr
k
tr
k
t
k
P
k
Q
k
tr
k
T
k
k
Z
k
T
k
T
k
Z
k
k
f
f
k
t
k
P
k
Q
k
Z
k
t
k
P
k
Q
k
X
ij ij ij ij ij ij ij Z ij Z ij Z ij ij X ij X ij X ij ijs
W
u
X
s
W
u
X
X
X
X
s
W
u
X
X
X
u
X
u
X
+
+
=
=
∑
−
+
∑
+
∑
−
=
+
→
>
=
=
=
→
≤
=
+
=
+
=
=
=
=
ε
ε
ε
The uncertainty in the spot market requires the decision to be done over the expectation space for the spot market parameters. (The physical system uncertainties were
not included in the formulation, which is relaxed in Chapter 4.) Effectively under this version, TSP solves an optimization function over the decision space to develop a simplified tree similar to one shown in Figure 3.3 for a 2-Bus system.
The tree structure in Figure 3.3 shows how the size of the dynamic programming tree grows exponentially with the number of nodes in a system and linearly with the number of time periods. Not only are there a high number of nodes, but also while building the DP tree, each revenue calculation at each node requires probabilistic optimal power flow analysis, which involves iterations of the non-linear OPF optimization for all probable values. This introduces high level of complexity to which solutions such as ordinal optimization, approximate dynamic programming and perturbation analysis are being considered as a remedy. For practical purposes, assume that the black nodes in Figure 3.3 are the expected revenues over Ws. Once the dynamic programming tree is completed, the algorithm does the
backward walk from the leaves of the tree to the root to determine the possible maximum accumulated revenue, and chooses the associated optimal decision vector. It is important to expand the tree in Figure 3.3 to really show the branching without the aggregation of
k = 1,2,3,4
Incoming BA
12Incoming BA
21 k 5 10 k 5 10 . . . . . . . k= 1 k=2 k=3(D
12, D
21) =
Decision Pair (A,R) (A,R) (A,A) (R,A) (R,R) (R,A) (R,R) (R,R) (R,R) MW MW (A,A) (R,A)k = 1,2,3,4
Incoming BA
12Incoming BA
21 k 5 10 k 5 10 k 5 k 5 10 k 5 10 k 5 k 5 10 . . . . . . . k= 1 k=2 k=3(D
12, D
21) =
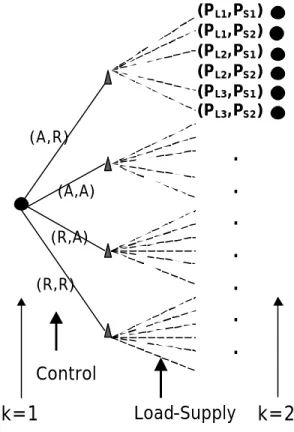
Decision Pair (A,R) (A,R) (A,A) (R,A) (R,R) (R,A) (R,R) (R,R) (R,R) MW MW (A,A) (R,A)expected values at each node. The detailed dynamic programming tree depicting the uncertainties in the spot market for a 2-Bus system is shown in Figure 3.4. This is for a situation where there are 3 possible load levels each with probability PLi and 2 possible
supply levels PSj. The triangle states depict the state changes due to different controls, and the
circle states depict the probabilistic states due to the uncertainty in the state parameters. To attach more meaning, the triangle states would describe the ‘accept’ or ‘reject’ decisions of the bilateral agreements whereas the circles would be different spot revenues for a given control branch. Note the timing of these branching, control branches evolve the state from time t to t+1 , but the state uncertainty branches do not involve a decis ion but rather can be thought of as happening in the same time period.
Please note that both trees are constructed by the same amount of computation. For the 1st tree, probabilistic OPF simply samples the probability distributions and runs OPF for each sample and brings the results together at the end to form a result distribution; thus the
(A,R) (A,A) (R,A) (R,R)
k=1
Control
(PL1,PS1) (PL1,PS2) (PL2,PS1) (PL2,PS2) (PL3,PS1) (PL3,PS2).
.
.
.
.
.
.
Load
-
Supply
k=2
expected values can be readily calculated. The second tree, instead, runs OPF for all possible values without creating distributions. The thesis will refer to the second tree with individual trajectories for the purpose of pictorially describing the computational issues.
At this point of the discussion, it should be emphasized once again that OPF is a simulation-based tool. (It simulates static optimization of the system without considering any temporal components.) It lacks control and learning mechanisms. But among all the drawbacks, the most significant disadvantage is that it is based on simulation rather than working with closed-form functions or distributions. This is because the optimization of OPF is nonlinear. When OPF uses the load and supply curves it does not use them on a functional basis but rather samples them. The answers are represented similarly where the resulting sample points are interpolated to form the resulting flow distributions most of the time after a series of refining linearizations. However, it is accurate to add that this method works well since rarely any load or supply curve can be represented as an explicit function with a distribution. Therefore extending the OPF to a probabilistic version leads to similar issues. Even if the probabilistic load and supply could be expressed in a compact distribution form, OPF would still sample this distribution and make simulations to get the resulting flows.
This section only considered the spot market uncertainty, assuming that the players would communicate their forward contract requests ahead of time. However, it is more realistic to assume that the system users will communicate the information about the agreements to the TSP at the time they would like to start it any arbitrary point in the season rather than the beginning of the season. This motivates the development of the model for stochastic inputs.
3.3 Stochastic User Requests
Relaxing the deterministic assumption, TSP now also needs to handle the random disturbance of bilateral agreements. The coordinator TSP still has the control to accept or reject the agreements as they come in, but season-ahead, TSP now tries to accurately forecast the disturbance for two purposes:
1.To achieve season-ahead planning so that TSP knows how to behave in response to requests for service overall.
2. Each day can be treated as the 1st day of a season that allows the TSP to make decisions about an agreement by looking at its impact on the system for a season-long window of time.
Before introducing some solutions and extension to the above formulations, it is important to visit the assumption behind TSP’s generation of possible bilateral agreements. For this case when TSP needs to develop its own forecast for the BA arrival process, he can use two methods:
1) Historical Cost Methods: TSP can refer to the past values for the bilateral agreements it served, or
2) Monte Carlo Projections: TSP can refer to tools that have been developed to study bilateral contracts and how the transmission company needs to do static tests to ensure that the operational security is not jeopardized. [13] presents a method of creating sample, random bilateral agreements vectors using Monte Carlo methods to evaluate the bounds of safe operation. [14] offers a mechanism to evaluate the impact of bilateral agreements on the system through sensitivity analysis. Monte Carlo simulations are used to create bilateral agreements. Linear programming and sensitivity analysis tools are used to measure if any agreement or set of agreements poses a threat to system security. Moreover, the transmission service provider can use these very tools not only to test situations but also to develop bounds and constraints as well as general rules for the operation of the bilateral contracts. This is very valuable for the TSP however, it is crucial to see that the mentioned approaches treat the bilateral agreements as being separate from the spot market and overlook their impact on real time flows with changing spot market characteristics which dynamic programming with stochastic spot market disturbance considers. That is why, this thesis motivates stochastic dynamic programming and gradual temporal learning from a tool, which couples real time and forward markets which can be developed by the below formulations:
Because TSP has control over the agreements, the disturbance from this input is treated differently than the spot market disturbance, Ws[k]. And the stochasticity in the BA requests
Y[k] : The expected incoming bilateral agreements at time t = k, Y[k] is a column vector of all Yij[k].
Yij[k] is a row vector of all n possible bilateral agreements from ij at k with their
associated probabilities ?:
Yij[k] = [ (Yij,n[k],?ij,n[k]) ] such that
(Yij,n[k], ?ij,n[k]) = ( [ QYij,n[k], PYij,n[k], trYij,n[k] ], ?ij,n[k]).
The optimization of the TSP now becomes an expectation both over random Ws and
and over controllable Y:
With this updated cost function, the detailed DP algorithm becomes (3.4):
(
)
{
}
(
)
(
)
{
N
N
}
i
j
j
i
F
[k]
Flow
k
Y
k
X
k
u
k
Q
k
P
k
P
k
Q
k
P
k
Q
k
P
k
u
R
k
R
k
R
R
L G ij ij ij ij ij ij k ij W ij W j W i ij X ij X ij ij Y ij Y ij ij W Y season W Y U k S BA season S S S s s≠
∈
∀
≤
=
−
+
+
=
+
=
∑
∑
∑
∑
∑
,
,
.
subject to
]
[
],
[
]
[
]
[
]
[
]
[
]
[
]
[
]
[
]
[
]
[
]
[
]
[
max , , maxY.
le
controllab
and
X
both
on
depends
µ
function
decision
Control
arg
µ
ε
ε
(3.3)
As seen above, DP formulation was able to capture all market uncertainties in the system. Control parameters partially handled the stochasticity in the bilateral market; and the
(
)
(
)
{
}
(
)
(
)
(
)
{
[
],
[
],
[
],
[
]
1
(
[
],
[
],
[
],
[
]
)
}
,
]
[
max
arg
])
[
(
)
(
)
(
:
equality
s
Bellman'
it with
combining
and
expression
go
-to
-cost
determine
to
together
functions
cost
the
Putting
]
[
]
[
]
[
]
[
]
[
]
[
]
[
]
[
,
]
[
],
[
],
[
],
[
,
:
becomes
function
cost
The
1
]
[
]
1
[
1
]
[
0
]
[
]
[
]
[
1
]
[
])
[
(
:
commitment
the
update
or
agreement
an
s
terminate
T
where
]
1
[
])
[
*
]
[
(
])
[
(
]
[
],
[
],
[
:
function
evolution
State
]
]
[
]
[
]
[
[
]
[
:
BA
Incoming
Expected
]
]
[
]
[
]
[
[
]
[
:
State
Current
k
k
k
k
f
k
J
k
k
k
k
k
g
Y
s
W
k
u
k
k
J
N
N
g
N
N
J
ij
k
S
W
ij
Q
k
S
W
j
P
k
S
W
i
P
ij
k
X
ij
Q
k
X
ij
P
ij
k
Y
ij
Q
k
Y
ij
P
k
ij
u
s
W
Y
k
k
k
k
g
s
W
Y
k
tr
k
tr
k
tr
k
tr
k
P
k
Q
k
tr
k
T
k
k
k
T
k
T
k
k
k
f
f
k
tr
k
P
k
Q
k
Y
k
tr
k
P
k
Q
k
X
ij ij ij ij ij ij ij Y ij Y ij Y ij ij X ij X ij X ij ijs
W
Y
u
X
s
W
Y
u
X
X
X
X
s
W
Y
u
X
X
X
Y
u
X
Y
u
X
+
+
=
=
=
∑
−
+
∑
+
∑
=
=
−
=
+
→
>
=
=
=
→
≤
=
+
=
+
=
=
=
ε
ε
ε
random system disturbance described the spot market uncertainty. As more uncertainty is included in the model, the size of the decision space becomes combinatorial which requires approximate solutions for a feasible implementation. This is the problem of curse of dimensionality.
3.4 Possible Approaches to the Curse of Dimensionality Problem
In general, there are two main obstacles in the application of DP. First is the size of the solution space, and the second is the complexity of the objective function J.
As seen from the above formulations and the growth order of the DP trees, determining the solution to the original DP problem leads to a computationally intractable problem classified as being NP-hard. An NP-hard algorithm is defined as a problem requiring the enumeration of some nontrivial parts of feasible solutions, which cannot be accomplished in polynomial time [18]. Thus, new approaches are needed to solve our optimization problem which becomes NP-hard even in finite horizon. Not only does the problem involve many computations increasing in time, but also this is a stochastic dynamic programming or stochastic shortest path, problem where controller does not deterministically define the next state with probability 1. Under the stochastic case, [4] probability of transition from state i to j with control u is given by a probability expression defined by the control and the previous state only; pij(u) = P(xk+1 = j | xk = i , uk = u ). Using this probability, one can also update the
cost function being used to g(i,u,j) such that cost is now also based on the next state. This is the essence of stochastic dynamic programming and developing Markov decision models. In TSP’s formulation, the transitions between states depend on Y as well as Ws in the current
definition. Since control aims to maximize revenue with respect to these uncertain disturbances, well-defined transition probabilities might be hard to obtain. In cases where clear patterns of probability of state transitions cannot be obtained, simulation based methods are used both building on the original well-defined cost functions and the approximate ones.[4]
This section first introduces Markov decision processes that from the basics for explaining approximation methods. Next simulation-based tools such as rollout algorithms are visited introducing different heuristics that replace the original control and cost functions and aim to reduce computation. Lastly, the basic issue of the complexity of the objective