HAL Id: hal-01130285
https://hal.sorbonne-universite.fr/hal-01130285
Submitted on 11 Mar 2015
HAL is a multi-disciplinary open access
archive for the deposit and dissemination of sci-entific research documents, whether they are pub-lished or not. The documents may come from teaching and research institutions in France or abroad, or from public or private research centers.
L’archive ouverte pluridisciplinaire HAL, est destinée au dépôt et à la diffusion de documents scientifiques de niveau recherche, publiés ou non, émanant des établissements d’enseignement et de recherche français ou étrangers, des laboratoires publics ou privés.
Changes in major depressive and generalized anxiety
disorders in the national French working population
between 2006 and 2010
Lucile Malard, Jean-François Chastang, Isabelle Niedhammer
To cite this version:
Lucile Malard, Jean-François Chastang, Isabelle Niedhammer. Changes in major depressive and gen-eralized anxiety disorders in the national French working population between 2006 and 2010. Journal of Affective Disorders, Elsevier, 2015, 178, pp.52-59. �10.1016/j.jad.2015.02.027�. �hal-01130285�
1
Changes in major depressive and generalized anxiety disorders in the
national French working population between 2006 and 2010
Lucile Malard (1,2,3), Jean-François Chastang (1,2), Isabelle Niedhammer (1,2)
(1) INSERM, UMR_S 1136, Pierre Louis Institute of Epidemiology and Public Health, Department of social epidemiology, F-75013, Paris, France
(2) Sorbonne Universités, UPMC Univ Paris 06, UMR_S 1136, Pierre Louis Institute of Epidemiology and Public Health, Department of social epidemiology, F-75013, Paris, France
(3) Université de Versailles St-Quentin, France
Correspondence to:
Dr. Isabelle Niedhammer
INSERM, UMR_S 1136, Hôpital Paul Brousse - Bâtiment 15/16
16 avenue Paul Vaillant Couturier
F-94807 Villejuif Cedex
France
Email: isabelle.niedhammer@inserm.fr
Word count: 4168, word count of abstract: 229 5 tables, 42 references
2 Abstract
Background. This study aimed at assessing the changes in mental disorders in the French working population between 2006 and 2010, using nationally representative prospective data and a structured diagnostic interview for major depressive episode (MDE) and generalized anxiety disorder (GAD), and also at exploring the differential changes in mental disorders according to age, origin, occupation, public/private sector, self-employed/employee status and work contract.
Methods. The data came from the prospective national representative Santé et Itinéraire Professionnel (SIP) survey, including a sample of 5600 French workers interviewed in 2006 and 2010. The Mini International Neuropsychiatric Interview (MINI) was used to measure MDE and GAD. Analyses were performed using weighted generalized estimation equations, and were stratified by gender.
Results. No changes in MDE and GAD were observed for both genders among the working population. No differential changes were observed, except one: the prevalence of GAD increased among women working in the public sector while there was no change among women in the private sector.
Limitations. Two data collections over a 4-year period may not capture the effects of the crisis on mental disorders properly.
Conclusion. No changes in mental disorders between 2006 and 2010 were found but the increase in the prevalence of anxiety among women in the public sector may be of particular interest for prevention policies. High levels of social protection in France might contribute to explain these non-significant results.
Key words: Changes, mental disorders, structured diagnostic interview, working population, France
3
Introduction
At the beginning of the current economic crisis, the World Health Organization (WHO) (WHO, 2009) declared that there may be “repercussions of the economic crisis on people’s health in the form of increases in mental health problems (stress, anxiety and depression) and physical symptoms (cardiac disease, disorders of the digestive system)”. Indeed, the economic crisis may have an impact on social determinants of health such as income, employment, education, nutrition, etc. The WHO also stated that vulnerable populations should be protected because of health inequalities. The report reminds that “investing in health is
investing in human development, social well-being and wealth” from the Tallinn Charter, thus investing in health could be one way to revitalize the economy, and to help recover from the economic crisis.
Research on previous economic crises showed increases in all-cause mortality and cause-specific mortality (except for traffic road fatalities), in particular in suicides, in times of economic recession, these increases were associated with economic factors such as unemployment rate (Falagas et al., 2009; Suhrcke and Stuckler, 2012; Uutela, 2010). For example, the study by Chang et al. (2009) suggested an association of the 1997-1998 Asian economic crisis with a sharp increase in suicide mortality in some East/Southeast Asian countries, and that these increases were most closely associated with rises in unemployment. Suhrcke and Stuckler (2012) also emphasized that economic crisis is likely to hit harder poorer countries and poorer, less educated subgroups of population.
To assess the repercussions of the 2008 economic crisis on health, ecological studies were carried out. Most of them found an increase in suicide rate in England (Barr et al., 2012), South Korea (Chan et al., 2014), the USA (Reeves et al., 2012), Greece (Vlachadis et al., 2014), Italy (De Vogli et al., 2013), Europe (Stuckler et al., 2011), and 54 countries
worldwide (Chang et al., 2013), particularly among men (Chang et al., 2013; De Vogli et al., 2013). However, the changes in suicide rate may depend on countries (Baumbach and Gulis, 2014); for some countries such as Finland, Slovenia and Bulgaria, suicide rate decreased between 2007 and 2010. In Hungary, no increase was detected but suicide rate was steadily decreasing until 2006 and then was stable between 2006 and 2011 (Fountoulakis et al., 2014). Finally, a study in Greece found no change in suicide rate between 2000 and 2010
(Fountoulakis et al., 2013), which may be due to a 2-year lag between the onset of the crisis and the rise in suicide rate as found in another study in Greece (Vlachadis et al., 2014). The
4 increase of suicide rate was found to be associated with GDP (Mattei et al., 2014) and
unemployment rate (Barr et al., 2012; Baumbach and Gulis, 2014; Chan et al., 2014; Chang et al., 2013; Fountoulakis et al., 2014; Mattei et al., 2014; Reeves et al., 2012), with a lag of 2 to 3 months (Chan et al., 2014) or 4 to 5 years (Fountoulakis et al., 2014).
Several studies exploring individual data assessed the changes in mental health during the 2008 economic crisis in the general population. Studies using diagnostic interview were seldom and showed increases in the prevalence of mood, anxiety, somatoform, alcohol-related disorders (Gili et al., 2013), major depressive episode (Madianos et al., 2011), and no change in suicidal ideation and attempts (Miret et al., 2014).
The increases in mental disorders were associated with unemployment (Gili et al., 2013; Miret et al., 2014), and with personal economic hardship such as mortgage repayment difficulties (Gili et al., 2013; Madianos et al., 2011). Indeed, since the 2008 economic crisis,
unemployment has risen from 7.2% to 9.6% in the European Union between 2007 and 2010 with disparities between countries, the increase was of +142.7% in Spain, +51.2% in Greece, +47.2% in the UK, +37.7% in Italy, and only +16.3% in France (Source: Eurostat).
Unemployment rate also varied unequally according to occupation, the unemployment rate of manual workers increasing more than the unemployment rate of managers and professionals in France between 2006 and 2010 (+17.5% vs -2.5% respectively) (Source : National
Accounts – Base 2010, National Institute of Statistics and Economic Studies).
In the general population, the studies using a diagnostic interview to assess mental disorders were seldom in this topic (Gili et al., 2013; Madianos et al., 2011; Miret et al., 2014) and no study used both a diagnostic interview and a prospective design. To our knowledge, the literature appears even sparser among the working population (Avčin et al., 2011; Chan et al., 2014; Milner et al., 2014; Modrek et al., 2015; Naswall K. et al., 2011; Vittadini et al., 2014; Wang et al., 2010) with few previous studies using national representative data of the working population or a prospective design, and only one study using a diagnostic interview (Wang et al., 2010). The results of these studies among the working population were mixed. Some of the studies showed an increase in mental disorders, other mental health outcomes, and suicide rate (Avčin et al., 2011; Chan et al., 2014; Milner et al., 2014; Modrek et al., 2015; Wang et al., 2010). However, other studies found no change in mental health complaints, and in use of psychotropic drugs (Naswall K. et al., 2011; Vittadini et al., 2014). Consequently, there is a major need for more studies among the working population that explore the association
5 between economic crisis and mental health using individual and prospective data, and
diagnostic interview. Indeed, mental health at work is a crucial issue involving substantial costs and consequences (Birnbaum et al., 2010; Kessler et al., 2006). It may be assumed that economic crisis may contribute to increase the prevalence of mental disorders. Evidence has been provided by the literature for the general population, but is still missing for the working population. This topic may be of particular interest given the burden of mental disorders at the workplace.
The present study is therefore an attempt to fill the gap in this topic among the working population. This study aimed at assessing the changes in mental disorders between 2006 and 2010, i.e. within the period of the 2008 economic crisis, using prospective national
representative data and a structured diagnostic interview to measure both major depressive episode (MDE) and generalized anxiety disorder (GAD), and also at exploring the differential changes in these two disorders according to age, origin, occupation, public/private sector, self-employed/employee status and work contract.
Population and methods
Sample
The study was based on the data from the prospective national representative SIP (Santé et Itinéraire Professionnel) survey, performed by the French Ministries of Labour and Health (DARES and DREES), the French Centre for Employment Studies (CEE) and the French National Institute of Statistics and Economic Studies (INSEE). This survey was designed to explore the complex associations between work and health (Coutrot et al., 2010). In 2006, households were randomly selected from the 1999 census, which was updated for new housings, and one individual aged between 20 to 74 years was randomly selected to be interviewed in each household. Finally, 13648 men and women from the general French population were interviewed by a trained interviewer at respondent’s home. The participation rate was 76%. Four years later, they were contacted again for the second wave of the survey, and 11016 individuals (81%) participated. Among them, 2679 men and 2921 women were working in both 2006 and 2010. Three studies by our team have already been published using these data (Malard et al., 2014; Murcia et al., 2013; Niedhammer and Chastang, 2014).
6 Mental disorders
The Mini International Neuropsychiatric Interview (MINI) is a structured interview for 17 major psychiatric disorders based on the criteria of the Diagnosis and Statistical Manual of Mental Disorders, 4th edition (DSM-IV) (Sheehan et al., 1998). In the SIP survey, the MINI was used for the diagnosis of MDE and GAD. The time frame was the last two weeks for MDE and the last six months for GAD.
Covariates
The covariates were age, origin (French or foreign), occupation (managers/professionals, associate professionals, clerks/service workers and manual workers), public/private sector, self-employed/employee status and work contract (temporary or permanent contract).
Occupation was coded using the French national classification of occupations that is close of the international classification (ISCO). The covariates were time dependent.
Statistical analyses
To be representative of the French general population of 2006, weights were calculated using marginal calibration and inverse probability weighting to control for the biases due to non-response in 2006 and to attrition in 2010 (De Riccardis, 2012). A marginal calibration on age, work status (working/unemployed/non-working)×age, urban area, size of household,
occupation and economic activity was performed on the sample in 2006. Homogeneous response groups were formed based on characteristics in 2006 (work status, urban area, age, level of education, gender and self-reported health), and the probability of being interviewed in 2010 was calculated for each group. Weights calculated by marginal calibration (for non-response in 2006) were multiplied by the inverse probability of being interviewed in 2010. Finally, a second marginal calibration on territorial unit, urban area, age×gender, education, nationality, and size of household was performed on the sample of individuals interviewed in 2006 and 2010 to be representative of the population of 2006. Weights were included in all statistical analyses.
Descriptive statistics were performed to present the study sample in 2006 and 2010. Rao-Scott Chi-Square tests were performed to explore gender differences in all studied variables.
To assess the changes in mental disorders (MDE and GAD), generalized estimating equations for logistic regression were used with unstructured working correlation matrix, the dependent
7 variable was MDE/GAD, and a binary variable representing the year (0=2006 and 1=2010) was the independent variable. The models were adjusted for age. The advantage of these models was that they took the correlation between the two measurements of a same individual into account.
To test whether the changes were different according to covariates, age, origin, occupation, private/public sector, employee/self-employed status and work contract were successively added in the models and an interaction term between the covariate and the year was tested. All these models were adjusted for age (continuous variable).
Additional analyses were performed using the whole sample of the general population (and not only workers) to assess whether the prevalence of MDE and GAD changed between 2006 and 2010 using weighted generalized estimating equations to be representative of the general French population of 2006. Other additional analyses were performed on the sample of workers in 2006 whatever their working status and according to their working status (working, retired or other non-working situations) in 2010, the changes in MDE and GAD was assessed using weighted generalized estimating equations and these analyses were stratified on working status in 2010.
As the prevalence of MDE and GAD differed according to gender, and as the changes in these disorders may also differ according to gender, all analyses were performed for men and women separately.
Statistical analyses were carried out using SAS 9.3 software (SAS Institute Inc, Cary, NC).
Results
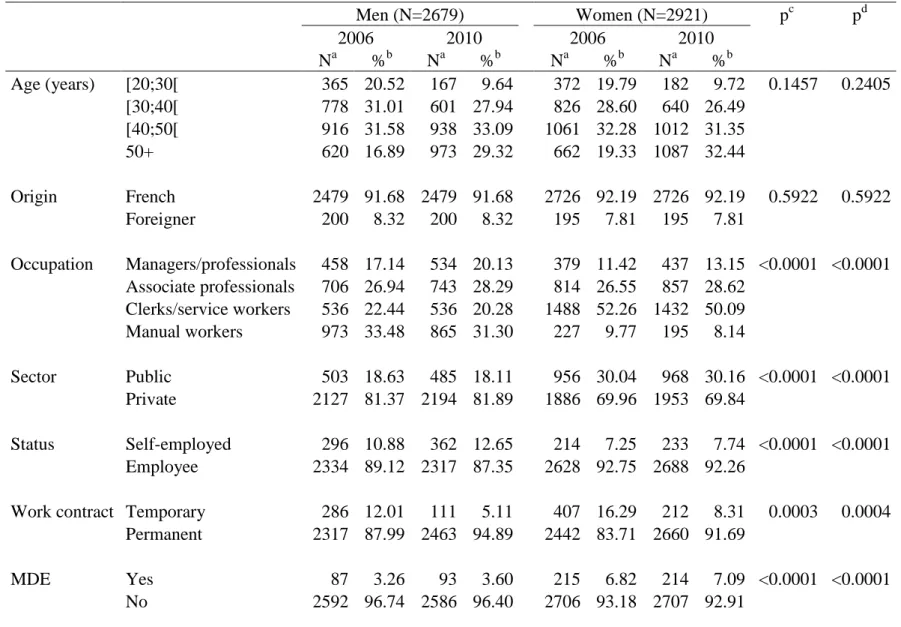
The study sample was composed of 2679 men and 2921 women working in 2006 and 2010 (Table 1). Significant gender differences were observed. Men were more likely to be manual workers and managers/professionals, and women were more likely to be clerks/service workers. Women were more likely to work in the public sector and to have a temporary work contract and men were more likely to be self-employed. The prevalences of MDE and GAD were almost twice higher among women compared to men. Indeed, among men, the
8 3.78% in 2010, and among women, the prevalences of MDE and GAD were respectively 6.82% and 5.66% in 2006 and 7.09% and 6.93% in 2010.
According to Table 2, there was no significant change in MDE and GAD among both genders, except among women, the prevalence of GAD increased significantly in 2010 compared to 2006. After adjustment for age, no change was observed in MDE and GAD for both genders between 2006 and 2010.
Table 3 presents the results of differential changes in MDE according to covariates. No significant differential changes according to age, origin, occupation, public/private sector, self-employed/employee status and work contract were observed. However, a differential change according to self-employed/employee status among women was borderline significant; indeed self-employed women had a lower prevalence of MDE in 2010 compared to 2006.
The differential changes in GAD are presented in Table 4. The only significant differential change was observed among women between the public and private sector: women working in the public sector had a significant increase in the prevalence of GAD while women in the private sector had no significant change in the prevalence of GAD.
In an additional analysis, we examined the changes in mental disorders (MDE and GAD) in the sample of the general population, and only found a slight increase in the prevalence of MDE among men from 4.24% in 2006 to 5.10% in 2010 (Table 5). Consequently, even for the general population, our results provided almost no change in mental disorders within the period 2006-2010. In additional analyses in the sample of workers in 2006 whatever their working status in 2010, no change was observed in MDE and GAD for both genders. After stratification on the working status (working, retired or other non-working situations) in 2010, we only observed an increase in the prevalence of MDE among men who were not working for other reasons than retirement (unemployed, in training, etc.) in 2010 (Table 5).
Discussion
Main results
No changes in MDE and GAD were observed between 2006 and 2010 in the French working population. However, the prevalence of GAD increased significantly among women working
9 in the public sector. Among the general population and among the workers who stopped working for other reasons than retirement, the only significant change was an increase in the prevalence of MDE among men.
Comparison with the literature
The comparison with the literature may be difficult because few studies were performed in the working population and only one used a diagnostic interview to assess mental disorders. In the comparison with the literature, we only considered studies in the working population, or studies using a diagnostic interview, or studies focusing on differential changes.
Unlike our study, most of the previous studies assessing changes in mental health during the 2008 economic crisis showed a deterioration of mental health, especially among men, but, to our knowledge, only seven studies provided information for the working population (Avčin et al., 2011; Chan et al., 2014; Milner et al., 2014; Modrek et al., 2015; Naswall K. et al., 2011; Vittadini et al., 2014; Wang et al., 2010) and among them, five studied mental disorders or mental health outcomes, and two studied suicide. Four studies used a diagnostic interview to measure mental disorders, one study in the working population (Wang et al., 2010) and the three others in the general population (Gili et al., 2013; Madianos et al., 2011; Miret et al., 2014). Among the five studies in the working population studying mental disorders or mental health outcomes, there was a Canadian cross-sectional study including 3579 employees from Alberta, that showed an increase in the 12-month prevalence of major depressive disorder and dysthymia measured by the WHO’s Composite International Diagnostic Interview-Auto 2.1 (CIDI Auto 2.1) from 2008 to 2009. No change in the 12-month prevalence of generalized anxiety disorder, social phobia and panic disorder was observed (Wang et al., 2010). Another cross-sectional study in the working population in Slovenia showed that depression and anxiety symptoms were more prevalent among those who reported being affected by the economic crisis (Avčin et al., 2011). A prospective study among workers from a
manufacturing firm in the USA showed that mental health inpatient and outpatient visits and the yearly supply of mental health-related medications increased among all workers after 2009 and that the magnitude of the increase in medication usage was higher for workers at plants with more layoffs (Modrek et al., 2015). In a retrospective survey in Lombardy, Italy, an increase in the use of psychotropic drugs, in particular antidepressants, was found but this increase was not different from the trend observed before the crisis (Vittadini et al., 2014). Finally, a prospective study among white collar employees in Sweden showed no increase in
10 mental health complaints between 2007 and 2009 but only a slight fluctuation due to
seasonality (Naswall K. et al., 2011).
Other studies assessed the changes in mental disorders in the general population. Using diagnostic interviews, the prevalence of anxiety, mood, somatoform and alcohol-related disorders increased in Spain (Gili et al., 2013), and the prevalence of MDE increased in Greece (Madianos et al., 2011), while no increase was found for the prevalence of suicidal ideation, planning and attempts in Spain (Miret et al., 2014).
Differential changes during the economic crisis were observed in poor mental health
according to social class and education for men in the general Spanish population (Bartoll et al., 2014), and in major depressive disorder according to marital status and gender in a sample of employees in Alberta, Canada (Wang et al., 2010). Lower social class, less educated, married and male people had a higher prevalence of mental health outcomes after the beginning of the economic crisis (Bartoll et al., 2014; Wang et al., 2010). No differential change in suicidal ideation, planning and attempts according to age was found in Spain (Miret et al., 2014). To our knowledge, no previous study explored the differential changes according to origin, public/private sector, self-employed/employee status and work contract.
If we consider suicide as a marker of mental disorders, several ecological studies showed an increase in suicide rate in the general and working population, often associated with an increase in unemployment (Barr et al., 2012; Chan et al., 2014; Chang et al., 2013; De Vogli et al., 2013; Fountoulakis et al., 2014; Milner et al., 2014; Reeves et al., 2012; Stuckler et al., 2011; Vlachadis et al., 2014). Moreover, differential changes in suicide rate were observed according to employment status, the increase in suicide rate was sharper among unemployed and economically inactive persons than among employed people (Chan et al., 2014; Milner et al., 2014), and according to age, the younger people being at higher risk in Europe and the older people being at higher risk in America (Chang et al., 2013). Our results showing an increase in the prevalence of MDE among male workers in 2006 who become non-workers for other reasons than retirement in 2010 may be in line with these previous studies (Chan et al., 2014; Milner et al., 2014).
Thus, the literature, composed of many ecological and few prospective studies, almost all in the general population, provided mixed results, but most of the studies reported a degradation of mental disorders or suicide rate. Our hypothesis was that mental health deteriorated
11 crisis, with potential increase of job insecurity, wealth loss, etc., especially among men who are traditionally considered as breadwinners. High levels of social protection might contribute to explain the non-significant results observed in our study. Indeed, it was shown that
spending more than $190 per head in active labor market programs could cancel the
association between the rise in unemployment and suicide rate (Stuckler et al., 2009). Other studies found that when social protection was low, the association between unemployment and suicide or mortality rate was stronger (Bambra and Eikemo, 2009; Baumbach and Gulis, 2014; Christodoulou and Christodoulou, 2013; Gerdtham and Ruhm, 2006; Kaplan, 2012). As France has high levels of social protection (Amar et al., 2014), the effects of the economic hardship on mental health might have been moderated or attenuated. Indeed, among the EU Member States, the level of social protection expenditure in relation to GDP in 2008 was highest in France (31.3%) and Denmark (30.7%) (Source: Eurostat). An example of the role of social protection in times of economic crisis is Iceland, the government invested in social protection (active labor market programs, programs to save people from homelessness, etc.) and no rise in suicides and depressive disorders were observed, unlike Greece or Spain where huge cuts were realized (Stuckler and Basu, 2013). Concerning the working population, in our previous study, few changes were observed in psychosocial work factors among men,
especially no increase in job insecurity was found, while psychosocial work conditions deteriorated among women (Malard et al., 2014). As psychosocial work factors are known to be risk factors of mental disorders, this might explain at least in part the non-significant results found for MDE and GAD for male workers in our study. There might also be a publication bias, studies with no significant results on the changes in mental disorders during the economic crisis might be more likely to be unpublished. Moreover, many studies were done in countries hardly hit by the crisis such as Greece or Spain, because the repercussions on health could have been important in these countries, thus there might be few studies done in countries with an economic situation and social protection levels comparable to France. Indeed, no increase in the prevalence of mental health complaints in white-collar employees was found in Sweden (Naswall K. et al., 2011), and a decrease in suicide rate was observed in Finland (Baumbach and Gulis, 2014), countries less affected by the economic crisis than other countries studied previously and with high levels of social protection, confirming our own results. Furthermore, if the economic situation had an impact on mental disorders, the lag between the onset of the crisis and the repercussions on mental health is not known, therefore our data collection in 2010 might have been too soon to capture the potential effects of the crisis. Indeed, the literature is mixed with lags going from 2 to 3 months to 4 to 5 years
12 between unemployment rate change and suicide (Chan et al., 2014; Fountoulakis et al., 2014; Vlachadis et al., 2014). In addition, social protection may have attenuated the short-term impact of the crisis on mental health but since 2012, social protection has struggled to play its role of shock absorber, thus the long-term effect of the crisis might be more pronounced in the years following 2010 as the crisis continues (Amar et al., 2014).
Strengths and limitations
To our knowledge, this study is the first prospective study exploring the changes in mental disorders over time in a national representative sample of the working population using a diagnostic interview and assessing the differential changes according to several subgroups of the population. Moreover, the response and follow-up rates (76% and 81%) were satisfactory. Furthermore, weights were included in all analyses to take potential biases related to non-response and attrition into account, and to allow a generalization of the results to the French working population of 2006. Finally, mental disorders were measured using a structured diagnostic interview based on the criteria of the DSM-IV whereas most of the previous studies used self-perceived mental health or symptom scales.
However, some limitations need to be mentioned. A potential selection bias might have
operated as 19% of the 2006 sample did not participate in 2010, this sub-group might have not participated because of a poor mental health thus leading to an underestimation of the results. However, weights were included in the analyses to reduce this potential attrition bias. A potential healthy worker effect may also be considered, as individuals excluded from the analysis because they were not working in 2010 might be more likely to suffer from a
degradation of mental health before leaving the labour market. Therefore, this could lead to an underestimation of our results. This assumption is supported by our analysis on the sample of workers in 2006 according to their working status in 2010 that showed an increase in the prevalence of MDE among men who were not working for other reasons than retirement in 2010. Moreover, our study was based on two data collections over a 4-year period and may not capture the effects of the crisis on mental disorders properly. Furthermore, the time frame for the diagnosis of the two disorders, and especially for MDE, may induce misclassification and lead to underestimated changes. Data collection periods and time frame for the diagnosis of mental disorders should be considered carefully in forthcoming studies. Finally, because of multiple testing, our rare significant results may be due to chance. However, some authors suggested that controlling for multiple testing may not be necessary in the case of an
13 exploratory study (Bender and Lange, 2001). Furthermore, as most of our results were non-significant, the issue of multiple testing may not be crucial.
Conclusion
In conclusion, no changes in mental disorders were found in the French working population between 2006 and 2010, except an increase in the prevalence of GAD among women in the public sector. These non-significant results might be explained by high levels of social
protection in France. Therefore, in times of economic hardship, some particular sub-groups of the population who may be considered well protected, such as the public sector workers, might be of particular interest for prevention policies.
14 Acknowledgments The authors thank Nicolas de Riccardis and the work group of the
DREES and DARES for their help and advice with the SIP dataset. The authors thank the members of the DARES, DREES, CEE and INSEE, and all the people who participated to the SIP survey and made this study possible.
Conflict of interest: None.
Funding body agreements and policies: This study was founded by the French ministry of labour (DARES, grant no 2200727156) and Université de Versailles Saint-Quentin (Lucile Malard’s PhD thesis). DARES and Université de Versailles Saint-Quentin had no further role in study design; in the analysis and interpretation of data; in the writing of the manuscript; and in the decision to submit the manuscript for publication.
Contributors: Lucile Malard performed the literature review and the statistical analysis and wrote the first draft of the manuscript. Jean-François Chastang made contributions to the statistical analysis, interpretation of results and manuscript revisions. Isabelle Niedhammer wrote the study protocol, and made contributions to the literature review, statistical analysis, interpretation of results and manuscript revisions.
Highlights:
No change in the prevalence of MDE and GAD was observed among both genders
The prevalence of GAD increased in female public workers but not in private workers
15 References
Amar, E., Barnouin, T., Bouvet, M., Coppoletta, R., Jacod, O., Maguain, D., Mikou, M., Renoux, A., Solard, J., de Tychey, J., 2014. La protection sociale en France et en Europe en 2012, Etudes et Statistiques. DREES.
Avčin, B.A., Kučina, A.U., Sarotar, B.N., Radovanović, M., Plesničar, B.K., 2011. The present global financial and economic crisis poses an additional risk factor for mental health problems on the employees. Psychiatr. Danub. 23 Suppl 1, S142–148.
Bambra, C., Eikemo, T.A., 2009. Welfare state regimes, unemployment and health: a comparative study of the relationship between unemployment and self-reported health in 23 European countries. J. Epidemiol. Community Health 63, 92–98. doi:10.1136/jech.2008.077354
Barr, B., Taylor-Robinson, D., Scott-Samuel, A., McKee, M., Stuckler, D., 2012. Suicides associated with the 2008-10 economic recession in England: time trend analysis. BMJ 345, e5142.
Bartoll, X., Palència, L., Malmusi, D., Suhrcke, M., Borrell, C., 2014. The evolution of mental health in Spain during the economic crisis. Eur. J. Public Health 24, 415–418. doi:10.1093/eurpub/ckt208
Baumbach, A., Gulis, G., 2014. Impact of financial crisis on selected health outcomes in Europe. Eur. J. Public Health 24, 399–403. doi:10.1093/eurpub/cku042
Bender, R., Lange, S., 2001. Adjusting for multiple testing--when and how? J. Clin. Epidemiol. 54, 343–349. Birnbaum, H.G., Kessler, R.C., Kelley, D., Ben-Hamadi, R., Joish, V.N., Greenberg, P.E., 2010. Employer
burden of mild, moderate, and severe major depressive disorder: mental health services utilization and costs, and work performance. Depress. Anxiety 27, 78–89. doi:10.1002/da.20580
Chan, C.H., Caine, E.D., You, S., Fu, K.W., Chang, S.S., Yip, P.S.F., 2014. Suicide rates among working-age adults in South Korea before and after the 2008 economic crisis. J. Epidemiol. Community Health 68, 246–252. doi:10.1136/jech-2013-202759
Chang, S.-S., Gunnell, D., Sterne, J.A.C., Lu, T.-H., Cheng, A.T.A., 2009. Was the economic crisis 1997–1998 responsible for rising suicide rates in East/Southeast Asia? A time–trend analysis for Japan, Hong Kong, South Korea, Taiwan, Singapore and Thailand. Soc. Sci. Med. 68, 1322–1331.
doi:10.1016/j.socscimed.2009.01.010
Chang, S.-S., Stuckler, D., Yip, P., Gunnell, D., 2013. Impact of 2008 global economic crisis on suicide: time trend study in 54 countries. BMJ 347, f5239.
Christodoulou, N.G., Christodoulou, G.N., 2013. Financial crises: impact on mental health and suggested responses. Psychother. Psychosom. 82, 279–284. doi:10.1159/000351268
Coutrot, T., Rouxel, C., Bahu, M., Herbet, J.-B., Mermilliod, C., 2010. Parcours professionnels et état de santé. Prem. Inf. Prem. Synthèses 1.
De Riccardis, N., 2012. Traitements de la non-réponse et calages pour l’enquête Santé et Itinéraire Professionnel de 2010. Doc. Trav. Sér. Sources Méthodes 36.
De Vogli, R., Marmot, M., Stuckler, D., 2013. Excess suicides and attempted suicides in Italy attributable to the great recession. J. Epidemiol. Community Health 67, 378–379. doi:10.1136/jech-2012-201607 Falagas, M.E., Vouloumanou, E.K., Mavros, M.N., Karageorgopoulos, D.E., 2009. Economic crises and
mortality: a review of the literature. Int. J. Clin. Pract. 63, 1128–1135. doi:10.1111/j.1742-1241.2009.02124.x
Fountoulakis, K.N., Gonda, X., Dome, P., Theodorakis, P.N., Rihmer, Z., 2014. Possible delayed effect of unemployment on suicidal rates: the case of Hungary. Ann. Gen. Psychiatry 13, 12. doi:10.1186/1744-859X-13-12
Fountoulakis, K.N., Savopoulos, C., Siamouli, M., Zaggelidou, E., Mageiria, S., Iacovides, A., Hatzitolios, A.I., 2013. Trends in suicidality amid the economic crisis in Greece. Eur. Arch. Psychiatry Clin. Neurosci. 263, 441–444. doi:10.1007/s00406-012-0385-9
Gerdtham, U.-G., Ruhm, C.J., 2006. Deaths rise in good economic times: Evidence from the OECD. Econ. Hum. Biol. 4, 298–316. doi:10.1016/j.ehb.2006.04.001
Gili, M., Roca, M., Basu, S., McKee, M., Stuckler, D., 2013. The mental health risks of economic crisis in Spain: evidence from primary care centres, 2006 and 2010. Eur. J. Public Health 23, 103–108.
doi:10.1093/eurpub/cks035
Kaplan, G.A., 2012. Economic crises: some thoughts on why, when and where they (might) matter for health--a tale of three countries. Soc. Sci. Med. 1982 74, 643–646. doi:10.1016/j.socscimed.2011.12.013 Kessler, R.C., Akiskal, H.S., Ames, M., Birnbaum, H., Greenberg, P., Hirschfeld, R.M.A., Jin, R., Merikangas,
16
a nationally representative sample of U.S. workers. Am. J. Psychiatry 163, 1561–1568. doi:10.1176/appi.ajp.163.9.1561
Madianos, M., Economou, M., Alexiou, T., Stefanis, C., 2011. Depression and economic hardship across Greece in 2008 and 2009: two cross-sectional surveys nationwide. Soc. Psychiatry Psychiatr. Epidemiol. 46, 943–952. doi:10.1007/s00127-010-0265-4
Malard, L., Chastang, J.-F., Niedhammer, I., 2014. Changes in psychosocial work factors in the French working population between 2006 and 2010. Int. Arch. Occup. Environ. Health. doi:10.1007/s00420-014-0953-6 Mattei, G., Ferrari, S., Pingani, L., Rigatelli, M., 2014. Short-term effects of the 2008 Great Recession on the
health of the Italian population: an ecological study. Soc. Psychiatry Psychiatr. Epidemiol. 49, 851–858. doi:10.1007/s00127-014-0818-z
Milner, A., Morrell, S., LaMontagne, A.D., 2014. Economically inactive, unemployed and employed suicides in Australia by age and sex over a 10-year period: what was the impact of the 2007 economic recession? Int. J. Epidemiol. 43, 1500–1507. doi:10.1093/ije/dyu148
Miret, M., Caballero, F.F., Huerta-Ramírez, R., Moneta, M.V., Olaya, B., Chatterji, S., Haro, J.M., Ayuso-Mateos, J.L., 2014. Factors associated with suicidal ideation and attempts in Spain for different age groups. Prevalence before and after the onset of the economic crisis. J. Affect. Disord. 163, 1–9. doi:10.1016/j.jad.2014.03.045
Modrek, S., Hamad, R., Cullen, M.R., 2015. Psychological well-being during the great recession: changes in mental health care utilization in an occupational cohort. Am. J. Public Health 105, 304–310. doi:10.2105/AJPH.2014.302219
Murcia, M., Chastang, J.-F., Niedhammer, I., 2013. Psychosocial work factors, major depressive and generalised anxiety disorders: results from the French national SIP study. J. Affect. Disord. 146, 319–327.
doi:10.1016/j.jad.2012.09.014
Naswall K., Richter A., Hellgren J., Sverke M, 2011. Job Insecurity and Mental Health Complaints over Time: A Growth Curve Modelling Approach. Presented at the 9th Industrial and Organisational Psychology Conference, pp. 6–10.
Niedhammer, I., Chastang, J.-F., 2014. Psychosocial work factors and first depressive episode: retrospective results from the French national SIP survey. Int. Arch. Occup. Environ. Health.
Reeves, A., Stuckler, D., McKee, M., Gunnell, D., Chang, S.-S., Basu, S., 2012. Increase in state suicide rates in the USA during economic recession. Lancet 380, 1813–1814. doi:10.1016/S0140-6736(12)61910-2 Sheehan, D.V., Lecrubier, Y., Sheehan, K.H., Amorim, P., Janavs, J., Weiller, E., Hergueta, T., Baker, R.,
Dunbar, G.C., 1998. The Mini-International Neuropsychiatric Interview (M.I.N.I.): the development and validation of a structured diagnostic psychiatric interview for DSM-IV and ICD-10. J. Clin. Psychiatry 59 Suppl 20, 22–33;quiz 34–57.
Stuckler, D., Basu, S., 2013. The body economic: why austerity kills. Basic Books.
Stuckler, D., Basu, S., Suhrcke, M., Coutts, A., McKee, M., 2009. The public health effect of economic crises and alternative policy responses in Europe: an empirical analysis. Lancet 374, 315–323.
doi:10.1016/S0140-6736(09)61124-7
Stuckler, D., Basu, S., Suhrcke, M., Coutts, A., McKee, M., 2011. Effects of the 2008 recession on health: a first look at European data. Lancet 378, 124–125. doi:10.1016/S0140-6736(11)61079-9
Suhrcke, M., Stuckler, D., 2012. Will the recession be bad for our health? It depends. Soc. Sci. Med. 1982 74, 647–653. doi:10.1016/j.socscimed.2011.12.011
Uutela, A., 2010. Economic crisis and mental health. Curr. Opin. Psychiatry 23, 127–130. doi:10.1097/YCO.0b013e328336657d
Vittadini, G., Beghi, M., Mezzanzanica, M., Ronzoni, G., Cornaggia, C.M., 2014. Use of psychotropic drugs in Lombardy in time of economic crisis (2007-2011): A population-based study of adult employees. Psychiatry Res. doi:10.1016/j.psychres.2014.06.006
Vlachadis, N., Vlachadi, M., Iliodromiti, Z., Kornarou, E., Vrachnis, N., 2014. Greece’s economic crisis and suicide rates: overview and outlook. J. Epidemiol. Community Health 68, 1204–1205.
doi:10.1136/jech-2014-204407
Wang, J., Smailes, E., Sareen, J., Fick, G.H., Schmitz, N., Patten, S.B., 2010. The prevalence of mental disorders in the working population over the period of global economic crisis. Can. J. Psychiatry Rev. Can. Psychiatr. 55, 598–605.
WHO, 2009. Health in times of global economic crisis: implications for the WHO European Region [WWW Document]. URL http://www.euro.who.int/en/health-topics/Health-systems/health-systems- governance/publications/2009/health-in-times-of-global-economic-crisis-implications-for-the-who-european-region (accessed 9.25.14).
17
Table 1 Description of the study sample in 2006 and 2010
Men (N=2679) Women (N=2921) pc pd 2006 2010 2006 2010 Na %b Na %b Na %b Na %b Age (years) [20;30[ 365 20.52 167 9.64 372 19.79 182 9.72 0.1457 0.2405 [30;40[ 778 31.01 601 27.94 826 28.60 640 26.49 [40;50[ 916 31.58 938 33.09 1061 32.28 1012 31.35 50+ 620 16.89 973 29.32 662 19.33 1087 32.44 Origin French 2479 91.68 2479 91.68 2726 92.19 2726 92.19 0.5922 0.5922 Foreigner 200 8.32 200 8.32 195 7.81 195 7.81 Occupation Managers/professionals 458 17.14 534 20.13 379 11.42 437 13.15 <0.0001 <0.0001 Associate professionals 706 26.94 743 28.29 814 26.55 857 28.62 Clerks/service workers 536 22.44 536 20.28 1488 52.26 1432 50.09 Manual workers 973 33.48 865 31.30 227 9.77 195 8.14 Sector Public 503 18.63 485 18.11 956 30.04 968 30.16 <0.0001 <0.0001 Private 2127 81.37 2194 81.89 1886 69.96 1953 69.84 Status Self-employed 296 10.88 362 12.65 214 7.25 233 7.74 <0.0001 <0.0001 Employee 2334 89.12 2317 87.35 2628 92.75 2688 92.26
Work contract Temporary 286 12.01 111 5.11 407 16.29 212 8.31 0.0003 0.0004 Permanent 2317 87.99 2463 94.89 2442 83.71 2660 91.69
MDE Yes 87 3.26 93 3.60 215 6.82 214 7.09 <0.0001 <0.0001 No 2592 96.74 2586 96.40 2706 93.18 2707 92.91
18 GAD Yes 74 2.97 100 3.78 183 5.66 216 6.93 <0.0001 <0.0001
No 2605 97.03 2579 96.22 2738 94.34 2705 93.07
a Unweighted number of individuals b Weighted frequency distribution c
Rao-Scott Chi2 for differences between men and women in 2006 d Rao-Scott Chi2 for differences between men and women in 2010
19
Table 2 Changes in mental disorders (MDE, GAD) between 2006 and 2010 in the French working population: results from weighted generalized estimating equations for logistic regression adjusted for age
Men (N=2679) Women (N=2921) OR CI 95% p OR CI 95% p Non-adjusted MDE Year 2010 vs 2006 1.11 [0.80 ; 1.54] 0.5381 1.04 [0.86 ; 1.26] 0.6811 GAD Year 2010 vs 2006 1.28 [0.90 ; 1.82] 0.1713 1.24 [1.01 ; 1.52] 0.0382 Adjusted for age
MDE Year 2010 vs 2006 1.17 [0.83 ; 1.63] 0.3774 0.96 [0.78 ; 1.17] 0.6650 GAD Year 2010 vs 2006 1.34 [0.93 ; 1.94] 0.1117 1.16 [0.95 ; 1.43] 0.1498
20
Table 3 Changes in MDE between 2006 and 2010 adjusted for age in subgroups of population according to age, origin, occupation, public/private sector, self-employed/employee status and work contract
Year 2010 vs 2006 Men (N=2679) Women (N=2921)
OR 95% CI p OR 95% CI p Age (years) 0.4002a 0.6239 a 20-30 1.24 [0.51 ; 3.00] 0.6283 0.98 [0.46 ; 2.09] 0.9546 30-40 1.52 [0.74 ; 3.14] 0.2536 1.03 [0.62 ; 1.70] 0.9093 40-50 0.82 [0.47 ; 1.41] 0.4704 0.80 [0.58 ; 1.12] 0.1933 50+ 1.61 [0.83 ; 3.11] 0.1564 1.12 [0.80 ; 1.56] 0.5156 Origin 0.2507 a 0.4503 a French 1.10 [0.76 ; 1.58] 0.6117 0.93 [0.76 ; 1.15] 0.5253 Foreign 1.94 [0.77 ; 4.86] 0.1570 1.26 [0.59 ; 2.66] 0.5493 Occupation 0.7913 a 0.9022 a Managers/professionals 0.80 [0.35 ; 1.87] 0.6143 0.89 [0.51 ; 1.58] 0.7006 Associate professionals 1.06 [0.54 ; 2.09] 0.8684 0.87 [0.55 ; 1.37] 0.5517 Clerks/service workers 1.34 [0.70 ; 2.57] 0.3836 1.04 [0.80 ; 1.37] 0.7555 Manual workers 1.27 [0.66 ; 2.46] 0.4771 1.01 [0.51 ; 1.99] 0.9852 Sector 0.3392 a 0.1607 a Public 1.62 [0.78 ; 3.37] 0.1939 1.22 [0.86 ; 1.73] 0.2725 Private 1.08 [0.73 ; 1.60] 0.7130 0.90 [0.70 ; 1.15] 0.3889 Work status 0.4315 a 0.0553 a Self-employed 0.82 [0.32 ; 2.10] 0.6760 0.42 [0.18 ; 0.99] 0.0471 Employees 1.23 [0.84 ; 1.80] 0.2859 1.04 [0.85 ; 1.29] 0.6813 Work contract 0.5356 a 0.9955 a Temporary 1.79 [0.54 ; 5.94] 0.3382 0.99 [0.47 ; 2.11] 0.9858 Permanent 1.15 [0.78 ; 1.68] 0.4827 1.00 [0.80 ; 1.24] 0.9675
OR for each subgroup (reference 2006)
21
Table 4 Changes in GAD between 2006 and 2010 adjusted for age in subgroups of population according to age, origin, occupation, public/private sector, self-employed/employee status and work contract
Year 2010 vs 2006 Men (N=2679) Women (N=2921)
OR 95% CI p OR 95% CI p Age (years) 0.7612 a 0.5562 a 20-30 2.07 [0.68 ; 6.28] 0.1989 0.89 [0.38 ; 2.12] 0.7995 30-40 1.02 [0.53 ; 1.95] 0.9534 0.94 [0.59 ; 1.48] 0.7803 40-50 1.36 [0.71 ; 2.57] 0.3514 1.28 [0.93 ; 1.77] 0.1353 50+ 1.31 [0.72 ; 2.37] 0.3779 1.34 [0.88 ; 2.05] 0.1736 Origin 0.8223 a 0.7742 a French 1.33 [0.90 ; 1.97] 0.1485 1.15 [0.93 ; 1.42] 0.1968 Foreign 1.49 [0.61 ; 3.63] 0.3831 1.32 [0.52 ; 3.32] 0.5564 Occupation 0.8416 a 0.5887 a Managers/professionals 0.91 [0.42 ; 2.00] 0.8183 1.02 [0.54 ; 1.96] 0.9422 Associate professionals 1.45 [0.64 ; 3.25] 0.3699 1.11 [0.75 ; 1.62] 0.6072 Clerks/service workers 1.38 [0.69 ; 2.77] 0.3591 1.30 [0.96 ; 1.74] 0.0858 Manual workers 1.34 [0.75 ; 2.39] 0.3227 0.74 [0.37 ; 1.51] 0.4122 Sector 0.4323 a 0.0163 a Public 1.80 [0.86 ; 3.77] 0.1203 1.74 [1.17 ; 2.60] 0.0067 Private 1.28 [0.86 ; 1.90] 0.2285 0.97 [0.76 ; 1.25] 0.8135 Work status 0.9853 a 0.2606 a Self-employed 1.33 [0.52 ; 3.44] 0.5526 1.89 [0.83 ; 4.31] 0.1282 Employees 1.35 [0.92 ; 1.97] 0.1286 1.12 [0.90 ; 1.40] 0.3034 Work contract 0.6621 a 0.9655 a Temporary 1.02 [0.27 ; 3.87] 0.9759 1.14 [0.60 ; 2.19] 0.6892 Permanent 1.37 [0.91 ; 2.07] 0.1281 1.16 [0.92 ; 1.47] 0.2132
OR for each subgroup (reference 2006)
22
Table 5 Changes in MDE and GAD among the total sample of the general population and among the sample of workers in 2006 overall and according to working status in 2010, adjusted for age
Men Women
OR 95% CI p OR 95% CI p
Total sample of the general population (N=4966 men and N=6050 women) MDE
Year 2010 vs 2006 1.23 [1.01 ; 1.49] 0.0408 0.89 [0.78 ; 1.00] 0.0577 GAD
Year 2010 vs 2006 1.2 [0.96 ; 1.49] 0.1094 1.04 [0.91 ; 1.19] 0.5698 Total sample of workers in 2006 whatever their working status in 2010
(N=3202 men and N=3471 women) MDE
Year 2010 vs 2006 1.27 [0.96 ; 1.68] 0.1042 0.99 [0.83 ; 1.19] 0.9445 GAD
Year 2010 vs 2006 1.24 [0.91 ; 1.69] 0.1663 1.16 [0.96 ; 1.40] 0.1376 Sample of workers in 2006 according to their working status in 2010
(N=3202 men and N=3471 women) Working in 2010
(N=2679 men and N=2921 women) MDE
Year 2010 vs 2006 1.17 [0.83 ; 1.63] 0.3774 0.96 [0.78 ; 1.17] 0.665 GAD
Year 2010 vs 2006 1.34 [0.93 ; 1.94] 0.1117 1.16 [0.95 ; 1.43] 0.1498 Retired in 2010
(N=334 men and N=318 women) MDE
Year 2010 vs 2006 1.34 [0.34 ; 5.31] 0.6848 1.02 [0.43 ; 2.40] 0.9718 GAD
Year 2010 vs 2006 1.25 [0.25 ; 6.23] 0.7925 1.09 [0.44 ; 2.71] 0.8598 Other non-working situations (unemployed, in training, etc.) in 2010
(N=189 men and N=232 women) MDE
Year 2010 vs 2006 2.01 [1.08 ; 4.08] 0.0303 1.08 [0.62 ; 1.86] 0.7964 GAD