HAL Id: inserm-00656264
https://www.hal.inserm.fr/inserm-00656264
Submitted on 3 Jan 2012
HAL is a multi-disciplinary open access
archive for the deposit and dissemination of
sci-entific research documents, whether they are
pub-lished or not. The documents may come from
teaching and research institutions in France or
abroad, or from public or private research centers.
L’archive ouverte pluridisciplinaire HAL, est
destinée au dépôt et à la diffusion de documents
scientifiques de niveau recherche, publiés ou non,
émanant des établissements d’enseignement et de
recherche français ou étrangers, des laboratoires
publics ou privés.
LF/(LF+HF) index in ventricular repolarization
variability correlated and uncorrelated with heart rate
variability.
Miguel Altuve, Sara Wong, Gianfranco Passariello, Guy Carrault, Alfredo
Hernández
To cite this version:
Miguel Altuve, Sara Wong, Gianfranco Passariello, Guy Carrault, Alfredo Hernández. LF/(LF+HF)
index in ventricular repolarization variability correlated and uncorrelated with heart rate variability..
Conference proceedings : .. Annual International Conference of the IEEE Engineering in Medicine and
Biology Society. IEEE Engineering in Medicine and Biology Society. Annual Conference, Institute
of Electrical and Electronics Engineers (IEEE), 2006, 1, pp.1363-6. �10.1109/IEMBS.2006.259821�.
�inserm-00656264�
Abstract—The purpose of this study, was to asses whether LF/(LF+HF) obtained from ventricular repolarization variability (VRV) reflects the state of sympathovagal balance. The VRV time series and Heart Rate Variability (HRV) time series from seventy two electrocardiogram (ECG) records in four different Autonomic Nervous System (ANS) profiles (athletes, cardiac transplant patient, heart failure patients and normal subjects) were extracted. A dynamic linear parametric model was applied to separate the VRV in two parts, VRV correlated with HRV (VRVr) and VRV uncorrelated with HRV
(VRVu). Spectral indices were obtained from HRV, VRV, VRVu
and VRVu time series. Changes of these indicators from rest to
tilt position were analyzed. Results showed that: i) only LF/(LF+HF) from HRV time series increases significantly from rest to tilt in all ANS profiles, this information could not be retrieved in the other three series (VRV, VRVu and VRVu), ii)
LF/(LF+HF) index in HRV series are significantly different between normal subjects and heart failure patients, while cardiac transplant patients show a low coherence between HRV and VRV power spectra and iii) HF rhythm in VRV series seem to be related to the mechanical effect of respiration.
I. INTRODUCTION
great number of works have sought to establish relations between the variability of the ventricular repolarization (VRV) and heart rate variability (HRV). Peaks in the low frequency (LF) and high frequency (HF) bands were observed in the power spectra of the VRV and the HRV time series [1]. Additionally, it was found that the power distribution between LF and HF in the VRV power spectrum was reversed with respect to heart rate power spectrum. Generally, LF/(LF+HF)HRV is higher than 0.5 and
LF/(LF+HF)VRV is smaller than this value. However, the
physiological origins of these components are explained partially and the interpretation of the spectral parameters resulting from VRV sequence remains incomplete [2].
Moreover, a recent work using multiple correspondence analysis shows that low frequencies of the HRV and VRV
This work was supported in part by :
the Simon Bolivar University DID and DI, and by ECOS NORD cooperation program.
Miguel Altuve is with the Industrial Technology Department, Simon Bolivar University, Caracas, Venezuela (e-mail: maltuve@usb.ve).
Sara Wong is with the Electronic and Circuit Department, Simon Bolivar University, Caracas, Venezuela (e-mail: swong@usb.ve).
Gianfranco Passariello is with the Electronic and Circuit Department, Simon Bolivar University, Caracas, Venezuela (e-mail: gpass@usb.ve).
Guy Carrault is with the LTSI INSERM U642, Rennes I University, Rennes, France (e-mail: guy.carrault@univ-rennes1.fr).
Alfredo Hernandez is with the LTSI INSERM U642, Rennes I University, Rennes, France (e-mail: alfredo.hernandez@univ-rennes1.fr).
series were correlated [3]. In that work, high frequencies of the VRV space seem to be inadequate markers for the characterization of the Autonomic Nervous System (ANS). However, they observed that using only VRV parameters additional information from the population was obtained. These controversial results led us to explore a dynamic linear parametric model to quantify the dependence of ventricular repolarization variability to heart rate variability. This model allows separation of VRV series into a series correlated and uncorrelated with HRV [4]. The uncorrelation between VRV and HRV does not imply that there is not any physiological dependence between them [5].
In order to better understand the relationships between heart rate and ventricular repolarization phenomena, this model appears as an interesting tool to explore the value of the index LF/(LF+HF) in VRV correlated and VRV uncorrelated to HRV series.
The aims of this study were: i) to study LF/(LF+HF) of VRV from correlated and uncorrelated series, to reflect the state of sympathovagal balance in resting position, ii) to compare LF/(LF+HF) index in four different ANS profiles: athlete subjects, cardiac transplant patients, heart failure patients, and normal subjects.
II. METHODS
A. Model Formulation
The model was based on the one proposed by Porta et al. [4]. It analyzes the beat-to-beat series of the HRV series from the RR durations and VRV series from the RT apex (RT max) periods. From these two signals, a parametric identification procedure and spectral decomposition techniques allow to separate VRV series into VRV correlated to HRV series (VRVr) and VRV uncorrelated to
HRV series (VRVu). The transfer function VRV-HRV can
thus be determined (Figure 1).
A11, A12, A22 and D1 are polynomials of order n in the z-1
domain. WHRV and WVRV are zero-mean white noises with
variance λ2HRV and λ2VRV, respectively. The polynomial A22
can be estimated using a least squares approach, and the A11,
A12 and D1 can be obtained using a generalized least squares
(GLS) methodology [4, 5].
The model order n is chosen inside the set {8,10,12}, according to the minimum of the Akaike figure of merit [6]. As no a priori information was used, all blocks of the model are of the same order, thus, not giving an advantage to one
LF/(LF+HF) index in Ventricular Repolarization Variability
correlated and uncorrelated with Heart Rate Variability
M. Altuve, Student Member, IEEE, S. Wong, G. Passariello, G. Carrault, A. Hernández.
A
mechanism with respect to the others.
From figure 1, two transfer functions can be identified. The first one, H1(z)=1/
(
D1(z)A11(z))
, has as output the VRV uncorrelated to HRV (VRVu), which is supposed to bethe ANS action to the VRV. The second one,
(
( ) ( ))
/ ) ( ) ( 12 22 11 2 z A z A z A zH = , has as output the VRV correlated to HRV (VRVr) and it is supposed to reflect the
modulation of the HRV with respect to VRV.
RR series was modeled as a n order autoregressive (AR) stationary process given by equation 1, and VRV series, given by equations 2 and 3, was the result of two uncorrelated sources (ARARX model, [7])
] [ ] [ ] [ ] [ 1 22 kHRV i k W i a i HRV HRV n k + − − =
∑
= (1) ] [ ] [ ] [ ] [ ] [ 1 11 0 12 kHRV i k a VRVi k N i a i VRV VRV n k n k∑
∑
= = + − − − = (2) ] [ ] [ ] [ ] [ 1 1 k N i k W i d i N VRV VRV n k VRV =−∑
− + = (3) Because of the uncorrelation between inputs WVRV andWHRV, the power spectral density of VRV (SVRV) can be
computed as the sum of the two partial power spectra that express the contribution of each source:
) ( ) ( ) (f S f S f SVRV = VRVr + VRVu (4) B. Study Population
In this work, seventy two subjects were studied. Each subject performed two tests with duration of five minutes each, as indicated below:
- Test 1 (rest): free ventilation in supine position. - Test 2 (tilt): free ventilation in standing position. Subjects belong to one of two protocols:
Protocol I: A database of thirty (30) young healthy subjects: 12 swimmers, 7 judokas and 11 sedentary, (20 ± 2 years of age) were analyzed. In total, sixty ECG records were analyzed.
Protocol II: A database of forty two (42) males subjects: 24 cardiac transplant patients (55.1 ± 6.7 years of age), 10 heart failure patients (62.1 ± 2.3 years of age) and 8 control subjects (64.0 ± 3.0 years of age) were analyzed. In total, eighty four ECG records were analyzed.
In total one hundred forty four (144) ECG records were analyzed from the two protocols.
C. HRV and VRV Series
HRV sequences were obtained using the Gritzali QRS detector followed by a manual verification of each detected R-wave [8]. VRV series were obtained by applying the algorithm proposed by Vila et al. [9]. Artifacts in the VRV sequence were also manually removed.
D. Spectral Analysis
The HRV and VRV sequences were linearly interpolated and uniformly sampled at 2 Hz. A time-varying autoregressive modeling of the interpolated HRV and VRV sequences was performed by using a 25 seconds sliding window. Power spectral densities were estimated. For each test the following parameters were determined: LFHRV,
HFHRV, LF/(LF+HF)HRV for HRV sequences, and LFVRV,
HFVRV, LF/(LF+HF)VRV for VRV sequences. The LF and HF
bands were defined respectively by [0.04-0.15 Hz] and by [0.15-0.4 Hz] as proposed in [10].
E. Parametric Model
In order to illustrate, in a simple way, the operation of the model, it was validated using sine waves of frequencies corresponding to LF and HF components. Akaike criterion was used to fix the model order [6].
Tables I and II show mean coherence values of the power spectra between HRV and VRV series in LF and HF bands. The model was applied using criteria of a mean coherence value higher than 0.5.
From the model VRVr and VRVu were obtained, power
spectral densities were estimated and, LF(LF+HF)r and
LF/(LF+HF)u were determined.
III. RESULTS
Results are presented as mean ± SD. Wilcoxon tests were used to determine the significance of the differences between rest and tilt, and between populations. A p<0.05 is considered significant.
A. Spectral Analysis
The LF/(LF+HF)HRV and LF/(LF+HF)VRV values are
Fig. 1. Dynamic linear parametric model.
TABLE II
THE COHERENCE FUNCTION FOR PROTOCOL II.
Rest Tilt Subject K(LF) K(HF) K(LF) K(HF) Cardiac transplant 0.67±0.24 0.56±0.19 0.65±0.22 0.50±0.22 Heart failure 0.72±0.25 0.72±0.15 0.77±0.18 0.68±0.15 Normal Subjects 0.81±0.16 0.61±0.17 0.65±0.13 0.66±0.19 TABLE I
THE COHERENCE FUNCTION FOR PROTOCOL I.
Rest Tilt Subject K(LF) K(HF) K(LF) K(HF) Swimmers 0.69±0.28 0.62±0.21 0.75±0.21 0.69±0.23 Judokas 0.77±0.24 0.62±0.14 0.84±0.16 0.59±0.24 Sedentary 0.73±0.19 0.64±0.23 0.80±0.19 0.67±0.25
shown in tables III and IV for protocols I and II respectively.
LF/(LF+HF)HRV increases significantly from rest to tilt in
both protocols and for all populations. In the case of LF/(LF+HF)VRV no significant changes were observed. Also,
in protocol II, LF/(LF+HF)HRV allows to differentiate
between populations, it is larger in control subjects than in heart failure patients (p<0.01) (see table IV).
Figure 2 shows HRV and VRV sequences and power spectra for a normal subject resting position. Both power spectra confirmed that the HRV and VRV series exhibit LF and HF peaks.
Figure 3 shows HRV and VRV sequences and power spectra for a transplant cardiac patient in resting position. VRV spectrum is characterized by an prominent HF peak, LF component is minor.
B. Parametric Model
Results of LF/(LF+HF) values from the parametric model for protocols I and II are summarized in tables V and VI, respectively.
No differences were observed neither in LF/(LF+HF)r nor
in LF/(LF+HF)u when subjects changed from rest to tilt
(p>0.05).
TABLE IV
LF/(LF+HF) VALUES FOR THE HRV AND VRV SEQUENCES IN THE REST AND TILT CONDITION FOR THE PROTOCOL II.
LF/(LF+HF)HRV LF/(LF+HF)VRV
Subject
Rest Tilt Rest Tilt Cardiac transplant 0.46±0.29 0.54±0.29 0.29±0.14 0.32±0.16 Heart failure 0.45±0.17 0.59±0.13 0.35±0.11 0.38±0.14 Normal Subjects 0.68±0.16 0.80±0.09 0.41±0.19 0.46±0.18 TABLE III
LF/(LF+HF) VALUES FOR HRV AND VRV SEQUENCES IN THE REST AND TILT CONDITION FOR PROTOCOL I.
LF/(LF+HF)HRV LF/(LF+HF)VRV
Subject
Rest Tilt Rest Tilt Swimmers 0.49±0.2 0.74±0.18 0.41±0.24 0.53±0.21 Judokas 0.49±0.23 0.84±0.1 0.37±0.24 0.53±0.17 Sedentary 0.52±0.16 0.68±0.22 0.42±0.08 0.47±0.19
TABLE VI
LF/(LF+HF) VALUES FOR VRVr AND VRVu SEQUENCES IN THE REST AND TILT CONDITION FOR THE PROTOCOL II.
LF/(LF+HF)VRVr LF/(LF+HF)VRVu
Subject
Rest Tilt Rest Tilt Cardiac transplant 0.31±0.25 0.33±0.27 0.29±0.12 0.31±0.12 Heart failure 0.31±0.22 0.36±0.27 0.39±0.16 0.36±0.13 Normal Subjects 0.47±0.28 0.57±0.23 0.33±0.15 0.35±0.16 TABLE V
LF/(LF+HF) VALUES FOR VRVr AND VRVu SEQUENCES IN THE REST AND TILT CONDITION FOR THE PROTOCOL I.
LF/(LF+HF)VRVr LF/(LF+HF)VRVu
Subject
Rest Tilt Rest Tilt Swimmers 0.59±0.22 0.66±0.29 0.44±0.23 0.41±0.24 Judokas 0.59±0.21 0.76±0.18 0.42±0.23 0.41±0.19 Sedentary 0.53±0.19 0.56±0.2 0.30±0.13 0.39±0.17
Fig. 3. Examples of: (a) HRV sequences, (b) VRV sequences, (c) HRV power spectra, and (d) VRV power spectra for a cardiac transplant patient in resting position.
Fig. 2. Examples of: (a) HRV sequences, (b) VRV sequences, (c) HRV power spectra, and (d) VRV power spectra for a normal subject in resting position.
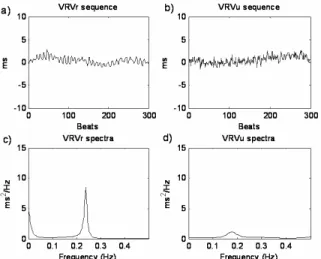
Fig. 4. Decomposition of the VRV for a normal subject: (a) VRVr
series, (b) VRVu series, (c) VRVr power spectra, and (d) VRVu
Figures 4 and 5 show the VRV decomposition: VRVr,
VRVu series and power spectra, for a normal subject and a
cardiac patient respectively. For both, cases VRVr is more
important, VRVu seems to be negligible. Both power spectra
are characterized by an important HF peak.
IV. DISCUSSION
The LF/(LF+HF)HRV has been proposed as an index to
evaluate ANS condition. Results of this work confirm this fact as the LF/(LF+HF)HRV index provided significant
differences between rest and tilt in four different ANS profiles: athlete subjects, cardiac transplant patients, heart failure patients, and normal subjects.
On the other hand, LF/(LF+HF)VRV is not a marker of
sympathovagal balance. In VRVr, we expected to find discriminant potential of LF/(LF+HF)HRV, nevertheless, the
dynamic decomposition did not reflect ANS balance. In VRVr and VRVu series, similar results for LF/(LF+HF) were
observed, but this index did not allow to separate between rest and tilt test. This behavior could be explained as follows: i) the fact that ventricular repolarization depends on heart rate and ANS, but also on humoral factors that are not taken into account in the parametric model. ii) HF oscillations in VRV series is not yet a fully understood issue. Porta et al. [4] concluded that VRVu has its most important
frequency components in the very low frequency band (VLF) and Wong et al. [3], reported that HF in VRV series has not physiological significance correlated to ANS regulation.
An important HF rhythm was observed in VRV sequences for all populations. This might explain the reversal power distribution between HRV and VRV, and stressed the difficulty of the interpretation of the physiological significance of LF/(LF+HF) in VRV series. HF component could reflect the mechanical effect of respiration. Since in cardiac transplant patients, ANS efferent nerves are severed
during the surgical procedure, respiration seems to be the most important physiological source of HF component.
Low values of coherence observed in cardiac transplant patients show that the modulation of heart rate on ventricular repolarization is very low in this population. Control subjects must have a higher sensitivity of sinus node response to ANS than cardiac transplanted patients; however, non differences were found between these populations. This is because the large variance observed in cardiac transplant patient parameters. This variance is explained by the heterogeneous elapsed time after transplantation (60 ± 48 month) for this group.
Our findings are in agreement with previous studies [2, 3, 4, 11]. Where they have shown that most of the ventricular repolarization variability is due to the modulation of heart rate variability, LF components have better correlation than HF components (see tables I and II) and HF in VRV series reflects non neural mechanisms
.
The model used in this work was proposed in the literature, nevertheless other techniques like standard prediction error tools would have been interesting to study.
Further research is needed to better understand repolarization ventricular phenomena. Adaptive identification modeling techniques is proposed as a step forward to explore VLF, LF and HF components.
REFERENCES
[1] G. Nollo, G. Speranza, R. Grasso, R. Bonamini, L. Mangiardi, R. Antolini. “Spontaneous beat-to-beat variability of the ventricular repolarization duration.” J. Electrocardioly Plastics, 25(1), pp. 9-17, 1992.
[2] F. Lombardi., G. Sandrone, A. Porta, D. Torzillo, G. Terranova, G. Baselli, S. Cerutti, A. Malliani. “Spectral analysis of short term R-Tapex interval variability during sinus rhythm and fixed atrial rate”. Eur. Heart J., 17: pp. 769-778, 1996.
[3] S. Wong., A. Hernandez., F. Carré, G. Carrault. “Study of Spectral Components of Ventricular Repolarization Variability by Multiple Correspondence Analyses”, Computers in Cardiology, pp. 93-96, 2005.
[4] A. Porta, G. Baselli, E. Caiani, A. Malliani, F. Lombardi, S. Cerutti. “Quantifying electrocardiogram RT-RR variability interactions”, Med Biol Eng Comput, 36(1), pp. 27-34, 1998.
[5] R. Almeida, E. Pueyo, J. Martinez, A. Rocha, P. Laguna. “A Parametric Model Approach for Quantification of Short Term QT Variability Uncorrelated with Heart Rate Variability”, Computers in Cardiology, 30, pp. 165-168, 2003.
[6] H. Akaike. “A new look at the statistical model identification”, IEEE Trans. Autom. Contr,, 19, pp. 716-723, 1974.
[7] L. Ljung. “System identification: Theory for the user”, second edition, Prentice Hall PTR, 1998.
[8] F. Gritzali. “Towards a generalized scheme for QRS detection in ECG waveforms”, Signal Processing, 15: pp. 183-92, 1988.
[9] J. Vila, Y. Gang, J. Rodríguez, M. Fernández, D. Barro, M. Malik. “A new approach for TU complex characterization”, IEEE Trans Biomed Eng, 47(6), pp. 764-72, 2000.
[10] Task Force of the European Society of Cardiology and the North American Society of Pacing and Electrophysiology. Heart rate variability: standard of measurement, physiological interpretation and clinical use. Circulation; 93(5), pp. 1043-65, 1996.
[11] Merri M., M. Alberti, A. Moss. Dynamic analysis of ventricular repolarization duration from 24-hour holter recordings. IEEE Trans Biomed Eng, 40(12):1219-25, 1993.
Fig. 5. Decomposition of the VRV for a cardiac transplanted patient: (a) VRVr series, (b) VRVu series, (c) VRVr power spectra,