HAL Id: inserm-02750447
https://www.hal.inserm.fr/inserm-02750447
Submitted on 3 Jun 2020
HAL is a multi-disciplinary open access
archive for the deposit and dissemination of
sci-entific research documents, whether they are
pub-lished or not. The documents may come from
teaching and research institutions in France or
abroad, or from public or private research centers.
L’archive ouverte pluridisciplinaire HAL, est
destinée au dépôt et à la diffusion de documents
scientifiques de niveau recherche, publiés ou non,
émanant des établissements d’enseignement et de
recherche français ou étrangers, des laboratoires
publics ou privés.
everolimus in triple-negative breast cancer cells
Abderrahim El Guerrab, Mahchid Bamdad, Yves-Jean Bignon, Frédérique
Penault-Llorca, Corinne Aubel
To cite this version:
Abderrahim El Guerrab, Mahchid Bamdad, Yves-Jean Bignon, Frédérique Penault-Llorca, Corinne
Aubel. Co-targeting EGFR and mTOR with gefitinib and everolimus in triple-negative breast cancer
cells. Scientific Reports, Nature Publishing Group, 2020, 10 (1), pp.6367.
�10.1038/s41598-020-63310-2�. �inserm-02750447�
co-targeting eGfR and mtoR with
gefitinib and everolimus in
triple-negative breast cancer cells
Abderrahim el Guerrab
1, Mahchid Bamdad
1,2, Yves-Jean Bignon
1,3, Frédérique penault-Llorca
1,3& corinne Aubel
1*Triple-negative breast cancers (TNBC) are unlikely to respond to hormonal therapies and anti-HER2-targeted therapies. TNBCs overexpress EGFR and exhibit constitutive activation of the PI3K/AKT/ mTOR signalling pathway. We hypothesized that simultaneously blocking EGFR and mTOR could be a potential therapeutic strategy for the treatment of TNBC. We examined the antitumour activity of the mTOR inhibitor everolimus combined with the EGFR tyrosine kinase inhibitor gefitinib in TNBC cell with or without activating mutations in the PI3K/AKT/mTOR signalling pathway. We demonstrated that everolimus and gefitinib induced synergistic growth inhibition in the PI3K and PTEN-mutant CAL-51 cell line but not in the PTEN-null HCC-1937 cell line. The antiproliferative effect was associated with synergistic inhibition of mTOR and P70S6K phosphorylation, as well as a significant reduction in 4E-BP1 activation in the CAL-51 cell line. We also showed that combination therapy significantly inhibited cell cycle progression and increased apoptosis in this cell line. Gene and protein expression analysis revealed significant downregulation of cell cycle regulators after exposure to combined treatment. Collectively, these results suggested that dual inhibition of mTOR and EGFR may be an effective treatment for TNBC with activating mutations of PI3K.
In recent decades, clinical, immunohistochemical, and molecular studies have been used to divide breast can-cer into several subtypes1. Among these multiple subtypes, triple-negative breast cancer (TNBC) is defined by
reduced expression of hormone receptors and human epidermal growth factor type 2 receptor (HER2). This type of breast cancer is unlikely to respond to hormonal therapies and anti-HER2-targeted therapies. Chemotherapy and radiation therapy are currently the only ways to treat TNBC patients, but these treatments provide a partial response with early relapse and worse prognosis2. Clinical studies have shown that TNBC is more likely to recur
in the first five years after treatment and develop multidrug resistance to chemotherapy3,4. No second-line
tar-geted therapy is currently approved for this type of cancer.
The majority of TNBC cases are characterized by the overexpression of a receptor tyrosine kinase: epidermal growth factor receptor (EGFR). This feature has emerged as a potential therapeutic target5. It has been reported
that the frequency of EGFR overexpression in TNBC is as high as 76%, suggesting that the large majority of TNBCs are likely to benefit from anti-EGFR targeted therapies6,7. Among the different EGFR inhibitors currently
approved in oncology, gefitinib is a selective EGFR tyrosine kinase inhibitor (EGFR-TKI) indicated for the treat-ment of patients with advanced or metastatic non-small-cell lung cancer (NSCLC) harbouring activating muta-tions of EGFR8. Despite the absence of EGFR mutations in TNBC, gefitinib has been evaluated in TNBC patients.
Clinical studies have reported that gefitinib enhanced the growth inhibitory effect of chemotherapies, but the use of gefitinib alone failed to demonstrate significant efficacy9,10. These disappointing results could be related to
the molecular heterogeneity of TNBC, characterized by diverse genetic alterations in EGFR signalling pathways. Triple-negative tumours with overexpression of EGFR exhibit constitutive activation of EGFR-dependent sig-nalling pathways, especially the PI3K/AKT/mTOR pathway. Activation of this pathway is involved in tumorigen-esis, contributing to apoptosis inhibition, cell cycle progression, drug resistance, cell motility and metastasis11,12. 1Université Clermont Auvergne, Faculté de médecine, INSERM, U1240, Imagerie Moléculaire et Stratégies
Théranostiques, 28 place Henri Dunant, BP38-, 63001, Clermont, Ferrand, France. 2Université Clermont Auvergne,
Institut Universitaire de Technologie de Clermont-Ferrand, Département Génie Biologique, Ensemble Universitaire des Cézeaux, CS 30086-, 63172, Aubière Cedex, France. 3Centre Jean Perrin, INSERM, U1240, Imagerie Moléculaire
et Stratégies Théranostiques, 58 rue Montalembert, BP392, 63011, Clermont, Ferrand Cedex, France. *email:
corinne.aubel@uca.fr
Several molecular alterations affecting the key components of the PI3K/AKT/mTOR signalling pathway are fre-quently encountered in TNBC. Among these genetic aberrations, the loss of PTEN expression and the presence of activating mutations in the gene encoding the catalytic subunit alpha of PI3K (PI3KCA) are responsible for the constitutive activation of downstream effectors such as mammalian target of rapamycin (mTOR)13,14. mTOR
is a serine/threonine kinase that is directly phosphorylated and activated by AKT. Activation of mTOR controls the translation of mRNAs through the activation of eukaryotic translational initiation factor 4E-binding protein (4E-BP1) and ribosomal protein S6 kinase (P70S6K)15.
Preclinical studies have suggested that targeting mTOR could improve the efficacy of EGFR inhibitors in vari-ous human cancers, including TNBC. Everolimus is a rapamycin analogue that is currently used for the treatment of several solid malignancies including renal cell carcinoma, neuroendocrine carcinoma and HER2-negative breast cancer16–19. An in vitro study demonstrated that everolimus and gefitinib induced synergistic growth
inhi-bition of EGFR wild-type NSCLC cell lines20. Another study demonstrated that everolimus restores gefitinib
sensitivity in resistant NSCLC cell lines. Everolimus plus gefitinib induced a significant decrease in the activa-tion of EGFR downstream signalling pathways and resulted in a synergistic growth-inhibitory effect in NSCLC cells21. Reports from other authors showed that combination of EGFR and mTOR inhibitors synergistically
inhib-its the cell cycle progression and the growth of several colorectal carcinoma cell lines22. Liu et al. showed that
co-inhibition of mTOR and EGFR (using rapamycin and the EGFR-TKI lapatinib, respectively) resulted in syner-gistic effects in TNBC cell lines and suppressed triple-negative tumour growth in vivo23.
Collectively, these studies provide evidence that the approach of co-targeting mTOR and EGFR could be a potential therapeutic strategy in TNBC. In the current study, we hypothesized that inhibition of mTOR may improve the efficacy of anti-EGFR targeted therapy in TNBC with molecular alterations of PI3K/AKT/mTOR pathway. We investigated the combination effect of everolimus and gefitinib in several TNBC cell lines that do or do not harbour the main activating mutations in the PI3K/AKT/mTOR signalling pathway. We used cell lines overexpressing EGFR and carrying PI3K and/or PTEN mutations, which are the most frequently encountered mutations in TNBC. We examined the effects of therapies in order to evaluate the therapeutic response according to these genetic alterations. We analysed the effect of gefitinib and everolimus on cell proliferation, cell cycle, apoptosis and expression of various genes involved in the process of tumorigenesis.
Methods
Cell lines, culture conditions and reagents.
HCC-1937 (CRL-2336), SUM-1315 (SUM1315M02) and CAL-51 (ACC-302) cell lines were purchased from the American Type Culture Collection (ATCC, Manassas, VA, USA), Asterand (Detroit, MI, USA) and DSMZ (Braunschweig, Germany), respectively. All cell lines are triple-negative breast cancer cells and were conserved in the Biological Resource Center of Jean Perrin Comprehensive Cancer Center (No. BB-0033-00075, Clermont-Ferrand, France) (Table 1)24,25. Cells werecul-tured as described previously at 37 °C in a humidified atmosphere of 95% air and 5% CO226,27. HCC-1937 cells
were cultured in RPMI 1640 and CAL-51 in DMEM medium (Invitrogen Life Technologies, Carlsbad, CA, USA). The media were supplemented with 10% heat-inactivated foetal bovine serum (FBS), 2 mM L-glutamine and 20 mg/mL gentamicin. SUM-1315 cells were cultured in Ham’s F-12 medium supplemented with 5% FBS, 1% HEPES buffer, 10 ng/ml EGF and 5 μg/ml insulin (Invitrogen Life Technologies, Carlsbad, CA, USA). The EGFR tyrosine kinase inhibitor gefitinib and the mTOR inhibitor everolimus were purchased from LC Laboratories (Woburn, MA, USA). Drugs were dissolved in DMSO and stored at −20 °C. Dilutions were made immediately before use in growth medium, and cells were treated with various concentrations of drugs for 24 h, 48 h or 72 h. The final DMSO concentration (0.2%) remained constant in all analysed cell cultures, including untreated cells.
Cell viability assay.
Cell viability was assessed using the XTT Cell Viability Assay Kit, according to the instructions of the manufacturer (Biotium Inc., Hayward, CA, USA). This method was described in our previous study27. Briefly, after determining optimal starting cell density for each cell line (densities between 5000 and15000 cells per well), cells were seeded in sextuplicate in 96-well plates and incubated overnight. After attachment (24 h), cells were treated for 72 h with increasing concentrations of gefitinib (1, 5, 10, 20 and 50 μM) and everoli-mus (0.1, 1, 10, 100 and 1000 nM) as single agents and in combination. Fifty microliters of the activated XTT solution was added to the cultured cells in each well. Cells were incubated at 37 °C for 4 h, and the absorbance signal was measured with a spectrophotometer at a wavelength of 450–500 nm. All experiments were performed in triplicate. The relative cell viability was expressed as percentage of that of the untreated cells, and the IC50 values were determined by linear extrapolation. The combined effect of gefitinib and everolimus was determined
Cell lines TNBC Subtype Basal subtype Mutations CAL-51 Mesenchymal-like Unclassified PI3KCA, PTEN,
MAP3K1 HCC-1937 Basal-like 1 Basal-like A PTEN, BRCA1, TP53
SUM-1315 Unclassified Basal-like B BRCA1, TP53, CDKN2A
Table 1. Characteristics of triple-negative breast cancer cell lines used in this study. Data were obtained from
using the Bliss independence model which allows the calculation of the expected effect of combination therapy (additive, synergistic or antagonistic effect)28. We described this model in our previous studies26,27.
Western blotting.
Immunoblotting was performed as described previously26,27. Briefly, cells were cultured in100-mm dishes at a density of 5 × 10⁵ cells per dish and treated with 5 μM gefitinib and/or 100 nM everolimus for
24 h or 48 h. Twenty micrograms of each protein samples from cell lysates were separated via 7–12% SDS-PAGE (Bio-Rad, Hercules, CA, USA) and transferred to PVDF membranes (GE Healthcare, Westborough, MA, US). Blots were blocked and incubated overnight at 4 °C with the following primary antibodies: anti-phospho-ERK1/2 (Thr 202, Tyr 204), anti-ERK1/2, anti-phospho-AKT (Ser 473), anti-AKT, anti-phospho-mTOR (Ser 2448), anti-mTOR, anti-phospho-P70S6K (Thr 389), anti-P70S6K, anti-phospho-4E-BP1 (Thr 37, Thr 46), anti-4E-BP1, anti-EGFR, anti-IGFR, anti-CCNE1, anti-CCNB1 and anti-CDKN1C at final dilutions of 1:1000 (Cell Signalling Technology, Danvers, MA, USA) and anti-β-actin at final dilution of 1:5000 (Calbiochem, San Diego, CA, USA). Western blots signals were visualized using a chemiluminescence kit (Amersham Bioscience, Piscataway, NJ, USA) and quantified using ImageJ software. The intensity of individual bands was expressed relative to the control signal.
Cell cycle analysis.
Cell cycle analysis was carried out as described in our previous studies26,27. Briefly, cellswere cultured in 6-well plates with 5 × 10⁴ cells per well and treated with 5 μM gefitinib and/or 100 nM
everoli-mus for 48 h. Non-adherent cells were collected, and adherent cells were washed twice with cold PBS, harvested by trypsinization and centrifuged at 500 g for 10 min. Cell pellets were washed with PBS, and cell membranes were disrupted by repeated cycles of freezing and thawing in liquid nitrogen. Then, cells were resuspended in 200 μl of ribonuclease A solution (1 mg/ml) and stained with 200 μl of propidium iodide solution at a final concentration of 50 μg/ml (Sigma-Aldrich, St Louis, MO, USA). Fluorescence of cells was analysed by flow cytometry on a Cytomics FC 500 MPL Flow Cytometer (Beckman Coulter, Brea, CA, USA), and the percentage of cells at G0-G1, S and G2-M phases was determined using ModFit LT 2.0 software (Verity Software House, Topsham, ME, USA).
Apoptosis assay.
Apoptosis was analysed with FITC Annexin V Apoptosis Detection Kit I (BD Biosciences, San Diego, CA, USA), according to manufacturer’s protocol as described previously26,27. Cell preparation andtreatments were performed as in the cell cycle experiments. After centrifugation, cell pellets were resuspended in 100 μl of binding buffer and incubated with FITC annexin V and propidium iodide (PI) solution for 15 min at room temperature in the dark. Cells were analysed by flow cytometry, and the results were expressed as the percentage of apoptotic cells, including both early (annexin V-positive, PI negative) and late (annexin V-positive, PI positive) apoptotic cells, relative to the total number of cells.
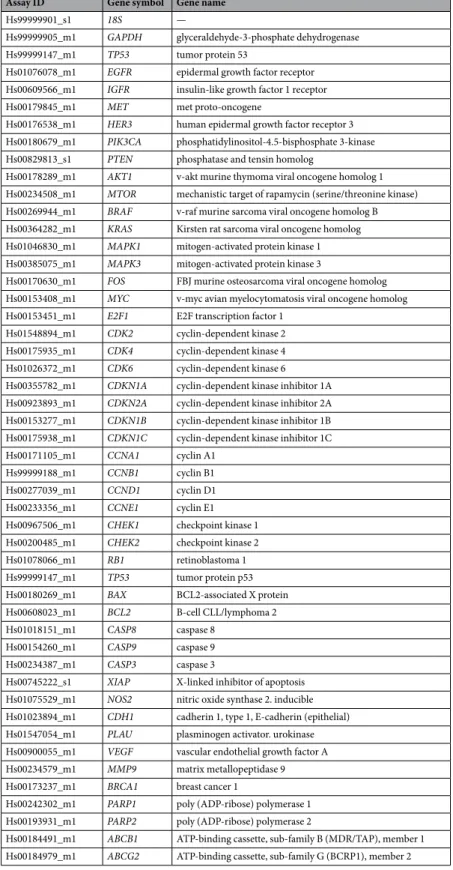
Taqman low density arrays (TLDA) and relative quantification analysis.
The expression of 43 genes selected in a previous study and involved in different biological processes in breast carcinogenesis was quantified by real time quantitative PCR using custom-made TaqMan low density arrays (TLDA, Applied Biosystems, Foster City, CA, USA)27. A qualitative review of the literature on breast cancer was conducted to select 43 genes involvedin different biological processes in breast carcinogenesis (apoptosis, cell cycle, signalling pathways, angiogenesis, DNA repair, drug resistance) (Table 2). Two housekeeping genes were used as internal controls: GAPDH and
18S. Gene expression analysis was performed as described previously27. Cells were cultured in 10 mm dishes and
treated with 5 µM gefitinib and/or 100 nM everolimus for 48 h. Total RNA was extracted from cell lines using RNeasy Mini Kit according to the manufacturer’s instructions (Qiagen, Crawley, UK). The integrity and con-centration of the RNA samples were assessed using an Agilent 2100 Bioanalyzer (Agilent Technologies, Foster City, CA, USA). Reverse transcription was performed with 1 µg of total RNA in a 20 µl reaction volume using the High Capacity cDNA Kit with RNase inhibitor according to the manufacturer’s instructions (Applied Biosystems, Foster City, CA, USA). Reaction conditions were 25 °C for 10 min, 37 °C for 120 min and 85 °C for 5 min. The resulting cDNA samples were mixed with 2X TaqMan Universal PCR Master Mix (Applied Biosystems). A total of 100 μl of each reaction mixture was loaded on the TLDA cards and centrifuged twice for 1 min at 1200 rpm. Cards were sealed, and the quantitative real-time PCR amplification was performed using an ABI Prism 7900 HT Sequence Detection System according to the manufacturer’s instructions (Applied Biosystems). Threshold cycle values (Ct) were determined with RQ Manager 1.2 software (Applied Biosystems). Each Ct value was normalized to the average Ct of GAPDH and 18S. The relative quantification (RQ) of gene expression was determined using the comparative ΔΔCt method29. Unsupervised hierarchical clustering analysis based on ΔCt values was
per-formed to identify differential gene expression profiles. Gene expression profiles were clustered using Euclidean distance and Ward’s method with SEM (Statistics Epidemiology Medicine) statistical software30.
Statistical analysis.
All experiments were repeated at least 3 times, except the gene expression experiments and western blots analyses, which were performed twice. All data are expressed as the mean ± SD. The statistical significance of differences between treated cells and untreated cells was assessed using two-way analysis of vari-ance (ANOVA) followed by an unpaired Student’s t-test. A probability value p < 0.05 was considered significant. Concerning the gene expression results, significant differences between the mean values of relative quantifi-cation (RQ) were evaluated only for genes that were 2-fold up- or downregulated after combination treatments. These differences were determined using an unpaired Student’s t-test between combination and everolimus (p/ Evero) or gefitinib (p/Gef) treatments. A probability value p < 0.05 was considered significant.Results
Growth inhibitory effect of everolimus and gefitinib in TNBC cell lines.
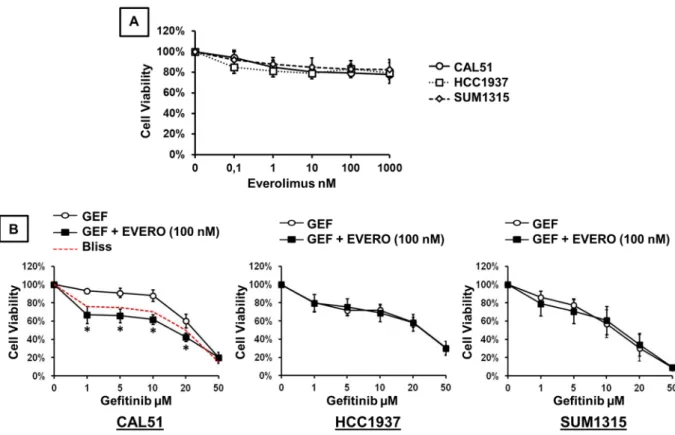
The growth inhibitory effects of everolimus and gefitinib were analysed by XTT assay in three TNBC cell lines. The drug concentrations used in this study are close to the median peak plasma concentrations reported in clinical pharmacokinetics studies31–34. We examined the in vitro sensitivity of TNBC cell lines to increasing concentrations (0.1, 1, 10, 100and 1000 nM) of everolimus alone (Fig. 1A). When we exposed cells to everolimus at concentrations ranging from 0.1 to 1000 nM, cell viability was reduced by approximately 20% at the concentration of 100 nM. This growth
Assay ID Gene symbol Gene name
Hs99999901_s1 18S —
Hs99999905_m1 GAPDH glyceraldehyde-3-phosphate dehydrogenase
Hs99999147_m1 TP53 tumor protein 53
Hs01076078_m1 EGFR epidermal growth factor receptor
Hs00609566_m1 IGFR insulin-like growth factor 1 receptor
Hs00179845_m1 MET met proto-oncogene
Hs00176538_m1 HER3 human epidermal growth factor receptor 3
Hs00180679_m1 PIK3CA phosphatidylinositol-4.5-bisphosphate 3-kinase
Hs00829813_s1 PTEN phosphatase and tensin homolog
Hs00178289_m1 AKT1 v-akt murine thymoma viral oncogene homolog 1
Hs00234508_m1 MTOR mechanistic target of rapamycin (serine/threonine kinase)
Hs00269944_m1 BRAF v-raf murine sarcoma viral oncogene homolog B
Hs00364282_m1 KRAS Kirsten rat sarcoma viral oncogene homolog
Hs01046830_m1 MAPK1 mitogen-activated protein kinase 1
Hs00385075_m1 MAPK3 mitogen-activated protein kinase 3
Hs00170630_m1 FOS FBJ murine osteosarcoma viral oncogene homolog
Hs00153408_m1 MYC v-myc avian myelocytomatosis viral oncogene homolog
Hs00153451_m1 E2F1 E2F transcription factor 1
Hs01548894_m1 CDK2 cyclin-dependent kinase 2
Hs00175935_m1 CDK4 cyclin-dependent kinase 4
Hs01026372_m1 CDK6 cyclin-dependent kinase 6
Hs00355782_m1 CDKN1A cyclin-dependent kinase inhibitor 1A
Hs00923893_m1 CDKN2A cyclin-dependent kinase inhibitor 2A
Hs00153277_m1 CDKN1B cyclin-dependent kinase inhibitor 1B
Hs00175938_m1 CDKN1C cyclin-dependent kinase inhibitor 1C
Hs00171105_m1 CCNA1 cyclin A1
Hs99999188_m1 CCNB1 cyclin B1
Hs00277039_m1 CCND1 cyclin D1
Hs00233356_m1 CCNE1 cyclin E1
Hs00967506_m1 CHEK1 checkpoint kinase 1
Hs00200485_m1 CHEK2 checkpoint kinase 2
Hs01078066_m1 RB1 retinoblastoma 1
Hs99999147_m1 TP53 tumor protein p53
Hs00180269_m1 BAX BCL2-associated X protein
Hs00608023_m1 BCL2 B-cell CLL/lymphoma 2
Hs01018151_m1 CASP8 caspase 8
Hs00154260_m1 CASP9 caspase 9
Hs00234387_m1 CASP3 caspase 3
Hs00745222_s1 XIAP X-linked inhibitor of apoptosis
Hs01075529_m1 NOS2 nitric oxide synthase 2. inducible
Hs01023894_m1 CDH1 cadherin 1, type 1, E-cadherin (epithelial)
Hs01547054_m1 PLAU plasminogen activator. urokinase
Hs00900055_m1 VEGF vascular endothelial growth factor A
Hs00234579_m1 MMP9 matrix metallopeptidase 9
Hs00173237_m1 BRCA1 breast cancer 1
Hs00242302_m1 PARP1 poly (ADP-ribose) polymerase 1
Hs00193931_m1 PARP2 poly (ADP-ribose) polymerase 2
Hs00184491_m1 ABCB1 ATP-binding cassette, sub-family B (MDR/TAP), member 1
Hs00184979_m1 ABCG2 ATP-binding cassette, sub-family G (BCRP1), member 2
inhibitory effect remained stable at higher concentrations. The concentration of everolimus required to reach the IC50 was higher than 1000 nM in the 3 TNBC cell lines. We then examined the in vitro sensitivity of TNBC cell lines to increasing concentrations of gefitinib combined with 100 nM everolimus. As shown in Fig. 1B, cell viabil-ity was reduced in a dose-dependent manner in all cell lines. When gefitinib was combined with 100 nM everoli-mus, no significant inhibition of cell proliferation was observed in HCC-1937 and SUM-1315 cells compared to that with gefitinib alone. Everolimus did not improve the effect of gefitinib in these two cell lines. By contrast, addition of everolimus in CAL-51 cells significantly increased the cytotoxic effect of gefitinib at concentrations ranging from 1 to 20 µM (p < 0.0001). Comparing the experimental and the Bliss theoretical curves, we observed a synergistic effect of combination treatments. The IC50 value of gefitinib alone in CAL-51 cells was 25.15 µM whereas the IC50 value of the combination with everolimus was 15.49 µM.
Effect of everolimus and gefitinib on cell cycle distribution and apoptosis in TNBC cell
lines.
We next investigated the effects of therapies on cell cycle distribution and apoptosis. Cells were treated for 48 h with 5 µM gefitinib and 100 nM everolimus as single agents and in combination. Analysis of cell cycle pro-gression and apoptosis was performed by both annexin V-FITC and propidium iodide staining. Quantification of positive cells was evaluated by flow cytometry and expressed as a percentage of the total number of cells. In the CAL-51 cell line, everolimus and gefitinib, alone or in combination, significantly affected cell cycle distribution. We observed cell cycle arrest in the G1 phase, associated with a significant decrease in the proportion of cells in S and G2 phases, in treated cells compared with untreated cells (Fig. 2A). The combined treatment also induced a significant increase in the proportion of cells in the G1 phase compared with that with either everolimus or gefitinib given alone. Everolimus and gefitinib also induced cell cycle arrest in the G1 phase in HCC-1937 and SUM-1315 cells. Combination treatments also induced significant cell cycle arrest compared with that with either drug alone. Concerning the effect on apoptosis, only gefitinib and combined treatment induced significant cell death compared to that in the untreated control condition (Fig. 2B). Everolimus alone had no significant impact on apoptosis in all cell lines. In SUM-1315 cells, a significant increase in apoptotic cells was observed with com-bination treatments compared with that with everolimus alone. The comcom-bination treatments did not significantly increase apoptosis compared to that with gefitinib alone.Figure 1. Cytotoxic effect of gefitinib and everolimus on TNBC cell lines. Cell viability assay was performed using the XTT assay as described in the methods section. (A) Cells were treated for 72 h with increasing concentrations of everolimus. (B) Cells were treated for 72 h with increasing concentrations of gefitinib (GEF) combined with 100 nM everolimus (EVERO). Results are expressed as percent of viability of untreated cell and are mean value ± SD of three independent experiments. The dashed red curve represents the expected Bliss values if the combined effects are additive. *p < 0.0001 for comparison between cells treated with gefitinib as a single agent (1, 5, 10, 20 and 50 μM) and cells treated with gefitinib (1, 5, 10, 20 and 50 μM) combined with 100 nM everolimus.
Effect of everolimus combined with gefitinib on activation status of the key components of the
RAS/MAPK and PI3K/AKT/mTOR signalling pathways.
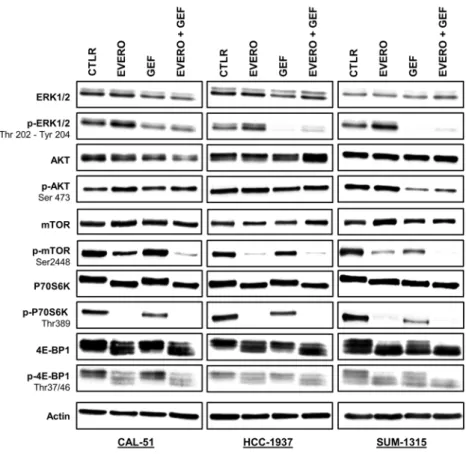
To assess the effects of gefitinib and everoli-mus on the PI3K/AKT/mTOR and RAS/MAPK signalling pathways, we analysed the protein expressions of total and phosphorylated forms of ERK, AKT, mTOR, P70S6K and 4E-BP1 by Western blotting. CAL-51, HCC-1937 and SUM-1315 cell lines were treated for 24 h with 5 µM gefitinib and 100 nM everolimus as single agents and in combination. Everolimus had no impact on the activation of ERK1/2, whereas gefitinib alone and combined treatment decreased the phosphorylation levels of ERK1/2 in all cell lines (Fig. 3). This effect was less marked in the CAL-51 cell line (1.9-fold and 1.8-fold, respectively after gefitinib and combination treatment exposure). In the HCC-1937 and CAL-51 cell lines, no effects were observed on phosphorylated form of AKT with the treat-ments. In SUM-1315 cells, only gefitinib alone and combined with everolimus clearly inhibited AKT phosphoryl-ation (13.1-fold, respectively after combinphosphoryl-ation treatment exposure). As expected, phosphorylphosphoryl-ation of mTOR was markedly reduced only in the presence of everolimus in all cell lines (1.9-fold, 19.9-fold and 5.5-fold, respectively in CAL-51, HCC-1937 and SUM-1315). Combined treatments synergistically inhibited mTOR phosphorylation in CAL-51 by 5.9-fold in comparison with cells treated with everolimus alone. In SUM-1315 cells, combined treatments completely abolished mTOR phosphorylation. Similarly, the P70S6K protein was completely dephos-phorylated by everolimus as a single agent and in combination with gefitinib in all cell lines. In SUM-1315 and HCC-1937 cells, gefitinib alone was also able to reduce the phosphorylation of mTOR and P70S6K but less effec-tively than everolimus. Regarding 4E-BP1, everolimus clearly reduced the levels of the phosphorylated form only in CAL-51 cell line (1.6-fold and 2.1-fold, respectively after everolimus and combination treatment exposure). In the other two cell lines, everolimus had no effect or a weak effect on 4E-BP1 phosphorylation. Despite some differences, total forms of all these proteins appeared unaffected by everolimus or gefitinib.Altered expression of cell cycle-related genes and proteins in CAL-51 cells after everolimus
and gefitinib treatments.
Above, we showed a synergistic effect of combination treatments in cell prolif-eration and cell cycle experiments in the CAL-51 cell line. For further investigation, we analysed the expression of 44 genes involved in different biological processes (apoptosis, cell cycle, signalling pathways, angiogenesis, DNA repair, drug resistance) in this cell line after exposure to 5 µM gefitinib and 100 nM everolimus for 48 h. Hierarchical cluster analysis showed two distinct clusters allowing the differentiation of everolimus-treated cells from cells not treated with everolimus (Fig. 4). The data produced a dendrogram with cells falling into two groups characterized by different gene expression profiles. A cluster of 18 downregulated genes discriminated everolimus-treated cells from cells not treated with everolimus. This cluster included 8 genes involved in cell cycle control (E2F1, CDK2, CDK4, CCNA1, CCNB1, CCNE1, CHEK1, CHEK2, CDKN1A) and others genes related to DNA repair (BRCA1, PARP1, PARP2), drug resistance (ABCB1, ABCG2), and signalling pathways (ERBB3,MAPK3, FOS).
Figure 2. Effect of gefitinib and everolimus on cell cycle progression and apoptosis in TNBC cell lines. Cells were treated for 48 h with 5 µM gefitinib (Gef) and 100 nM everolimus (Evero), as single agents and in combination (E + G). Cells were stained with propidium iodide for analysis of cell cycle (A) and annexin V-FITC for analysis of apoptosis (B). Cell cycle distribution and quantification of positive cells were evaluated by flow cytometry. Data represent the mean value ± SD of triplicate experiments. *p < 0.05; **p < 0.01 for comparison between treated cells and untreated cells (Ctlr) using Student’s t-test.
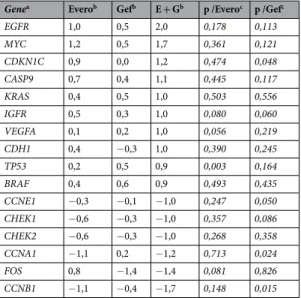
To assess the effect of the therapies on gene expression analysis, we calculated the relative quantification (RQ) value of each gene. Differentially expressed genes that were 2-fold up- or downregulated by a combination of everolimus plus gefitinib are summarized in Table 3. Results from the relative quantification (RQ) of gene expres-sion analysis revealed significant differences in the expresexpres-sion of 6 cell cycle genes (Table 3). Combined treat-ment markedly decreased mRNA expression of checkpoint regulators CHEK1 and CHEK2, as well as cyclin A1 (RQ = 0.4, p = 0.024), cyclin B1 (RQ = 0.3, p = 0.015) and cyclin E1 (RQ = 0.5, p = 0.050), thus inhibiting DNA damage repair and cell cycle progression. Another cell cycle-related gene, the cyclin-dependent kinase inhibitor gene CDKN1C, was significantly upregulated (RQ = 2.3, p = 0.048). Interestingly, among the genes of signalling pathways, four genes were upregulated by at least two-fold following combined treatment: EGFR, IGFR, KRAS and BRAF, but these differences did not reach statistical significance.
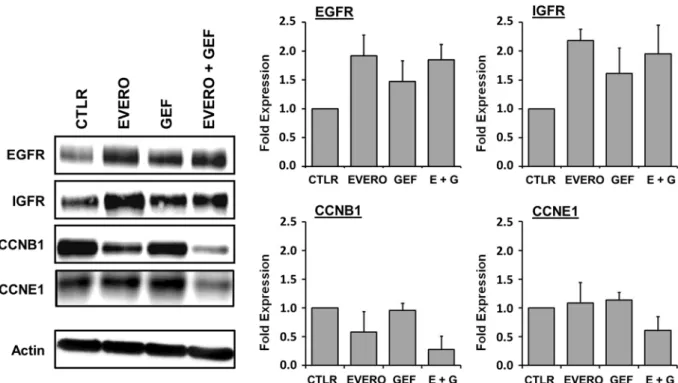
The expression of several proteins encoded by these genes was also analysed in CAL-51 cells via Western blotting (Fig. 5). Similar to the gene expression analysis, the Western blot analysis showed that combined therapy reduced the expression levels of cyclin B1 and cyclin E1, compared to those with monotherapy. The combination treatment exposure reduced cyclin B1 expression by up to 2.5-fold and 5-fold, compared with that with everoli-mus and gefitinib as single agents, respectively. Cyclin E1 was downregulated by 2-fold after combination treat-ment compared with monotherapy. Western blotting results also confirmed increased expression of the tyrosine kinase receptors EGFR and IGFR after treatment. Everolimus and gefitinib, as single agents or in combination, increased the expression of EGFR and IGFR by up to 2-fold compared with that in the untreated control group.
Discussion
Triple-negative breast cancer is more aggressive than other types of breast cancers and remains the most deadly of all breast cancer types. Currently, approximately 15–20% of breast cancers are triple-negative and the treatment of patients with TNBC still presents a major challenge in breast cancer research35. TNBC is generally characterized
by EGFR overexpression and frequent dysregulation of the PI3K/AKT/mTOR signalling pathway. These features are considered potential therapeutic targets in TNBC17. Recently, we investigated the in vitro effect of various
EGFR inhibitors in cultured TNBC cell lines. We reported that anti-EGFR agents alone inhibited the RAS/MAPK signalling pathway more effectively than the PI3K/AKT/mTOR pathway26,27. These data provide evidence that the
efficacy of anti-EGFR targeted therapies in TNBC can be impaired by alterations in the PI3K/AKT/mTOR axis. In the present study, we provided lines of evidence supporting the rationale for combining the mTOR inhib-itor everolimus with gefitinib for TNBC with genetic alterations in the PI3K/AKT/mTOR signalling pathway. Figure 3. Western blot analysis of EGFR-dependent signalling pathways in TNBC cell lines treated with gefitinib and everolimus. Western blot analysis with the indicated antibodies was performed as described in the materials and methods section using 20 µg of whole cell protein extract. Cell lines were exposed for 24 h to 5 µM gefitinib (GEF) and/or 100 nM everolimus (EVERO). Beta-actin antibody was used as a loading control. Cropped blots from different gels are grouped together for clear illustration. The full-length gels are shown in the Supplementary Information. Data shown are representative of two independent experiments.
We examined the antitumour activity of these targeted therapies in TNBC cell lines that overexpress EGFR and do or do not harbour genetic alterations in PI3K/AKT/mTOR signalling pathway. The CAL-51 cell line harbours an activating mutation in PI3K (E542K), the gene that encodes the p100α catalytic subunit of PI3K, and homozy-gous deletion of PTEN, leading to the constitutive activation of the PI3K/AKT/mTOR signalling pathway24. The
E542K mutation occurs in approximatively 8% of TNBC. The HCC-1937 cell line also harbours homozygous deletion of the PTEN gene. The SUM-1315 cell line has no mutational activation of the EGFR signalling pathways. We demonstrated that everolimus enhances the growth inhibitory effect of gefitinib at all concentrations tested in CAL-51 cells. We also observed that the combination treatment induced cell cycle arrest at the G1/S checkpoint and significantly increased apoptosis in this cell line. The cell cycle perturbations observed using flow cytometry are in accordance with the results from the gene expression analysis. Hierarchical cluster analysis grouped cells in two different clusters according to the presence or absence of everolimus. These two groups were characterized by different gene expression profiles including genes involved in cell cycle control such as CCNB1, CCNE1, CHEK1, and CHEK2. In addition, protein expression analysis showed downregulated expression of cyclin E1 and cyclin B1 which are two key molecules for G1/S and G2/M transition during the cell cycle. Collectively, these results suggest that the potential benefit of combination therapy with everolimus and gefitinib might be restricted to mutant PI3K cells.
Figure 4. Unsupervised hierarchical clustering analysis showing the differentially expressed genes in CAL-51 cells treated with gefitinib and everolimus. The heatmap was generated by SEM statistical software according to ΔCt values (33). Genes in red and green indicate expression of upregulated and downregulated genes, respectively. Cells were treated or not (CTLR) for 48 h with 5 µM gefitinib (GEF) and 100 nM everolimus (EVERO), as single agents and in combination (E + G). Two independent experiments were performed.
Several studies have reported that simultaneous inhibition of EGFR and mTOR could provide a synergistic antitumour effect in various human cancers, including TNBC20–23. In vitro studies have shown that everolimus
enhances the efficacy of gefitinib in gefitinib-resistant NSCLC cells21,36. Evidence supports the dysregulation of
EGFR downstream signalling pathways, including PI3K or PTEN mutations, as a possible mechanism of pri-mary resistance37,38. Activating mutations of PI3K lead to persistent activation of the PI3K/AKT/mTOR pathway
despite EGFR inhibition and have been shown to confer resistance in gefitinib-sensitive lung cancer cell lines39.
An in vitro study investigated the combined inhibitory effect of everolimus and gefitinib in EGFR wild-type NSCLC cell lines with or without PI3KCA mutation. Consistent with our result, the authors demonstrated that concomitant inhibition of the EGFR and mTOR proteins induced cell proliferation inhibition and cell cycle arrest in EGFR-wild-type NSCLC cells with a PI3KCA mutation20. Other preclinical studies showed that simultaneous
targeting of EGFR and mTOR with the tyrosine kinase inhibitor erlotinib and rapamycin, respectively, inhibited the activation of the PI3K/AKT/mTOR signalling pathway, resulting in the inhibition of cell proliferation and cell cycle progression in colorectal carcinoma cells22,40.
Moreover, Lehmann et al. previously reported that TNBC cell lines with activated PI3K/AKT signalling due to PI3KCA mutations or PTEN deficiency are highly sensitive to dual PI3K/mTOR inhibition24. The authors
demonstrated that PI3KCA mutations predicted sensitivity to dual PI3K/mTOR inhibition, but PTEN deficiencies did not correlate with sensitivity. The PTEN protein blocks PI3K and negatively regulates the PI3K/AKT/mTOR pathway. Loss of PTEN expression leads to activation of this pathway by persistent signalling through AKT41,42.
A further activating mutation of PI3KCA amplifies the activation of AKT and the resistance to EGFR inhibitors. The presence of coexisting mutations in PI3KCA and PTEN interferes with the efficacy of EGFR inhibitors. In our study, we showed that dual inhibition of mTOR and EGFR induced a synergistic antiproliferative effect in the
PI3KCA and PTEN-mutant CAL-51 cell line, but not in the PTEN-null HCC-1937 cell line. The PI3KCA mutation
could thus predict sensitivity to the mTOR inhibitor everolimus combined with gefitinib in TNBC.
Reports from other authors have shown that lapatinib, a dual inhibitor of EGFR and HER2, combined with the mTOR inhibitor rapamycin induced significant in vitro growth inhibition of TNBC cell lines and synergisti-cally reduced tumour growth in TNBC cell-derived xenograft models23. According to the authors, the synergistic
effects observed with combination therapy were due, at least in part, to a decrease in AKT activation induced by mTOR inhibitors. Indeed, it has been reported that mTOR inhibition can lead to activation of the PI3K/AKT/ mTOR signalling pathway through activation of AKT, possibly induced by a feedback mechanism43,44. They also
demonstrated that EGFR inhibition abrogated rapamycin-induced AKT activation in TNBC cells. Consistent with these results, we observed an increase in AKT phosphorylation in the CAL-51 cell line when cells were treated with everolimus alone. This activation of AKT was then reversed by the addition of gefitinib (Fig. 3). Furthermore, it has been reported that phospho-AKT is highly expressed in TNBC and is strongly correlated with loss of PTEN expression and/or activating mutations in PI3K45.
Conclusions
In conclusion, the combination of gefitinib and everolimus may provide a potential therapeutic option for EGFR-expressing and PI3K-mutated TNBC patients. This therapeutic approach is interesting as activating muta-tions in PI3KCA are the most frequent next to TP53 mutamuta-tions in TNBC13,46,47. Although in vivo studies are
needed to confirm these results, our findings provide preclinical evidence supporting the rationale for combining Genea Everob Gefb E + Gb p /Everoc p /Gefc
EGFR 1,0 0,5 2,0 0,178 0,113 MYC 1,2 0,5 1,7 0,361 0,121 CDKN1C 0,9 0,0 1,2 0,474 0,048 CASP9 0,7 0,4 1,1 0,445 0,117 KRAS 0,4 0,5 1,0 0,503 0,556 IGFR 0,5 0,3 1,0 0,080 0,060 VEGFA 0,1 0,2 1,0 0,056 0,219 CDH1 0,4 −0,3 1,0 0,390 0,245 TP53 0,2 0,5 0,9 0,003 0,164 BRAF 0,4 0,6 0,9 0,493 0,435 CCNE1 −0,3 −0,1 −1,0 0,247 0,050 CHEK1 −0,6 −0,3 −1,0 0,357 0,086 CHEK2 −0,6 −0,3 −1,0 0,268 0,358 CCNA1 −1,1 0,2 −1,2 0,713 0,024 FOS 0,8 −1,4 −1,4 0,081 0,826 CCNB1 −1,1 −0,4 −1,7 0,148 0,015
Table 3. Differentially expressed genes in CAL-51 cells treated with everolimus and gefitinib alone and in combination. aList of genes that were 2-fold up- or downregulated after combination treatments. bData
are presented as log2 of the average relative quantification after everolimus (100 nM) and gefitinib (5 µM) treatments as single agents (Evero; Gef) and in combination (E + G). A value of 1 corresponds to a two-fold upregulation and a value of −1 corresponds to a two-fold downregulation. cStatistical differences between
the mTOR inhibitor everolimus with gefitinib for the treatment of TNBC with genetic alterations of the PI3K/ AKT/mTOR signalling pathway. This combination therapy warrants further investigation in patients with TNBC through a prospective clinical trial.
Data availability
The datasets generated or analysed during the current study are available from corresponding author upon reasonable request.
Received: 18 July 2019; Accepted: 24 March 2020; Published: xx xx xxxx
References
1. Turashvili, G. & Brogi, E. Tumor Heterogeneity in Breast Cancer. Front Med (Lausanne) 4, 227, https://doi.org/10.3389/ fmed.2017.00227 (2017).
2. Foulkes, W. D., Smith, I. E. & Reis-Filho, J. S. Triple-negative breast cancer. N Engl J Med 363, 1938–1948, https://doi.org/10.1056/ NEJMra1001389 (2010).
3. Guarneri, V. et al. Prognostic value of pathologic complete response after primary chemotherapy in relation to hormone receptor status and other factors. J Clin Oncol 24, 1037–1044, https://doi.org/10.1200/jco.2005.02.6914 (2006).
4. Liedtke, C. et al. Response to neoadjuvant therapy and long-term survival in patients with triple-negative breast cancer. J Clin Oncol
26, 1275–1281, https://doi.org/10.1200/jco.2007.14.4147 (2008).
5. Rimawi, M. F. et al. Epidermal growth factor receptor expression in breast cancer association with biologic phenotype and clinical outcomes. Cancer 116, 1234–1242, https://doi.org/10.1002/cncr.24816 (2010).
6. Omarini, C. et al. Neoadjuvant treatments in triple-negative breast cancer patients: where we are now and where we are going.
Cancer Manag Res 10, 91–103, https://doi.org/10.2147/cmar.s146658 (2018).
7. Sporikova, Z., Koudelakova, V., Trojanec, R. & Hajduch, M. Genetic Markers in Triple-Negative Breast Cancer. Clin Breast Cancer
18, e841–e850, https://doi.org/10.1016/j.clbc.2018.07.023 (2018).
8. Kazandjian, D. et al. FDA Approval of Gefitinib for the Treatment of Patients with Metastatic EGFR Mutation-Positive Non-Small Cell Lung Cancer. Clin Cancer Res 22, 1307–1312, https://doi.org/10.1158/1078-0432.ccr-15-2266 (2016).
9. Al-Mahmood, S., Sapiezynski, J., Garbuzenko, O. B. & Minko, T. Metastatic and triple-negative breast cancer: challenges and treatment options. Drug Deliv Transl Res 8, 1483–1507, https://doi.org/10.1007/s13346-018-0551-3 (2018).
10. Baselga, J. et al. Phase II and tumor pharmacodynamic study of gefitinib in patients with advanced breast cancer. J Clin Oncol 23, 5323–5333, https://doi.org/10.1200/jco.2005.08.326 (2005).
11. Fresno Vara, J. A. et al. PI3K/Akt signalling pathway and cancer. Cancer Treat Rev 30, 193–204, https://doi.org/10.1016/j. ctrv.2003.07.007 (2004).
12. McAuliffe, P. F., Meric-Bernstam, F., Mills, G. B. & Gonzalez-Angulo, A. M. Deciphering the role of PI3K/Akt/mTOR pathway in breast cancer biology and pathogenesis. Clin Breast Cancer 10(Suppl 3), S59–65, https://doi.org/10.3816/CBC.2010.s.013 (2010).
Figure 5. Western blot analysis of proteins encoded by genes differentially expressed in the CAL-51 cell line after exposure to gefitinib and everolimus. Cells were cultured for 48 h in the presence or absence (CTLR) of 5 µM gefitinib (GEF) and 100 nM everolimus (EVERO). Beta-actin antibody was used as a loading control. Cropped blots from different gels are grouped together for clear illustration. The full-length gels are shown in the Supplementary Information. Bar charts depict densitometric quantification of Western blot signals as described in the materials and methods section. Data shown are representative of two independent experiments.
13. Cossu-Rocca, P. et al. Analysis of PIK3CA Mutations and Activation Pathways in Triple Negative Breast Cancer. PLoS One 10, e0141763, https://doi.org/10.1371/journal.pone.0141763 (2015).
14. Stemke-Hale, K. et al. An integrative genomic and proteomic analysis of PIK3CA, PTEN, and AKT mutations in breast cancer.
Cancer Res 68, 6084–6091, https://doi.org/10.1158/0008-5472.can-07-6854 (2008).
15. Laplante, M. & Sabatini, D. M. mTOR signaling in growth control and disease. Cell 149, 274–293, https://doi.org/10.1016/j. cell.2012.03.017 (2012).
16. Baselga, J. et al. Everolimus in postmenopausal hormone-receptor-positive advanced breast cancer. N Engl J Med 366, 520–529,
https://doi.org/10.1056/NEJMoa1109653 (2012).
17. Costa, R. L. B., Han, H. S. & Gradishar, W. J. Targeting the PI3K/AKT/mTOR pathway in triple-negative breast cancer: a review.
Breast Cancer Res Treat 169, 397–406, https://doi.org/10.1007/s10549-018-4697-y (2018).
18. Motzer, R. J. et al. Efficacy of everolimus in advanced renal cell carcinoma: a double-blind, randomised, placebo-controlled phase III trial. Lancet 372, 449–456, https://doi.org/10.1016/s0140-6736(08)61039-9 (2008).
19. Yao, J. C. et al. Everolimus for advanced pancreatic neuroendocrine tumors. N Engl J Med 364, 514–523, https://doi.org/10.1056/ NEJMoa1009290 (2011).
20. Huang, Y., Chen, Y., Mei, Q., Yu, S. & Xia, S. Combined inhibition of the EGFR and mTOR pathways in EGFR wild-type non-small cell lung cancer cell lines with different genetic backgrounds. Oncol Rep 29, 2486–2492, https://doi.org/10.3892/or.2013.2357 (2013). 21. La Monica, S. et al. Everolimus restores gefitinib sensitivity in resistant non-small cell lung cancer cell lines. Biochem Pharmacol 78,
460–468, https://doi.org/10.1016/j.bcp.2009.04.033 (2009).
22. Li, B. et al. Simultaneous targeting of EGFR and mTOR inhibits the growth of colorectal carcinoma cells. Oncol Rep 28, 15–20,
https://doi.org/10.3892/or.2012.1786 (2012).
23. Liu, T. et al. Combinatorial effects of lapatinib and rapamycin in triple-negative breast cancer cells. Mol Cancer Ther 10, 1460–1469,
https://doi.org/10.1158/1535-7163.mct-10-0925 (2011).
24. Lehmann, B. D. et al. Identification of human triple-negative breast cancer subtypes and preclinical models for selection of targeted therapies. J Clin Invest 121, 2750–2767, https://doi.org/10.1172/jci45014 (2011).
25. Neve, R. M. et al. A collection of breast cancer cell lines for the study of functionally distinct cancer subtypes. Cancer Cell 10, 515–527, https://doi.org/10.1016/j.ccr.2006.10.008 (2006).
26. El Guerrab, A., Bamdad, M., Bignon, Y. J., Penault-Llorca, F. & Aubel, C. Anti-EGFR monoclonal antibodies enhance sensitivity to DNA-damaging agents in BRCA1-mutated and PTEN-wild-type triple-negative breast cancer cells. Mol Carcinog 56, 1383–1394,
https://doi.org/10.1002/mc.22596 (2017).
27. El Guerrab, A. et al. Anti-EGFR monoclonal antibodies and EGFR tyrosine kinase inhibitors as combination therapy for triple-negative breast cancer. Oncotarget 7, 73618–73637, https://doi.org/10.18632/oncotarget.12037 (2016).
28. Chou, T. C. Theoretical basis, experimental design, and computerized simulation of synergism and antagonism in drug combination studies. Pharmacol Rev 58, 621–681, https://doi.org/10.1124/pr.58.3.10 (2006).
29. Livak, K. J. & Schmittgen, T. D. Analysis of relative gene expression data using real-time quantitative PCR and the 2(-Delta Delta C(T)) Method. Methods 25, 402–408, https://doi.org/10.1006/meth.2001.1262 (2001).
30. Kwiatkowski, F., Girard, M., Hacene, K. & Berlie, J. [Sem: a suitable statistical software adaptated for research in oncology]. Bull
Cancer 87, 715–721 (2000).
31. Gombos, A., Barthelemy, P. & Awada, A. Evaluating the pharmacokinetics and pharmacodynamics of everolimus for treating breast cancer. Expert Opin Drug Metab Toxicol 11, 823–834, https://doi.org/10.1517/17425255.2015.1013464 (2015).
32. McKillop, D. et al. Tumor penetration of gefitinib (Iressa), an epidermal growth factor receptor tyrosine kinase inhibitor. Mol Cancer
Ther 4, 641–649, https://doi.org/10.1158/1535-7163.mct-04-0329 (2005).
33. Scheffler, M., Di Gion, P., Doroshyenko, O., Wolf, J. & Fuhr, U. Clinical pharmacokinetics of tyrosine kinase inhibitors: focus on 4-anilinoquinazolines. Clin Pharmacokinet 50, 371–403, https://doi.org/10.2165/11587020-000000000-00000 (2011).
34. Verheijen, R. B. et al. Pharmacokinetic Optimization of Everolimus Dosing in Oncology: A Randomized Crossover Trial. Clin
Pharmacokinet 57, 637–644, https://doi.org/10.1007/s40262-017-0582-9 (2018).
35. Abramson, V. G., Lehmann, B. D., Ballinger, T. J. & Pietenpol, J. A. Subtyping of triple-negative breast cancer: implications for therapy. Cancer 121, 8–16, https://doi.org/10.1002/cncr.28914 (2015).
36. Dong, S. et al. Everolimus synergizes with gefitinib in non-small-cell lung cancer cell lines resistant to epidermal growth factor receptor tyrosine kinase inhibitors. Cancer Chemother Pharmacol 70, 707–716, https://doi.org/10.1007/s00280-012-1946-3 (2012). 37. Balsara, B. R. et al. Frequent activation of AKT in non-small cell lung carcinomas and preneoplastic bronchial lesions. Carcinogenesis
25, 2053–2059, https://doi.org/10.1093/carcin/bgh226 (2004).
38. Kokubo, Y. et al. Reduction of PTEN protein and loss of epidermal growth factor receptor gene mutation in lung cancer with natural resistance to gefitinib (IRESSA). Br J Cancer 92, 1711–1719, https://doi.org/10.1038/sj.bjc.6602559 (2005).
39. Engelman, J. A. et al. Allelic dilution obscures detection of a biologically significant resistance mutation in EGFR-amplified lung cancer. J Clin Invest 116, 2695–2706, https://doi.org/10.1172/jci28656 (2006).
40. Wang, Q. et al. Combination of mTOR and EGFR kinase inhibitors blocks mTORC1 and mTORC2 kinase activity and suppresses the progression of colorectal carcinoma. PLoS One 8, e73175, https://doi.org/10.1371/journal.pone.0073175 (2013).
41. Bianco, R. et al. Loss of PTEN/MMAC1/TEP in EGF receptor-expressing tumor cells counteracts the antitumor action of EGFR tyrosine kinase inhibitors. Oncogene 22, 2812–2822, https://doi.org/10.1038/sj.onc.1206388 (2003).
42. Sos, M. L. et al. PTEN loss contributes to erlotinib resistance in EGFR-mutant lung cancer by activation of Akt and EGFR. Cancer
Res 69, 3256–3261, https://doi.org/10.1158/0008-5472.can-08-4055 (2009).
43. Carracedo, A. et al. Inhibition of mTORC1 leads to MAPK pathway activation through a PI3K-dependent feedback loop in human cancer. J Clin Invest 118, 3065–3074, https://doi.org/10.1172/jci34739 (2008).
44. Sun, S. Y. et al. Activation of Akt and eIF4E survival pathways by rapamycin-mediated mammalian target of rapamycin inhibition.
Cancer Res 65, 7052–7058, https://doi.org/10.1158/0008-5472.can-05-0917 (2005).
45. Comprehensive molecular portraits of human breast tumours. Nature 490, 61–70, https://doi.org/10.1038/nature11412 (2012). 46. Kriegsmann, M. et al. Mutational profiles in triple-negative breast cancer defined by ultradeep multigene sequencing show high rates
of PI3K pathway alterations and clinically relevant entity subgroup specific differences. Oncotarget 5, 9952–9965, https://doi. org/10.18632/oncotarget.2481 (2014).
47. Shah, S. P. et al. The clonal and mutational evolution spectrum of primary triple-negative breast cancers. Nature 486, 395–399,
https://doi.org/10.1038/nature10933 (2012).
Acknowledgements
The authors would like to thank all staff members of the Biological Resource Center of Jean Perrin Comprehensive Cancer Center for their help in centralizing and managing biological collections. The authors are also grateful Prof. Marie-Paul Vasson and Dr. Jeremy Talvas from the “Laboratoire de Biochimie, Biologie Moléculaire et Nutrition” (UFR Pharmacie, Université Clermont Auvergne) for the use of the flow cytometer. This study was supported by grants from «Comité de la Loire de la Ligue contre le Cancer».
Author contributions
C.A. conceived of the study and participated in its coordination. C.A., M.B., Y.J.B. and F.P.L. participated in the design of the study. A.E.G. carried out the in vitro experiments. A.E.G. and C.A. designed the experiments, interpreted the results and performed the statistical analysis. A.E.G. and C.A. drafted the manuscript. All authors read and approved the final manuscript.
Competing interests
The authors declare no competing interests.
Additional information
Supplementary information is available for this paper at https://doi.org/10.1038/s41598-020-63310-2. Correspondence and requests for materials should be addressed to C.A.
Reprints and permissions information is available at www.nature.com/reprints.
Publisher’s note Springer Nature remains neutral with regard to jurisdictional claims in published maps and institutional affiliations.
Open Access This article is licensed under a Creative Commons Attribution 4.0 International License, which permits use, sharing, adaptation, distribution and reproduction in any medium or format, as long as you give appropriate credit to the original author(s) and the source, provide a link to the Cre-ative Commons license, and indicate if changes were made. The images or other third party material in this article are included in the article’s Creative Commons license, unless indicated otherwise in a credit line to the material. If material is not included in the article’s Creative Commons license and your intended use is not per-mitted by statutory regulation or exceeds the perper-mitted use, you will need to obtain permission directly from the copyright holder. To view a copy of this license, visit http://creativecommons.org/licenses/by/4.0/.