- UW
DENDRITIC SOLIDIFICATION OF AQUEOUS by
Pradeep Kumar Rohatgi
S.B., Banaras Hindu University, 1961
S.M., Massachusetts Institute of Technology, 1963
SUBMITTED IN PARTIAL FULFILLMENT OF THE REQUIREMENTS FOR THE DEGREE OF
DOCTOR OF SCIENCE at the
MASSACHUSETTS INSTITUTE OF TECHNOLOGY May 1964 Signature of Author Department of Metallurgy May 1964 Thesis Supervisor Chairman, Departmental Conmittee on Graduate Students - Pr? essor C. M. Adams, Jr. / /
7~fessor
J. T. No
ton z-~ /Pradeep K. Rohatgi
SUBMITTED TO THE DEPARTMENT OF METALLURGY ON MAY 15, 1964, IN PARTIAL FULFILLDENT OF THE REQUIREENTS FOR THE DEGREE OF DOCTOR OF SCIENCE
ABSTRACT
Dendritic structures produced on fairly rapid solidification of aqueous solutions have been studied. Both single and mixed solute systems have been examined; the principal variables investigated are changing freezing rates, the nature of the solute and its concentration, combinations of solutes, and external magnetic and electrical fields. A theoretical analysis of dendritic growth is presented which predicts
the square root of dendrite spacing to be directly proportional to the diffusion coefficient of the solute and the constitutional supercooling, and inversely proportional to the solute concentration, the freezing rate, and the slope of the liquidus curve. The fact that the dendrite spacing increases with solute concentration has been attributed to the simultaneous increase in the capacity of the liquid to withstand
iii.
on the solute concentration, the primary dendrite spacing and the freezing rate; further breakdown of primary ice plates occurs when the concentration gradients in the interdendritic liquid exceed the maximum value which it can sustain. Under identical freezing conditions, the dendrite spacing is higher, the higher is the solute diffusivity.
Thermal analysis of the unidirectional freezing from a constant temperature chill shows that the solution at each plane is subjected to a spectrum of freezing rates. Dendrite spacing at each level has been found to be inversely proportional to the square root of the maximum freezing rate. During progressive solidification, the dendrite spacing changes with the changing freezing conditions by actual divergence or convergence of neighboring plates.
Application of external magnetic fields has been found to increase the dendrite spacing; however, the effect is measurable only in systems
in which the entire liquid is supercooled before the initiation of freezing. Possible interactions between external fields and aqueous freezing systems have been examined; the effect of a magnetic field has been attributed to its capacity of promoting the nucleation of ice.
Thesis Supervisor: Professor C. M. Adams, Jr. Professor of Metallurgy
TABLE OF CONTENTS Page Number TITLE PAGE . . . . . . . . . . . . . . . . . . . . . . . . ABSTRACT . . . . . . . . . . . . . . . . . . . . . . . . . . TABLE OF CONTENTS . . . . . . . . . . . . . . . . . . . . . iv LIST OF TABLES . . . . . . . . .. . . . .. . . ... vi
LIST OF ILLUSTRATIONS . . . . . . . . . . . . . . . . . . . vii
ACKNOWLEDGMENTS. . . . . . . . ... .. . ... xv
I. INTRODUCTION . . . . . . . . . . . . . . . . . . . . . . 1
II. THEORY .o. . o . . .. . . .. . . . . . . . 10
1. MASS TRANSPORT . . . . . . . . . . . . . . . . 10
2. UNIDIRECTIONAL FREEZING OF A SOLUTION FROM A CONSTANT TEMPERATURE CHILL . . . . . . . . . .
16
3. DIFFUSION IN SINGLE AND MIXED ELECTROLYTE SYSTEMS... . .... .... ... 21
4. THE EFFECT OF FIELDS ON TE FREEZING OF AQUEOUS SOLUTIONS .. . . .. ... .. .. .. 23
III. EXPERIMENTAL PROCEDURES . . . . . .. .. . . . . . 27
1. FREEZING SYSTEMS . . . . . . . . . . . . . . . 27
2. SPECIMEN PREPARATION AND MICROCRAPHY ... 29
3. APPLICATION OF EXTERNAL FIELDS . . . . . . .. 30
IV. RESULTS AND DISCUSSION . . . . . . . . . . . . .
33
1. GENERAL CHARACTER OF THE ICE-BRINE AGGREGATE OBTAINED ON FREEZING OF AQUEOUS SOLUTIONS . . 33
2. STRUCTURES OBTAINED WITH VARYING FREEZING RATES . . . . ... ... . 35
v. Page Number 3. THE EFFECT OF CONCENTRATION ON DENDRITIC
STRUCTURE . . ... . . . . . . . . . . .
40
4. SECONDARY BREAKDOWN OF PRIMARY ICE DENDRITES . 43 5. THE EFFECT OF SOLUTE DIFFUSIVITY OF DENDRITE SPACING . . .0... . . . .
45
6. SOLIDIFICATION STRUCTURES FROM MIXED SOLUTIONS
45
7. THE EFFECT OF EXTERNAL FIELD ON THE DENDRITIC PATTERN . . . . .47
V. CONCLUSIONS . . . . . . . . . - - - . . . 51
VI. SUGGESTIONS FOR FURTHER WORK... . . . . . - - . . . .
53
VII. APPENDIX I: DEFINITIONS OF SYMBOLS USED IN TEE TEXT . .
54
VIII. APPENDIX II: SOLIDIFICATION PATTERN OF 1 N POTASSIUM CHLORIDE SOLUTION IN CONTACT WITH A CHILL AT -700C . . 57
IX. APPENDIX III: ANALYSIS OF CHILL SURFACE TEMPERATURE . .
64
X. APPENDIX IV: CALCULATION OF CONSTITUTIONAL SUPERCOOLING IN THE INTERDENDRITIC LIQUID . . .. .. . . . . . ..
66
XI. TABLES . . . ... . . ... . . . . .- 67
XII. ILLUSTRATIONS .. . .. . . .. ...
73
XIII. BIBLIOGRAPHY . . . . . - 108
LIST OF TABLES
Table Page
Number Title Number
I Observations on Phase Boundary Movements During Unidirectional Freezing of 1 N Potassium Chloride
Solution Against a -70* C Chill . . . . . . .. .. 67
II Calculated Temperature and Freezing Rate Distributions at 2 Centimeters from a -70* C Chilled Surface During Unidirectional Freezing of 1 N Potassium Chloride
Solution . . . . . . . . . . . . . . . . . . . . . 68 III Measured Dendrite Spacings and Calculated Maximum
Freezing Rates at Different Distances from a -70* C
Chill for Freezing of 1 N potassium Chloride Solution. 69
IV Dendrite Spacing Measurements on Droplets of Sodium Chloride Solutions at Different Concentrations, in the Absence and in the Presence of an External
Magnetic Field . . . . . . . 70
V Dendrite Spacing Measurements on Ingots at Different Distances from a -70* C Chilled Surface for Different Solutions . . . . . . . . . . . . . . . . . . . . . 71 VI Diffusion Coefficients for Single and Binary
vii.
LIST OF ILLUSTRATIONS
Figure Page
Number TITLE Number
1 Concentration Profile Ahead of a Moving
Solid-Liquid Interface . . . . . . . . . 73
2 Actual Temperature and Liquidus Temperature Profiles Ahead of the Interface. Finite Temperature Gradient In the Liquid. . . . . . . . . . . . . .. . . . 73
3
Same as Figure 2 Except with Negligible TemperatureGradient in Liquid . . . . . . . . . . . . . . . . . 73
4
Schematic Representation of Concentration Distribution in the Interdendritic Liquid. . . . . . . . . . . .74
5 Actual Temperature and Liquidus Temperature
Distributions in the Interdendritic Liquid . . . . . 74 6 Concentration Profiles in the Interdendritic Liquid
at Different Stages of Growth. . . . . . . . . . .. 75
7
a. Phase Diagram of potassium chloride-water System b. Phase Distribution Under a Temperature Gradient,Equilibrium Conditions. . . . . . . . . . . . . 76 c. Phase Distribution Under a Temperature Gradient,
Figure Page
Number Title Number
8 Schematic Representation of Variation in Heat Content of Aqueous Solutions During Solidification
Cycle . . . .. . . . - - - 77
9 Schematic Representation of Temperature Profiles When an Aqueous Solution is Brought into Contact
with a Cold Chill . . . . . . . . . . . . 78
10 Calculated Cooling Curves for 1.0 N potassium chloride Solution at Different Distances from a Surface at
-70* C, in contact with the Solution . . . . . . . .
79
11 Fraction Solidified from 1.0 N potassium chlorideSolution Versus Time at Different Distances from a
Surface at -70 0C in Contact with the Solution . . . . 80
12 Freezing Rates of 1.0 N potassium chloride Solution Versus Fraction Solid at Different Distances from
a Surface at -70' C in Contact with the Solution . i
13 Distance of Eutectic Temperature T = TE Isotherm From The Chill Surface at -70* C as a Function of Time, for 1.0 N potassium chloride Solution. Movement of isotherm observed as the limit of all
ix
Figure Page
Number Title Number
14 Schematic Representation of the Set Up for Freezing Droplets of Aqueous Solutions in Low
Magnetic Fields . . . . . . . . . . . . . . . . . . 83
15 Diagram Showing the Arrangement for Freezing Droplets of Aqueous Solutions in High Magnetic
Fields . . . . . . . . . . . . . . . . . . . . . . 83 16 Diagram Showing the Assembly for Growing
Unidirectional Ingots from Aqueous Solutions with High Magnetic Fields Parallel to the Growth
Direction . . . . . . . . . . . . . . . . . . . . 84
17 Same as Figure 16 Except for Field being
Perpendicular to the Growth Direction . . . . . . 84 18 Unidirectional Freezing of Two Ingots One of Which
is Under the Influence of an Oscillating Magnetic
Field . . . . . . . . . . . . 85
19 Liquid Solid Interface During Unidirectional
Freezing, Perpendicular to the Growth Direction . 85
20 Typical Dendritic Aggregate of Ice and Brine Obtained on Fairly Rapid Freezing of Aqueous
Figure Number
Page. Number Title
21 Characteristic Parameters of a Ice-Brine Aggregate
After Dendritic Solidification . . . . . . . . . . . . 87
22 Randomly Arranged Ice Crystals Produced Under Very Slow Growth Rates. Ingot from 1.0 N potassium chloride Solution 1.0 cm from the Chill Surface at -20* C. . . 88 23 A large Segregate of Salt Between Neighboring Groups
of Dendrites . . . . . . . . . . . . . . . . . . . . . 88 24 Transverse Section of Unidirectional Ingot from 1.0 N
potassium chloride Solution 0.90 cm from the Chill
Surface at -70* C, X26 . . . . . . . . . 89
25 Same Ingot as in Figure 24, 1.3 cm from the Chilled
Surface, X26 . . .. . . . .. .. . *. .. .. . . 89
26 Same Ingot as in Figure 24, 3.0 cm from the Chilled
Surface, X26
. . . .
27 Same Ingot as in Figure 24, 3.2 cm from the Chilled Surface, X26 . . . . . . . . . . . . . . . . . . . .
. 90
. 90
28 Transverse Section of an Ingot from 1.0 N potassium chloride Solution 0.80 cm from the chill Surface, at
-200 C, X26 . . . . ... 91
xi.
Figure Page
Number Title Number
29 Same Ingot as in Figure 28, 1.1 cm from the Chill, but with Chill Temperature Reduced to -70* C during
Growth, Causing Faster Freezing . . . . 91
30 Variation of Dendrite Spacing with Distance from the Chill and the Effect of Concentration on Dendrite
Spacing in Ingots from potassium chloride Solutions 92
31 Plot of Dendrite Spacings in 1.0 N potassium chloride Ingot Versus the Reciprocal of the Square Root of the Maximum Freezing Rates at Different Distances from the
Chill Surface at -70* C ... . ...
93
32 Dendrite Spacing and Thickness of Salt Pockets Versus Concentration in Sodium Chloride Solution. Droplets, Freezing Rate 0.36 minutes-1. Also the Effect of
Superimposed Magnetic Field on Spacing .. . . . . . 94
33
Effect of Concentration on Dendrite Spacing in Ingotsfrom Sodium Chloride Solutions . . . . . . . .. . . 95
34
Effect of Concentration on Dendrite Spacing in Ingots from Lithium Chloride Solutions . . . . . . . . . . 96Figure Page
Number Title Number
35
0.2 N sodium chloride Solution Droplet, Freezing Rate 0.36 minutes~, X26 . . . . . . . ..97
36
1.5 N sodium chloride Solution Droplet, Freezing-l
97
Rate 0.36 minutes , X26 . . . . . . . . . . . . .
37
3.0 N sodium chloride Solution Droplet, Freezing Rate 0.36 minutes 1 X26 . . . . . . . . . . . .38
3.0 N sodium chloride Solution Droplet, Freezing-l 9
Rate 0.72 minutes , X26 . . . . . . . . .
39
Liquidus Curves of Water with Sodium Chloride, potassium chloride, Hydrogen chloride and Lithiumchloride as Solutes. . . . . . . . . . . . . . . . 99
40 Effect of Solute Diffusivity on Dendrite Spacing 100
41 Effects of Small Solute Additions on Dendrite Spacings Obtained with 0.2 N sodium chloride
Solution . . . . . . . 101
42 Effects of Large Solute Additions on Dendrite Spacings Obtained with 0.1 N sodium chloride
xiii.
Figure Page
Number Title Number
43
Effect of Large Solute Additions on Dendrite Spacings Obtained with 0.1 N Lithium Chlorideand 0.1 N potassium chloride Solutions . . . . ..103
44
Ingot from 0.1 N Sodium Chloride Solution, 2.5 cmfrom the chill surface at -700 C, X25 . . . . . . 104
45 Ingot from 0.1 N Sodium Chloride + 0.10 N Lithium Chloride Solution, 2.5 cm from the Chill Surface
at -700 C, X25 . . . . 104
46 Ingot from 0.1 N Lithium Chloride Solution, 2.5 cm
from the chill Surface at -70* C, X25 . . . 104
47
Effect of Total Solute Concentration on Dendrite Spacings with Solutions Containing EqualProportions of Sodium Chloride and Potassium
Chloride . . . . 105
48
0.5 N Sodium Chloride Solution Droplet, FreezingRate 0.36 min 1 , X75. No Field . . . . . . . 106
49
0.5 N Sodium Chloride Solution Droplet, Freezing -lRate 0.36 min , X75. Frozen Under the Influence
Figure Page
Number Title Number
50
1.0 N Sodium Chloride Solution Droplet, Freezing Rate 0.36 min~1, X25. No Field. . . . 107
51 1.0 N Sodium Chloride Solution Droplet, Freezing
Rate 0.36 min-1 , X25. Frozen Under the Influence
xv.
ACKl\OWLEDGEMENTS
The author is extremely grateful to Professor C. M. Adams, Jr. for his technical guidance and encouragement during the course of this work. He is also indebted to the other staff members of the Ice Research
Laboratory and the Welding Laboratory of M. I. T. for their assistance during the experimental phases of the program, especially to K.
Pulkonik, G. Eldis, B. Jain and E. Brush, Jr.
The author also wishes to epress his sincere thanks to Drs. W. A. Tiller, W. G. Pfann, C. Wagner, E. R. Gilliland, D. Turnbull, B. Chalmers and others with whom he discussed the solidification of aqueous solutions. The financial supports of the Office of Saline Water and the Air Force Cambridge Laboratories, and the loan of the
facilities by the National Magnet Laboratories Cambridge are deeply appreciated by the author. He is also thankful to Mrs. Katrina Avery and Mrs. Natalie White for their help with the typing of this work.
The principal objective of this work is to promote the fundamental understanding of the mechanism of solidification of aqueous solutions, especially with regard to the phase distribution in the frozen mass. Aqueous solutions offer the advantage of being transparent; in addition their study is of special significance, since the freezing process is receiving increasing attention among the methods of separating fresh water from saline water. In general during the freezing of solutions, the phase change is accompanied by an impurity redistribution due to the different capacities of the solid and the liquid to accommodate the solute. In aqueous solutions the impurity is more or less completely rejected into the liquid phase, since with very few exceptions there is virtually no solid solubility of ionic salts in the crystallizing ice. For this reason the resulting solid consists of an aggregate of salt and pure ice. The phase morphology governs the efficiency of the freezing process of desalination as well as the strength of the
aggregate. The latter is of importance in the polar operations where frozen sea water is used as a construction material.
Water molecules possess a dipole moment, and are almost tetra-hedrally arranged in the case of pure water. There is no definite agreement, however, on the details as to whether the structure is
1,2,3
4
quartz - like, tidymite-like or closer to methane hydrate Nevertheless it is agreed that water has considerable structural
2.
regularity and that the formation of ice may be considered merely as a process of increase in order. This statement can be extended to aqueous solutions, although it is known that ionic impurities increase
5
order in their immediate vicinity but decrease the long-range order of water molecules.
Cooling the solution down to its freezing point is accompanied by a change in its structure. This is manifested in the case of pure
water by a maximum in the density at +40C. At this point there is a balance between the decrease of intermolecular distances with
decreasing temperature and the simultaneous tendency for the structure to open up and get closer to that of ice. This temperature of maximum density depends upon the composition of liquid, and at higher
concentrations it can be suppressed below the liquidus temperature. This further indicates that aqueous solutions have structural
regularity which is of considerable importance in the formation of ice.
On further cooling below the liquidus temperature ice crystals start to precipitate from the solution. Usually the liquid undergoes a certain amount of supercooling before the first crystal of ice nucleates. This supercooling is referred to as the bulk supercooling and its magnitude depends upon the freezing variables. There is not enough quantitative information available on the molecular mechanics of the nucleation process to make possible a theoretical computation
of supercooling as a function of the composition and the structure of liquid. The experimental measurements are difficult to reproduce because of their extreme sensitivity to the presence of heterogeneous impurities. Pure water has been found to sustain a maximum
super-6
cooling of 70*F.
Once the nucleous of ice has formed it grows further by the addition of individual water molecules from the liquid, since it is rather unlikely that the water molecules are added to the solid in preoriented groups. In spite of the short range order in the liquid and the complex structure of ice, a molecule in water needs very
little activation energy to join the solid phase. Under normal freezing conditions, interface kinetics are not the rate-controlling step
and the deviation of only a few microdegrees7 from equilibrium provides enough activation energy for growth. Usually the removal of the latent heat of fusion is the rate controlling step. In a system where the heat of fusion is to be removed through the solid the rate of ice formation is proportional to the rate of heat
extraction. However when the growing solid is surrounded by super-cooled liquid the rate of formation of solid depends upon the bulk supercooling . This is because of the tendency of the system to immediately form equilibrium amounts of two phases corresponding to the temperature.
4.
The growth of ice is accompanied by simultaneous rejection of solute in the liquid next to the solid-liquid interface. The resulting concentration gradient in the liquid causes simultaneous diffusion of the solute away from the interface into the bulk liquid. Except at extremely slow growth rates the rate of diffusion of solute is slow compared to the rate of rejection, and a solute rich layer is produced next to the interface with a concentration profile as shown in Figure 1. Figure 2 shows the corresponding profile of equilibrium liquidus temperature ahead of the interface; the same figure also shows the actual temperature prevalent in the liquid. Equilibrium has been assumed at the interface in view of the fast interface kinetics 7
'9.
Mass transport events take place on such a local scale that the
temperature gradients over these distances can be neglected. Figure
3
is therefore more representative of the actual conditions in the liquid. This is an immediate consequence of the fact that the thermal diffu-sivities are much higher compared to the mass diffudiffu-sivities.It can be seen from Figures 2 and
3
that the liquid next to the interface is supercooled since it is below its equilibrium liquidus temperature. This liquid can achieve equilibrium either by theformation and growth of fresh nuclei or by the formation of solid
protrusions on the already existing surface extending into the unstable liquid. The latter is more favorable in terms of surface area;
protrusion mechanism can operate. It is on account of this barrier that the liquid ahead of an equilibrium interface can be supercooled to a
finite extent. This supercooling, usually referred to as constitutional supercooling is distinctly different from bulk supercooling, which
represents the barrier to the formation of new solid nuclei from the liquid.
A theoretical computation of constitutional supercooling presents
difficulties in connection with the surface energy and the critical protrusion size, as in the case of homogeneous nucleation. Its
evaluation is further complicated by the fact that the volume free energy driving force differs from point to point in the system. There have been few direct measurements1O,1 1 of constitutional supercooling with almost pure metal systems. The magnitude of supercooling has been
reported to be very small, which makes the direct experimental measurements very difficult and unreliable. Brownl2, French3 and Rohatgil4 have indirectly calculated the supercooling from the final
structures and have found it to be less than a tenth of a degree centigrade for several metallic and aqueous systems.
The fact that liquid can sustain only very small amouits of constitutional supercooling implies that only certain maxima of concentration gradients are permissible in the liquid ahead of an interface (Figure
3).
The gradients depend upon the rate of rejection of solute at the interface and its removal from the interface by6.
constant5 for a particular liquid, a plane interface can continue to be stable only if it moves below a certain maximum rate.
The rate of heat extraction governs the overall rate of formation of the solid from the liquid. For a given interface area, the faster the rate of heat extraction, the faster the interface would move. Above a certain rate of heat extraction, the concentration gradients in the liquid will exceed the maximum permissible value, and the plane interface will break down. After the breakdown the interface assumes a new morphology with increased surface area. The increase in surface area is sufficient to prevent the supercooling in the liquid from exceeding the maximum it can sustain. This comes about because with increased surface area, for the same amount of total solid formed, a smaller amount of solute will have to be rejected per unit area of the interface. The character of the protrusions of the interface will therefore depend upon the extent of solute build up. A considerable amount of work has been done analyzing the interface breakdown problem in metallic systemsl1,1 5. Most of the work has been directed towards analyzing the development of the instability before the breakdown and trying to correlate it with the final dendritic structure. Here an
attempt will be made to analyze the conditions after the breakdown of interface and correlate them to the final structure.
The protrusions ahead of a planar front are generally referred to as dendrites. Their shape is found to be different in different freezing systems. In aqueous solutions these protrusions are
plate-shaped and arranged parallel to each other in distinct groups. Once these platelets are formed ahead of a plane interface their subsequent growth takes place by their extension into the bulk liquid and their
simultaneous increase in thickness to consume to interdendritic liquid. Diffusion at the sides of the platelets is much more difficult than at their tips, since the sides have to reject the solute in very small closed interdendritic puddles4 on the other hand, the tips have large volume
of liquid lead of them. Once again, the criterion of constitutional supercooling governs the stability of the surfaces of plates growing into the interdendritic liquid. The theory presented here is based on the assumption that the dendritic breakdown of the interface is such that the interdendritic liquid is not subjected to more supercooling than it can sustain.
Brown1 2 and French1 3 have developed relationships for dendrite
spacing using a similar approach and have experimentally tested them for metallic systems and for aqueous solutions respectively. According to them, the dendrite spacing increases with the diffusivity of the solute, the capacity of the liquid to sustain supercooling and the freezing time; it decreases with the solute concentration and the slope of the liquidus curve. Their theories analyze a case where the freez-ing rate remains constant throughout the entire solidification process, and they assume that the interdendritic puddle is subjected to maximum under-cooling in the very initial stage of dendritic growth. In the
current work a more general case is discussed where the freezing rate changes during solidification.
Most of the experimental work done on the freezing of aqueous systems has been either with pure water or with very dilute solutions. Also a considerable portion of the effort has been directed towards the
study of nucleation of icel6. Harrison and Tillerl7 'l have studied the crystallographic aspects of cell formation during growth of ice
from water and dilute aqueous solutions. Knight 1 9 has discussed the curvature of growing ice crystals and the effects of the addition of
20
small amounts of impurities. Himes et al. describe a process for zone refining of sea water to freeze out pure ice under slow growth conditions. French13 has measured dendrite spacings in dilute aqueous solutions as a function of freezing rates and the diffusivity of solutes.
The present study has been conducted on aqueous solutions embracing a very wide range of concentrations. The system variables examined include the nature of solute, its concentration and the presence of several solutes. Two different types of freezing systems were used: in one of them the entire liquid becomes supercooled before freezing starts, in the other, progressive solidification takes place from a chill. The effects of changing freezing rates have been examined in the latter system.
In addition, the effects of external magnetic and electric fields on the dendritic pattern of ice have been studied. Magnetic21-23 and electric fields 24-27have been reported to affect the solidification phenomena in a variety of freezing mediums. The approach so far has been mainly experimental without many theoretical correlations. The majority of these observations have been on supersaturated solutions
with slow growth rates. In the present study, fairly high growth rates have been used and various possible types of field have been explored. The possible interactions of external fields with dendritic growth are analyzed in the next section in connection with the specific properties of aqueous solutions and ice.
10.
II. THEDRY
(1) Mass Transport:
In the freezing of aqueous solutions, the plane interface breaks down into parallel plates of ice to maintain the solute concentration gradient at the interface below a certain maximum. Further growth takes place by the extension of these plates and their simultaneous increase in thickness to consume the interdendritic liquid. An analysis of mass transport events in the interdendritic liquid between two
growing plates is presented here. The understanding of solute distri-bution in this zone is important, since it governs the stability of the plate surfaces. Most analyses on the redistribution28-3 2 of a solute have been for a case when the solute is being rejected into a large volume of liquid ahead of a plane interface. In the present situation the solute is being manufactured on both sides of a finite channel of liquid; in addition, the sides are simultaneously moving to the center of the channel.
Figure
4
represents two adjacent plates of ice growing into the interdendritic liquid. The solute rejected at the two interfaces(1xl = 1) moves toward the center of the puddle (x = 0) giving rise to a concentration gradient in the liquid. The concentration difference
( AC), between the center (C = Co) and the extremes (C = C ) of the puddle gives rise to the constitutional supercooling (AT) of the
liquid (Figure
5).
Temperature gradients in the liquid have been assumed to be negligible since the distances considered are of the order of few microns. The concentration profiles, and therefore the constitutional supercooling in the interdendritic liquid, changes as solidification progresses (Figure 6). With a fixed coordinate system (Figure4),
the change in solute concentration on the liquid will be governed by the Ficks Second Law:ac
D32C
39 ~ ) 2
(1)
It is extremely difficult to obtain a rigorous solution of this partial differential equation for the present case because of the lack of knowledge of the transient boundary conditions, However, the absence of side branches, except at very high concentrations, suggests that all through the growth cycle the supercooling in the interdendritic liquid never exceeds the maximum permissible value. This implies that the concentration gradients in the liquid remain very small, because all the evidence up to now indicates that the permissible constitutional supercooling is of the order of one tenthl2,13,14 of a degree centigrade. The concentration differential (AC) therefore appears always to remain under a very small fraction of a mole per cubic centimeter. Since this is very small compared to the increase in the average concentration*
* 1. Ca represents the average solute concentration in the puddle, since LC is very small Ca==C ':: CO
2. Ca is almost equal to the initial liquid concentration C at the start of freezing; it rises to the eutectic composition or higher during growth.
of the liquid points in the This boundary
(Figure 6), the increase in concentration at different liquid can be considered independent of its location.
condition can be expressed as:
~I(x)
(2)
According the following
to this condition, Equation (1) can be simplified to form:
dC d2C
dx
(3)
Integrating (3) with respect to x gives:
D-d ( d (dx)
or
D -x + C
1
(4)
The integration constant, C1 is equal to zero, since the concentration gradient ( ) is always zero at the center of the
puddle. Therefore the relationship between the concentration gradient and the rate of change of concentration with time may be expressed as:
(5)
Equation (5) can be integrated to evaluate the difference in
concentration between the center and the edges of the puddle as follows:
f
xdx =f
dCo Co
d.C C
Oy dC t,2
cf - ,- = D (C - CO) = D .A C
The average solute concentration in the interdendritic liquid Ca will increase as the amount of liquid in the puddle decreases in accordance with the relationship:
1 l-K (\)1K = f Ce
(7)
whereCi = starting composition of liquid K = distribution coefficient
ft = fraction liquid
Differentiation of Equation (7) gives the rate of change of concentration in terms of freezing rates:
dCa - K-2 ffj
14.
The width of the interdendritic puddle, 2L, is related to the fraction solidified, fs, in the following way:
21
f = = 1 - f
L s
(9)
Substituting the values of - and )L, from Equations (8) and (9) into Equation (6) and further rearranging of the terms gives the concentration difference jLC as:AC L2
K
LSD (K-() ,dft
)
(10)
Making use of the relation m = AT the dendrite spacing can be written in terms of constitutional supercooling:
L 2 8 -C
A T - D
m C-(l-K) -( )K. dfA
\d9 /)
TM-T L In aqueous solutions where K~0 and also C = mthis relationship may be simplified to the following form:
2 L = 8 -A T- D (T M-T L) ' s d.9 (11) (12)
This equation implies that for a fixed value of supercooling the square root of the dendrite spacing is directly proportional to the solute diffusivity and inversely proportional to the initial concentra-tion of the liquid and the freezing rate. However, this equaconcentra-tion can
be interpreted in a different way, that is for a fixed value of dendrite spacing, the supercooling increases directly with the initial solute concentration and the freezing rate, and inversely with the solute diffusivity.
A relation between the cooling rate and the freezing rate is
obtained from the equilibrium relationship.
T -T TM L
s T M -TM
(13)
Equation (13) on differentiation gives:
df (TM - TL dT
I
(TM -T)
(14)
The dendrite spacing can be written in terms of the cooling rate as follows:
2
2 8-AT -D- (TM -T)
(
T (TM T 216.
(2) Unidirectional freezing of a solution from a constant temperature chill:
Unidrectional growth from a constant temperature chill has been used as a means to obtain varying freezing rates, and also to detect the effects of other solidification variables. The solution at its liquidus temperature is brought in contact with a flat bounding surface of a relatively large mass of copperi' which is kept cool by freezing mixtures. This immediately sets up temperature gradients in the liquid (Figure 9), accompanied by the formation of a layer of solid next to the chill; the layer of solid grows larger with time in accordance with the temperature pattern. Growth patterns in pure metals under such conditions have been analyzed by several workers3 3 . In
solutions the situation is complicated by the fact that the latent heat of fusion is evolved over a range of temperatures, which gives rise to a solid plus liquid region under temperature gradients (Figure
7).
In order to understand the solidification events in detail, a complete knowledge of thermal conditions of the system is necessary.The temperature distribution in the system will be according to Fourier's Law of heat conduction:
2
(16)
* Calculations in Appendix III show that under such conditions the chill surface remains practically at the same temperature.
The particular solution to this equation for freezing of a pure com-ponent is generally of the error function type. In the present case, where freezing takes place over a range of temperatures, an attempt will be made to describe the temperature distribution by a combination of several error function equations. In view of the growth conditions, (Figures 8 and 9) it appears that the actual temperature distribution can be reasonably well approximated by a combination of two error function equations describing the conditions in different temperature regions. This in effect implies that for heat transfer analysis the entire material ahead of the chill is approximated by a combination of two zones of constant specific heats. Since the freezing events at the start of solidification are most important, the specific heat of one of the zones will be taken as equal to the effective specific heat of the solution jtst below the liquidus temperature. Figure 8
shows the exact form of the approximation; the material above the temperature T5 is referred to as Zane II and that below T is Zbne I.
The error function equations describing the temperature profiles in each zone (Figure 9) are of the following form:
T -Ti A erf *... Zone I..
2f
(17)
T -T = B erfc *0O* .Zone II.
18.
where o4 and o( are the thermal diffusivities in the two zones.
The evaluation of the constants Ts, Cp"1, A, Bco( and c/( is illustrated in Appendix II for the particular case of 1 N potassium chloride solution. The results from both zones are combined to give the complete cooling curves at different distances from the chill surface (Figure 10). These temperature distributions can be transformed into a description of
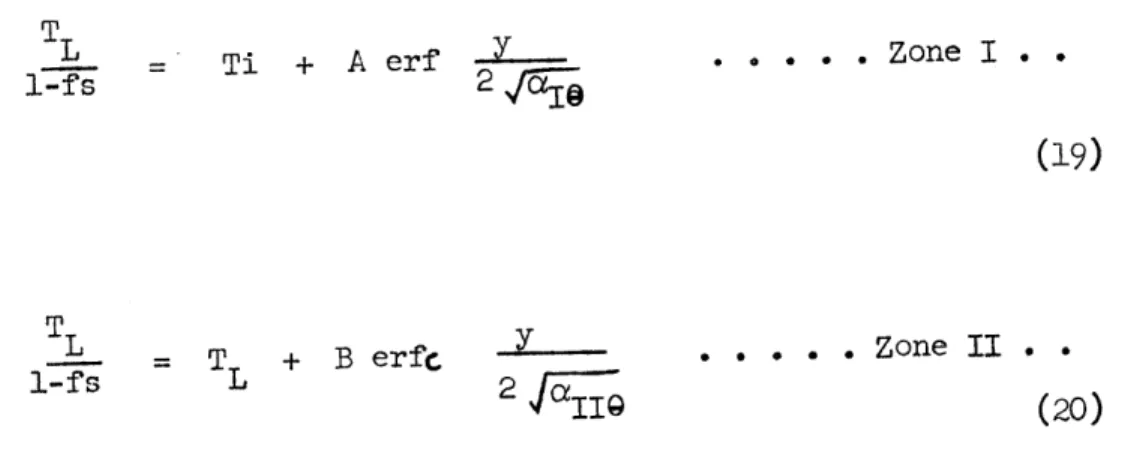
freezing events by making use of the equilibrium relationship (Equation 13). The results are following:
L - Ti + A erf -.- - Zone I..
1-fs 2,f5~~a
(19)
TL T + B erfc - . Zone II.
l-fs L 2
alI9 (20)
Figure 11 shows the progress of freezing at different distances from the chill for 1.0 N potassium chloride solution. Freezing rates at different distances from the chill, obtained by differentiation of Equations (19) and (20) are of the following form:
2
dfs I A y (1-fs)2 2 ( 2* jQ)2
9 y 2 TL
df B( - f ) -e
s 2 . e 2 a9
y 2 T 93/2 PIT~
L aI
(22) These freezing rates are complex functions of 9 and f . A numerical
S
computation for 1.0 N potassium chloride solution (Figure 12) shows that the freezing rate at a fixed distance from the chill starts out at a low value, goes through a maximum and then falls off during the freezing cycle. Equating the second derivative of fs to zero shows that at all distances from the chill, the freezing rate goes through a maximum at a
M
fixed stage of solidification when fs = s . This also implies
(Equation 20), that the time 9 at which a particular level experiences the maximum freezing rate is proportional to the square of its distance from the chill:
= C (23)
JaM 2
where C2 is constant.
By substituting f = f M and 9 9 on the right hand side of
s s
Equation (22), one obtains the value of the maximum freezing rate at any level as:
M2
df M4 B 1 y 2
-- sB 1 y M . 2 - e 2 G
d9 y 2 TL II 6M s
Jii~
eI20.
Collecting all the constants in the Equation (24) into a single constant, C , one gets:
dfs M
C3
dQ9y ~ M
(25)
A combination of Equations (23) and (25) gives the maximum freezing rate as a function of distance from the chill:
2
dfs M C C2
y )
(26)
The results of this analysis can be sunmarized in the following sentences:
(1) When an aqueous solution at its liquidus temperature is presented to a constant-temperature chill surface, the liquid at each level is subjected to a spectrum of freezing rates.
(2) The freezing rate at each level starts out at low values, goes through a maximum and then falls off, during the freezing cycle.
(3) The spectrum of freezing rates is different at different levels, and the maximum freezing rate at each level is inversely proportional to the square of its distance from the chill.
(4) The total freezing time at any particular level increases with its distance from the chill.
(3) Diffusion in Single and Mixed Electrolyte Solutions:
5
In the diffusion of single electrolytes the two component ions move in the same direction, down the chemical potential gradient. In addition, the anions and cations are obliged to move in pairs to conserve overall electrical neutrality. The resultant electrolytic mobility is therefore a compromise between the mobilities of the
component ions. However on a microscopic scale these different mobilities create short-range electric fields in the electrolyte
which supplement the chemical potential gradient and therefore affect the diffusion. Table VI presents diffusion data on some electrolyte solutions.
Diffusion in mixed electrolytes5 is complicated because there are several ways of satisfying the requirement of electrical neutrality. In addition, there is a mutual interaction between different
electrolytes affecting both the chemical and electrical potential gradients of any individual electrolyte. The interactions depend upon the nature and the concentrations of the constituent electrolytes. Gosting3 4,3 5and his associates have measured the direct and cross diffusion coefficients for several ternary combinations from the
family NaCl-KCl-LiCl-H 0. The fluxes of individual electrolytes are 2
given in terms of the concentration gradients of both electrolytes:
J,= -
(
3C -D 2 (27)WMW__"_a
22.
D C 1)3C2(8
2 21 bX 22 3X
where J1 , J2 are the fluxes of two electrolytes and
-are their concentration gradients, D and D22 are the main diffusion coefficients, D12 and D21 are the cross diffusion coefficients. Table VI presents the measured values of these coefficients for some electro-lyte solutions.
Fluxes of irdividual electrolytes can be calculated by substituting the values of measured diffusion coefficients and picking suitable
values for the gradients. It turns out that during simultaneous diffusion the fluxes of different electrolytes remain different because their
mutual interactions are relatively small. This is reflected by the low values of the cross diffusion coefficients. For most combinations in
question the flux of a fast-moving electrolyte is further increased or remains constant on addition of a slowly moving electrolyte. Similarly a slowly moving electrolyte is usually further decelerated or remains unaffected on addition of a fast moving electrolyte. A solute like potassium chloride does not affect the movement of other electrolytes
appreciably, because its anions and cations move at almost the same speed.
The diffusion in electrolyte mixtures can be treated in terms of the movements of individual ions. Previous studies36,37 show that a
fast-moving ion like H+ is further accelerated in the presence of dher slowly moving cations. Gosting3 4 has presented relationships for the diffusivities of individual ions in a binary electrolyte mixture with
where
F = Force on a charge of q columbs moving with a velocity
V-E = Electric Field, intensity vector B = Magnetic Induction
V = Velocity of a particle relative to the magnetic field. This force can affect short-range movement of ions as well as their mass flow. Directional magnetic and electric fields change the course of Brownian jumps of ions and, at the same time, restrict the random jumps to certain preferred planes. Another mechanism by which the mobility of ions can be influenced is through the interaction of external fields with the electric fields generated
23.
common anion. He points out that in a ternary mixture of type NaCl-KCl-H 0 the same diffusivity values describe the motion of
2
individual cations (K+ and Na+) as well as that of entire electrolyte molecules (KCl and NaCl).
(4) The Effect of Fields on the Freezing of Aqueous Solutions:
An external electric or magnetic field can interact with the freezing aqueous solution in the following ways:
(a) The Effect of Fields on the Motion of Species in the Liquid:
The force exerted on a moving charged particle by magnetic and electric fields is given by Lenzs Law:
24.
in the freezing system. In any diffusional process involving an ionic aqueous solution, low-order electric fields are developed in the
liquid5. Moreover, surprisingly high potential differences are reported38 to exist at the ice-liquid interface during freezing. This indicates that external fields may change the character of the ice-liquid interface.
Considering the magnetic fields in particular, it appears that a stationary field can exert appreciable Lenzs force if the relative
39
velocity of the ion in question is sufficiently high. Gilliland has demonstrated this principle by bringing about partial separation of solutes from sea water streams flowing between the magnet poles. For
the same reasons an oscillating magnetic field appears to be more promising than stationary fields. However, a non-uniform stationary magnetic field
can create potential gradients in the liquid and cause ion migration perpendicular to the planes of constant field intensity. It therefore appears that a suitably applied magnetic field can affect the motion of ions in a solution. Kibardin40 confirms that in general particles in a electrolytic solution move perpendicular to the electrophoretic motion under the influence of a magnetic field.
Electric fields have been used to cause directional movement of impurity ions and thereby change the solute distribution pattern during the solidification of metals4l and semiconductors4 2. This particular technique of field freezing,41,43 is not directly applicable to individual
However, one can affect the diffusional characteristics of the electrolyte molecule as a whole. Ole Lam has dealt with the theoretical aspects of this problem and has shown that electro-diffusion phenomena can change the diffusivities of electrolytes by as much as 100%, depending upon the characteristics of the field.
A combination of electric and magnetic fields appears most potent
for moving ions in a aqueous solution. Rao45 has demonstrated the motion of particles by spraying powder on a electrolyte under the
influence of oscillating electric and magnetic fields.
(b) Effect of Field on the Structure of the Liquid
External electric and magnetic fields can influence the structure and short-range order in the liquid solution because of the
46
dipole characteristic of the water molecule. Piccardo attributes a change in the surface tension of water, in the presence of an external magnetic field, to a change in its structure. Mineko4 7 et.al. show that
a magnetic field changes the structure and physico chemical properties of water.
(c) Effects Due to Differences in Susceptibilities and Permeabilities of Ice and Aqueous Solutions:
Since the susceptibility of water is higher than that of ice, application of an external magnetic field would change
26.
the volume free energy50 of the liquid-solid transformation. This would change both the nucleation and the growth characteristics of the ice. Even though the suscep-.,ibility differences involved are small, a computation shows that the formation of ice will be favored in the presence of a magnetic field. In addition, the fact that ice is
magnetically anisotropic51 would cause a preference for certain crystalline orient ations2 2
Similar effects would be produced upon application of an electric field since the dielectric constant49,52 of ice is about 20% higher than that of water. When electrolytic solutes are present, this difference is further increased since they lower the permeability of water5.
(d) Conclusions:
It appears from the above discussion that both magnetic and electrical fields have the potential to alter the solidification pattern of aqueous solutions by changing both nucleation and growth
conditions. However, it is not possible to calculate quantitatively the magnitude of these individual effects and their interactions. The question of how these factors manifest themselves in the final
III. EXPERIMTAL PROCEDURES
1. Freezing Systems:
(a) Freezing of Droplets:- This technique consists of immersing small droplets of aqueous solution into a large quantity of a cold organic liquid (20% kerosene, 80% mineral oil). The organic medium is kept cool by either placing the entire setup in a cold chamber
or by means of cooling mixtures. The relative density and the viscosity of the organic liquid are such that the aqueous solution droplet sinks slowly through it. The droplet is therefore cooled by a constant temperature medium throughout its descent through a tube full of
organic liquid. The droplet remains perfectly spherical due to surface tension forces.
The size of the droplet and the ratio of its thermal diffusivity to that of medium are such that the temperature gradients within the droplet during freezing are negligible, and the rate of solidification is substantially uniform throughout the specimen. Droplet diameters are typically of the order of 0.2 - 0.3 inches. The principal
advantage of maintaining uniformity of freezing conditions is that the resulting dendrite spacings are uniform from the surface to the center of the droplet. The chief disadvantage of the droplet system,
especially when field effects are being studied, is that no satisfactory method could be evolved for indexing or maintaining the orientation of the droplet during freezing.
28.
13
The freezing time of the droplet is proportional to the square root of its diameter at any given initial temperature of the organic
coolant. Moreover the freezing rate remains practically the same from the beginning to the end of solidification. The frozen droplet at the end of its descent is scooped out and its diameter measured. It is then sectioned to a thin slice for microscopic examination.
(b) Unidirectional Ingot Freezing System:
The setup consists of a calibrated tygon tube mounted on a cylindrical copper chill. The chill is kept cool by means of freezing mixtures (dry-ice + acetone or ice + brine). Aqueous solutions,
pre-cooled to their liquidus temperature are poured into the tygon tube. A layer of solid immediately forms next to the chill and then grows
into the solution. Ahead of the solid zone there is a two-phase (solid + liquid) zone; the movement of the boundary between the two zones is easily observed through the tubing (Figure 13). After the specimen freezes to a desired height, it is removed from copper chill and the tygon mold is stripped out. Longitudinal and transverse sections are cut out at suitable places for micrographic examination.
It has been shown in a previous chapter that for such a system, the freezing rate varies from point to point in the specimen. Unless if otherwise stated most of the micrographs in the text represent transverse sections perpendicular to the growth direction. The chill temperature and the distance from the chill are the indexes of the
measurements as well as the indexing of orientation effects on the application of external fields.
2. Specimen Preparation and Micrography:
Specimens in the form of a thin slice are mounted on a transparent glass slide by freezing small amounts of water around its periphery. They are then polished on a series of emery papers; the final finishing
is done on a soft tissue paper. Exposure of polished surface to cold dry air for several hours etches the ice-brine boundaries and improves the contrast. A Leitz Bilogical microscope was used for structural
observations; photography was done by mounting a
35
mm Exacta camera on the eyepiece tube. Light transmission microscopy was found to be the most satisfactory technique for observing the dendritic structure,its only limitation being the need for thin specimens. Some of the early work was also done using back reflection technique which was simpler to implement but brought out much less structural detail.
The photomicrographs are enlarged to a convenient size, and dendrite spacing measurements are taken directly from the prints. Final
magnifications were determined by photographing millimeter grids. Specimen preparation and photography was done in cold chambers at
-40*C. Some attempts have been made to photograph the dendritic inter-face directly during growth, but the optics of this system could not be perfected. An example of such a photograph taken during the freezing of a unidirectional specimen is shown in Figure 19.
30.
3.
Application of External Fields:(a) Magnetic Fields:
(1) Low Static Fields:- Relatively weak magnetic fields were applied, using permanent magnets. Field strengths from 1 to
4.5
kilogauss were obtained; the field strength was changed by varying the pole gaps by the use of soft iron tabs. In the droplet freezing system, fieldswere applied by containing the liquid organic coolant in a cylindrical glass tube and moving the permanent magnet outside the tube in such a way that the droplet was always kept between the magnet poles (Figure 14). In the unidirectional system, the magnet was placed above the freezing bath so that the entire tygon mold was between the pole pieces.
(2) High Static Fields:- High magnetic fields ranging up to 50 kilogauss were generated in the core of a Bitter Solenoid at the National Magnet Laboratories in Cambridge. To make droplets under the influence of such a field, organic medium was cooled by an ice-brine mixture and the entire freezing assembly was placed in the core of the magnet (Figure 15). Similarly with the unidirectional system the entire freezing assembly had to be placed in the core. Styrofoam insulations were used to avoid any heat transfer from the magnet. Figures 16 and 17 show the arrangements used to apply fields parallel and perpendicular
respectively to the growth direction.
(3) Non-uniform Fields'- With small permanent magnets the field gradients are produced by sharply pointed pole pieces, but the region of
steep field gradients thus obtained is very small. Even with larger magnets, it is extremely difficult to expose larger sections of the freezing specimen to gradients. In the Bitter Solenoid this field drops off from the center of the core to its ends, giving rise to gradients up to
3
kilogauss per centimeter. A unidirectional freezingsystem is subjected to these gradients merely by shifting the assembly away from the center of the core.
(4) Oscillating Fields:- Periodic relative movement of the
specimen and the magnetic field was produced by mechanical and electrical techniques. Low-frequency oscillations were produced by mechanical
vibration of a permanent magnet, and a field oscillation of 60 cycles per second was obtained with an electromagnet producing fields up to 6 kilogauss. Oscillating fields were applied to the droplet freezing system by placing the electromagnet around the tube containing the organic medium and always maintaining the drop in the field. Figure
18 shows an arrangement for applying oscillating fields perpendicular to the growth direction in the unidirectional scheme. Oscillating
fields were applied parallel to the growth direction by placing the electro-magnet coil horizontally around the tygon mold.
(b) Electrical Fields:
Initial attempts to apply electrical fields involved placing electrodes in the freezing solution. This method was not very successful, because aqueous solutions undergo electrolysis at very low voltages.
32.
freezing system, the field permeating through the air gaps and other dielectrics. Even with such an arrangement only high frequency fields can be applied; otherwise, charge separation will generate an electric potential in the solution which will annihilate the applied field. The frequency should be higher than the critical value above which the
solution behaves as a dielectric. Fields were applied to droplet
freezing system, by placing long copper electrodes inthe organic medium and allowing the drop to descend between the electrodes. For the ingot system, shorter electrodes are placed just outside the tygon tubing. The electrodes in both cases are connected to a low - power, high
IV. RESULTS AND DISCUSSION
1. General Character of the Ice-Brine Aggregate Obtained on Freezing
Of Aqueous Solutions:
Under the freezing conditions used in the present work, the solute rejection accompanying the solidification of aqueous solutions causes the breakdown of the plane interface into plate-shaped projections.
Further solidification is accomplished by the length wise growth of these plates and their simultaneous increase in thickness. Due tofthis increase in thickness the liquid entrapped between the plates continues to be
enriched in the solute until it precipitates as a salto-rich phase, marking the end of the solidification process.
The final structure, therefore, consists of groups of parallel plates of ice with salt entrapped between these plates. The crystallo-graphic orientation of the plates within a group is the same, but the individual groups are randomly oriented with respect to each other. In Figure 20, a photograph of a section taken with polarized light, the parallel dendrites within a group show the same polarization color, but different groups show different colors. The dark region between the neighboring ice plates is the salt-rich phase. It appears that eutectic divorcement takes place under these growth conditions; that is, after the interdendritic liquid reached the eutectic composition, instead of the simultaneous appearance of two phases, only ice continued to separate on the already-present ice plates. This resulted in the
34.
precipitation of pure salt in the interdendritic regions, rather than the salt hydrate eutectic. This hypothesis is substantiated by the relatively small volume of the interdendritic phase.
The parameters characterizing a group of ice-brine layers are schematically represented in Figure 21. In transverse sections as in Figure 20, two dimensions of the plates namely their width, W, and thickness, F, can be observed. The dimension most uniform, and most
characteristic of the freezing conditions is the dendrite spacing, L, the distance between the centerlines of neighboring plates. The
dendrite spacing is also an approximate measure of plate thickness, F, since the thickness of salt pockets, P, is usually quite small. The area occupied by a particular group of dendrites in the entire aggregate, generally referred to as grain size, depends upon the plate width, W, the group width, B, and the height of the group, H. However with very slow growth rates the crystals of ice are no longer arranged in distinct groups, and the neighboring plates are randomly arranged with respect to each other (Figure 22).
The brine, in addition to being present in parallel interdendritic regions, is sometimes found in the form of large irregular segregates existing between neighboring groups of dendrites (Figure 23). Tille 6 has suggested that grain boundaries can act as sites for solute
segregation. However, in aqueous solutions, this macrosegregation is related to the fact that ice expands on freezing; the growing plates physically displace the brine from the interdendritic puddles into the grain boundary gooves. These segregates are more often found under slow