HAL Id: inserm-00598506
https://www.hal.inserm.fr/inserm-00598506
Submitted on 26 Jan 2012HAL is a multi-disciplinary open access archive for the deposit and dissemination of sci-entific research documents, whether they are pub-lished or not. The documents may come from teaching and research institutions in France or abroad, or from public or private research centers.
L’archive ouverte pluridisciplinaire HAL, est destinée au dépôt et à la diffusion de documents scientifiques de niveau recherche, publiés ou non, émanant des établissements d’enseignement et de recherche français ou étrangers, des laboratoires publics ou privés.
Predictive utility of the Framingham general
cardiovascular disease risk profile for cognitive function:
evidence from the Whitehall II study.
Sara Kaffashian, Aline Dugravot, Hermann Nabi, G David Batty, Eric
Brunner, Mika Kivimäki, Archana Singh-Manoux
To cite this version:
Sara Kaffashian, Aline Dugravot, Hermann Nabi, G David Batty, Eric Brunner, et al.. Predictive utility of the Framingham general cardiovascular disease risk profile for cognitive function: evidence from the Whitehall II study.. European Heart Journal, Oxford University Press (OUP): Policy B, 2011, 32 (18), pp.2326-32. �10.1093/eurheartj/ehr133�. �inserm-00598506�
Predictive Utility of the Framingham General Cardiovascular Disease Risk Profile for
Cognitive Function: Evidence from the Whitehall II Study
Sara Kaffashian, MSc * 1 Aline Dugravot, MSc 1 Hermann Nabi, PhD 1 G. David Batty, PhD 2,3 Eric Brunner, PhD 2 Mika Kivimäki, PhD 2 Archana Singh-Manoux, PhD 1,2,4
1. INSERM, U1018, Centre for Research in Epidemiology and Population Health, F-94807, France
2. Department of Epidemiology and Public Health, University College London, UK 3. Centre for Cognitive Ageing and Cognitive Epidemiology, University of Edinburgh, Edinburgh, UK
4. Centre de Gérontologie, Hôpital Ste Périne, AP-HP, France
* Corresponding Author: 1
INSERM, U1018, Centre for Research in Epidemiology and Population Health Hôpital Paul Brousse, Bât 15/16, 16 Avenue Paul Vaillant Couturier
94807 VILLEJUIF CEDEX, France
Telephone: +33 (0)1 77 74 74 06 Fax: +33 (0)1 77 74 74 03
Introduction
The importance of vascular risk factors and disease for cognitive impairment and dementia in older adults is widely recognized (1-3). There is growing evidence to suggest that these risk factors are also associated with deficits in cognitive function in mid-life, prior to the onset of overt clinical symptoms of dementia (4-9). Several risk algorithms have been developed to predict the risk of stroke and cardiovascular events (10-12). Such scores improve the efficiency of risk prediction and provide a more realistic assessment of the collective importance of risk factors as well as easier interpretation of the risk of disease. They may equally help to identify persons at increased risk of disease resulting from risk below the clinical threshold on individual risk factors.
The association between multiple vascular risk factors and cognition has been examined by a number of studies using the Framingham Stroke Risk Profile (FSRP) (13-16). These studies have reported an inverse association between the 10-year risk for stroke and performance on multiple cognitive tests. The majority of these studies have used a cross-sectional design, which provides little information about risk prediction. (14-16). In addition, the FSRP is designed for prediction of stroke and therefore does not cover the full range of potentially relevant
cardiovascular diseases, such as myocardial infarction, coronary insufficiency, angina, and peripheral artery disease. We used the recently developed Framingham General Cardiovascular Disease Risk Profile to examine associations with cognitive performance and then decline over a ten year period in a large sample of middle aged individuals.
Methods
Data were drawn from the Whitehall II study, established in 1985 to examine the socioeconomic gradient in health and disease among 10,308 civil servants (6,895 men and
3,413 women). Details of the cohort have been described previously (17). Briefly, all London based office staff aged 35-55 working in 20 civil service departments were invited to participate, of which 73% agreed. Baseline examination took place during 1985-1988 and consisted of a clinical examination and a self administered questionnaire that included sections on demographic characteristics, medical history and health behaviors. Clinical examination included measures of blood pressure, anthropometry, biochemical variables, subclinical makers of cardiovascular disease, and neuroendocrine function. A battery of cognitive tests was introduced to the study at Phase 5 (1997-1999), and repeated at phases 7 (2002-2004), and 9 (2007-2009). Informed consent was obtained from all participants and the University College London ethics committee approved the study.
Assessment of risk factors for the CVD Risk Profile
The Framingham general CVD risk score is designed for use in primary care to identify individuals at high risk for CVD events that include coronary, cerebrovascular and peripheral arterial disease, and heart failure (11). Its development was based on the prediction of 1,174 CVD events over a 12-years follow-up period of 8,491 participants in the Framingham Heart study. The risk score, calculated using information on age, HDL cholesterol, total cholesterol, systolic blood pressure, cigarette smoking, and diabetes provides an estimate of the risk of CVD over a 10-year period.
The risk score components in our study were drawn from questionnaire and clinical examination data at phase 5. HDL and total cholesterol (mg/dL) were measured from blood samples collected after either an 8-hour fast for participants presenting in the morning, or at least 4 hours after a light fat-free breakfast for those presenting in the afternoon. Cholesterol was measured using a Cobas Fara centrifugal analyzer (Roche Diagnostics System). HDL cholesterol was measured by precipitating non-HDL cholesterol with dextran sulfate-magnesium chloride
with the use of a centrifuge and measuring cholesterol in the supernatant fluid. Systolic blood pressure (mm Hg) was taken as the average of two measurements in the sitting position after a 5 minute rest with the Hawksley random-zero sphygmomanometer. Treated hypertension was determined according to antihypertensive medication use. This included diuretics, beta blockers, ACE inhibitors and calcium channel blockers. Participants were categorized with respect to their cigarette smoking status as current smokers or past/non smokers. Diabetes was defined by a fasting glucose ≥7.0 mmol/L or a 2-hour postload glucose ≥11.1 mmol/L or reported doctor diagnosed diabetes, or use of diabetes medication (18).
Raw scores were calculated and then converted to 10-year risk or predicted probability of incident CVD expressed as a percentage (11). Missing data for any risk score component were replaced by data from phase 4 (1995-1996), N=27, and in the case of biological measures (HDL cholesterol, total cholesterol, and systolic blood pressure), by data from phase 3 (1991-1993), N=624. Individuals (N=319) with a history of stroke or coronary heart disease (CHD) at phase 5 were excluded. CHD status at phase 5 was defined as nonfatal myocardial infarction (MI) and „definite‟ angina. MI diagnosis, based on clinical examinations at Phases 1, 3 or 5 and records obtained from general practitioners and hospitals, was assessed using MONICA criteria (19). Angina was assessed based on participant‟sreports of symptoms with corroboration in medical records orabnormalities on a resting electrocardiogram, an exercise electrocardiogram,or a coronary angiogram. Stroke diagnosis was self-reported and included history of stroke or a transient ischemic attack (TIA).
Cognitive function
The cognitive test battery, administered at the clinical examinations at Phases 5, 7 and 9, described below, consists of five standard tasks chosen to provide a comprehensive assessment of cognitive function.
The Alice Heim 4-I (AH4-I) is composed of a series of 65 verbal and mathematical
reasoning items of increasing difficulty (20). It tests inductive reasoning, measuring the ability to identify patterns and infer principles and rules. The time allowed for this test was 10 minutes.
Short-term verbal memory was assessed with a 20-word free recall test. Participants were presented a list of 20 one or two syllable words at two second intervals and were then asked to recall in writing as many of the words in any order and had two minutes to do so.
We used two measures of verbal fluency: phonemic and semantic. Phonemic fluency was assessed via “S” words and semantic fluency via “animal” words (21). Subjects were asked to recall in writing as many words beginning with “S” and as many animal names as they could. One minute was allowed for each test.
Vocabulary was assessed using the Mill Hill Vocabulary test, used in its multiple-choice format, consisting of a list of 33 stimulus words ordered by increasing difficulty and six response choices. (22)
Covariates
The following covariates were included; age, marital status, ethnicity, and education. Although age is a component of the Framingham General CVD risk score, we included it as a covariate because of its established association with cognitive function (23). Ethnicity consisted of two groups; white and non-white. Marital status included two categories; married/cohabiting and single/divorced/widowed. Education was measured as the highest level of education achieved. Categories included (1) elementary or lower secondary, (2) higher secondary (A‟ levels), and (3) first university degree or higher. We also examined the effect of occupational position at baseline in lieu of education. This variable consisted of three categories: (1) high (administrative), (2) intermediate (professional or executive), and (3) low (clerical or support).
Statistical methods
Descriptive analyses were carried out to examine the distribution of the CVD risk score components, all covariates, as well as cognitive function and decline in our study population. In order to carry out cross sectional and longitudinal analyses on the same population, we started with those who had data at Phase 5 and at least one repeat measure so that cognitive decline could be calculated (implying participation in phase 7 or 9 of the study). Approximately 86% of the 4,837 participants included in the study had cognitive data at all three phases of this study. As follow-up time varied between individuals (mean=10.5, SD =0.5) we first estimated the rate of change, standardizing it to represent 10-year change for each individual. The interaction term between the risk score and sex (p<0.001 for all cognitive tests) led us to stratify all analyses by sex.
We first explored correlations of the 10-year CVD risk, assessed at phase 5, with cognitive function at phases 5 and 9 and cognitive decline over the 10-year follow-up.
Subsequently, regression analysis was used to model the impact of a 10 % increment in CVD risk on cognitive function at Phase 5 and 10-year cognitive decline. In these analyses, we first
calculated an overall test of association using multivariate analysis of variance (MANOVA) in order to account for the correlation between the cognitive tests and control Type 1 error inflation due to multiple tests. Then, linear regression was used to determine the cross sectional
association between the CVD risk, modeled to show the impact of a 10 percentage point increment in risk, and each cognitive test separately. We first examined unadjusted models, followed by models adjusted for age only, and finally the fully adjusted models including all four covariates.
The longitudinal analyses assessed the association between 10 year CVD risk at phase 5 and 10-year cognitive decline, calculated using data from phases 5, 7 and 9 as described earlier. Linear regression was used to model the association between a 10% increment in CVD risk at
baseline and cognitive decline. The adjustment for covariates was performed in three steps, as in the cross-sectional analysis. MANOVA analyses were also carried out to examine the association between CVD risk and overall cognitive decline. In supplementary analyses, occupational
position replaced adjustment for education in order to assess the effect of a later life measure of socioeconomic circumstances. Tests of statistical significance were two sided and results were statistically significant at p<0.05. All analyses were conducted using SAS software (version 9; SAS Institute, Cary, NC).
Results
Of 10,308 participants at baseline of the Whitehall II study (Phase 1, 1985-1988), 7,830 (75.9%) individuals at phase 5 (1997-1999) responded to the questionnaire or came to the clinical examination. Of these, 5,146 (65.7%) had complete data on cognitive function and all covariates. After excluding 319 participants with a history of CHD or stroke at phase 5, our final study sample consisted of 4,827 individuals (3,486 men and 1,341 women). Compared to the sample used in this analysis, participants at phase 5 excluded from this study had a higher mean 10-year CVD risk (12.1% vs. 9.8%, p <0.001). Missing data were also influenced by age, sex, and
education as individuals excluded were more likely to be women, older, and have a lower level of education (all p-values <0.001).
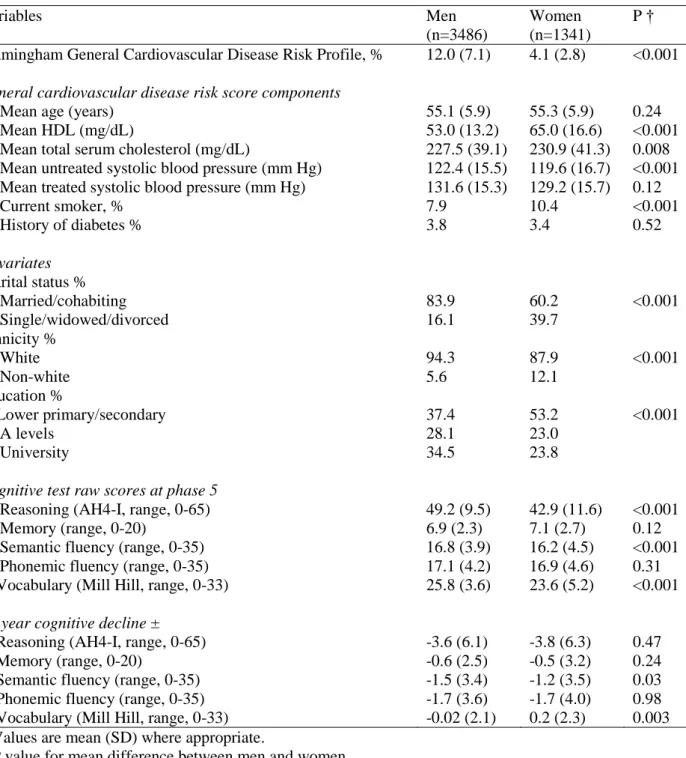
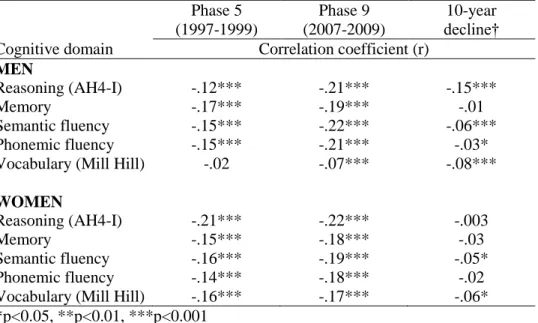
The characteristics of the study population are shown in Table 1. Men had a considerably higher mean 10-year CVD risk than women; 1,711 (49.1%) and 514 (14.7%) of men and 71 (5.3%) and 3 (0.2%) of women had a 10-year CVD risk higher than 10% and 20% respectively. The correlation analysis (supplementary TableS1) suggested robust cross-section and prospective associations between CVD risk and cognition except the association with vocabulary at phase 5 in men. These associations were largely similar in men and women, except for the tests of reasoning and vocabulary.
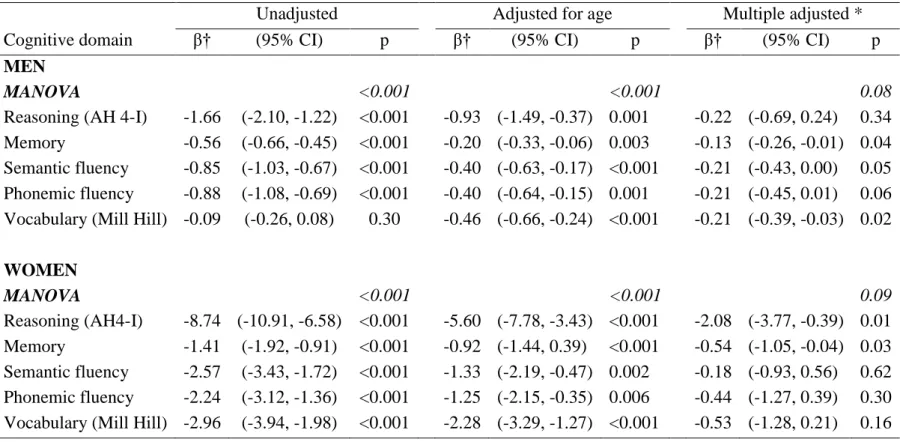
Regression analysis to model the cross sectional associations between 10% increment in Framingham CVD risk and cognitive function are presented in Table 2. The MANOVA analyses show significant associations between the CVD risk and overall cognitive function in the fully adjusted model in men (p=0.05) and women (p<0.03). The unadjusted regression estimates show a 10% higher CVD risk to be associated with 1.66 lower score on the test of reasoning (AH4-I) for men (95% confidence interval (CI) =-2.10, -1.22). In the unadjusted models CVD risk was inversely associated with all individual cognitive domains except the vocabulary test in men (p=0.30). These associations were robust to adjustment for age (all p-values <0.01). In the fully adjusted models all tests except reasoning in men (p=0.17) and the verbal fluency tests in women remained associated with CVD risk. Adjustment for occupational position yielded similar results to analyses adjusted for education (supplementary TableS2).
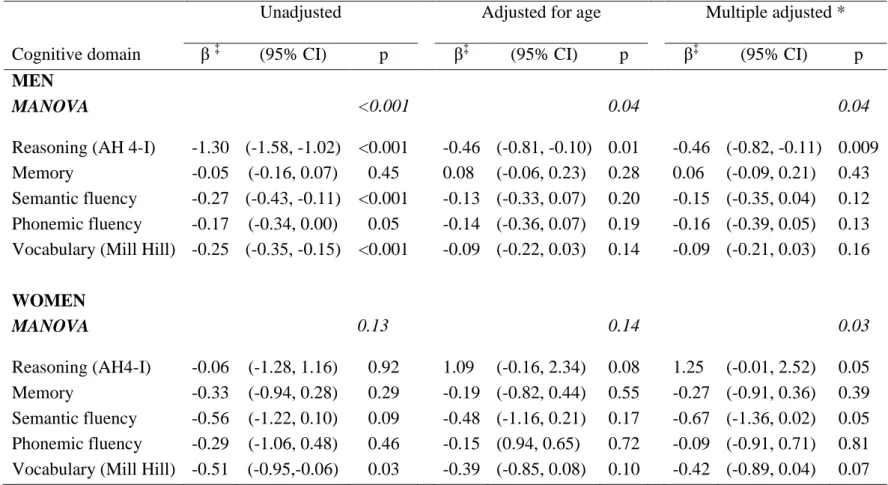
Table 3 shows the results of linear regression used to model the relation between a 10% increment in CVD risk at baseline and cognitive decline over 10 years. The unadjusted
MANOVA (p<0.001) suggests an association between CVD risk and overall cognitive decline only in men. In unadjusted models a 10% increment in CVD risk was associated with 1.30 points (95% CI = -1.58, -1.02) greater decline in reasoning. In unadjusted models in men, these affects were evident for all cognitive domains except memory; in fully adjusted models the association was robust only with reasoning (p=0.009). Replacing education with occupational position did not lead to significant changes in the results (supplementary TableS3).
The results on cognitive decline in women prompted us to further explore this association by categorizing the risk score differently in men and women (see supplementary TableS4). These results, adjusted for all covariates, suggest that all cognitive domains except vocabulary decline in all CVD risk groups in men and women.
We carried out several sensitivity analyses to test the robustness of our findings. First, we examined whether use of antihypertensive medication, a component of the Framingham CVD
risk algorithm, over the follow-up period, from phase 5 to phase 9, affected the association between CVD risk and cognitive decline. An increasing proportion of participants in the study reported to be on antihypertensive medication, 9.0 % at phase 5, 20.3% at phase 7, 23.3% at phase 8 and 31.3% at phase 9. As expected, adjustment for use of antihypertensive medication over study follow-up slightly attenuated the association between CVD risk and cognitive decline in both men and women. We obtained similar results when we adjusted for use of other classes of CVD medications (nitrates, antiplatelets, and lipid lowering drugs), results not shown but
available upon request.
Second, we repeated the analyses of the association between CVD risk and cognitive decline, excluding participants who had a validated CHD event over the follow-up (n=160). These results were essentially the same as those reported in the main analyses.
Third, since we had imputed the Framingham CVD risk profile for participants who were missing data for one or more components of the risk score, we repeated all analyses with the sample of participants who had complete data at phase 5 (n=4221). Again, we observed similar results to those in the analyses with the imputed data.
Discussion
In this large prospective cohort study of a middle-aged population, an adverse
Framingham general CVD risk profile, a validated predictor of future CVD, was associated with poor cognitive function in middle-aged men and women. When these associations were modeled using 10% increment in CVD risk, as has been previously done for stroke risk, (14, 15) the effects were much larger for women than for men. This may be due to the differences in risk distribution in men and women; in our study, and perhaps in others, the mean CVD risk in women was lower, at 4.1% compared with 12 % in men. In our study, cross-sectional correlation coefficients (supplementary TableS1) between CVD risk and cognitive function pointed to
comparable associations in men and women. Thus, a 10% increase in CVD risk is a considerably larger increase in risk in women compared to men. In regression analyses, cross-sectional
associations were robust and largely persisted after adjustment for demographic variables and education. With respect to 10-year cognitive decline, there was evidence of cognitive decline in all domains except vocabulary at all levels of CVD risk. However, higher CVD risk was
associated with greater decline only in reasoning in men.
Comparison with other studies
Findings from this study support results from studies that have examined the importance of multiple vascular and cardiovascular risk factors by examining the collective effect of
individual risk factors in relation to cognition (24-28). For example, Whitmer and colleagues reported that presence of multiple cardiovascular risk factors at midlife independent of age, race, sex and education substantially increased risk of dementia in old age. Those having
simultaneously high cholesterol, hypertension, diabetes, and being smokers had more than a two fold greater risk of dementia than those with no such risk factors (28). The dementia risk score developed by Kivipelto and colleagues also highlights the role of multiple cardiovascular risk factors in middle age and the future risk of dementia (24).
Given the importance of multiple vascular risk factors in relation to cognitive function, stroke, and CHD and the more global CVD risk scores present an important opportunity to study these associations. Although most of the studies in this domain have focused on stroke risk scores, especially the Framingham Stroke Risk Profile (FSRP), (13-16) we can draw some comparisons with these investigations. The cross sectional associations between CVD risk and cognitive function, observed in our study are largely consistent with results obtained in these studies. However, comparison with their findings is limited because of differences in study populations and neuropsychological tests used. In addition, whereas we found sex differences in
the associations and stratified our analyses accordingly, none of these studies reported sex differences in the association between stroke risk and cognitive function. We found that after adjusting for age, sex and education, 10 year CVD risk was associated with poorer performance in the test of memory in both men and women. However, while one study found an association with stroke risk and memory,(15) the other two did not find a similar association (14, 16).
Our results concerning the association between CVD risk and 10 year cognitive decline suggest a similar rate of decline at all levels of risk in women. In men, there is an indication of a global effect that in individual tests show greater decline in inductive reasoning in those with higher CVD risk at baseline. A previous study on older men showed the Framingham stroke risk score to predict decline in verbal fluency but not memory and visuospatial performance (13). Knopman and colleagues reported a steeper 6 year decline in processing speed and phonemic fluency in diabetics and only in processing speed for individuals with hypertension (5). Another study in an older cohort found an association between hypertension and cognitive decline over a 4-year period (29). Our finding for no greater decline in memory in those with higher CVD risk is consistent with a body of literature suggesting that frontally mediated cognitive functions such as verbal fluency, may be more vulnerable to the pathophysiological processes linked to
cardiovascular risk factors than other cognitive abilities such as memory (5, 30, 31).
Strengths and limitations
There are a number of limitations to our study. First, the participants of the Whitehall II study are office-based civil servants and thus are not fully representative of the British population which may limit the generalizability of our findings. Second, individuals who were included in our analysis had a more favorable demographic and CVD risk profile, suggesting that our results may be an underestimation of the relationship between CVD risk and cognitive function. In addition, since participants were tested three times over 10 years, there is a possibility of practice
effects (32). As a result, the observed decline in cognitive function may again be an
underestimation of the true extent of longitudinal cognitive decline. Finally, the relatively low 10-year CVD risk for women in our study population did not allow adequate examination of the relation between CVD risk and 10-year cognitive decline in women.
Conclusions and implications
In summary, our study is the first to examine the relationship between CVD risk as determined by the Framingham general CVD risk profile, and cognitive function and 10-year decline in a large middle-aged cohort. Our results are important as they suggest that not only adverse CVD risk is robustly related to poorer cognitive function in late midlife, it is also associated with decline in at least one cognitive domain in men. To make a difference in outcomes, current thinking about cognitive aging must shift from focusing on thresholds to a continuum of cognitive impairment (33). Moreover, the current emphasis on risk factors
especially treatable ones such as vascular risk factors must shift from late to early stages; subtle cognitive changes have been shown to be present as early as 22 years before diagnosis of Alzheimer‟s disease (34). Our own analyses concerning the role of treatment with
antihypertensive medications in attenuating the association between CVD risk and cognitive decline, suggest that early preventive measures and treatment of CVD risk factors may indeed have a positive impact on cognitive outcomes. The Framingham CVD risk score presents a convenient way to identify individuals at an increased risk of cognitive deficits later in life. Given the aging of populations worldwide and the link between impaired cognitive function in midlife and dementia, early targeting and treatment of cardiovascular risk factors, already important in their own right, should gain urgency for prevention of cognitive impairment in late-life.
ACKNOWLEDGEMENTS
Funding/Support: ASM is supported by a “European Young Investigator Award” from the European Science Foundation and the National Institute on Aging, NIH, USA (R01AG013196; R01AG034454). MK is supported by the Academy of Finland, the BUPA Foundation, and the National Institutes of Health, USA (R01HL036310; R01AG034454). David Batty is funded by a Welcome Trust Fellowship.
We thank all of the participating civil service departments and their welfare, personnel, and establishment officers; the British Occupational Health and Safety Agency; the British Council of Civil Service Unions; all participating civil servants in the Whitehall II study; and all members of the Whitehall II study team. The Whitehall II Study team comprises research scientists,
statisticians, study coordinators, nurses, data managers, administrative assistants and data entry staff, who make the study possible.
Role of Sponsors: The funding organization had no role in the design and conduct of the study, collection, management, analysis, and interpretation of data; and preparation, review, or approval of the manuscript.
References
1. Bursi F, Rocca WA, Killian JM, Weston SA, Knopman DS, Jacobsen SJ, Roger VL. Heart disease and dementia: a population-based study. Am J Epidemiol 2006;163(2):135-141. 2. Fillit H, Nash DT, Rundek T, Zuckerman A. Cardiovascular risk factors and dementia. Am
J Geriatr Pharmacother 2008;6(2):100-118.
3. Viswanathan A, Rocca WA, Tzourio C. Vascular risk factors and dementia: how to move forward? Neurology 2009;72(4):368-374.
4. Elias MF, Wolf PA, D'Agostino RB, Cobb J, White LR. Untreated blood pressure level is inversely related to cognitive functioning: the Framingham Study. Am J Epidemiol 1993;138(6):353-364.
5. Knopman D, Boland LL, Mosley T, Howard G, Liao D, Szklo M, McGovern P, Folsom AR. Cardiovascular risk factors and cognitive decline in middle-aged adults. Neurology 2001;56(1):42-48.
6. Knopman DS, Mosley TH, Catellier DJ, Sharrett AR. Cardiovascular risk factors and cerebral atrophy in a middle-aged cohort. Neurology 2005;65(6):876-881.
7. Singh-Manoux A, Marmot M. High blood pressure was associated with cognitive function in middle-age in the Whitehall II study. J Clin Epidemiol 2005;58(12):1308-1315.
8. Singh-Manoux A, Gimeno D, Kivimaki M, Brunner E, Marmot MG. Low HDL cholesterol is a risk factor for deficit and decline in memory in midlife: the Whitehall II study.
Arterioscler Thromb Vasc Biol 2008;28(8):1556-1562.
9. Sparks DL, Scheff SW, Liu H, Landers TM, Coyne CM, Hunsaker JC, III. Increased incidence of neurofibrillary tangles (NFT) in non-demented individuals with hypertension. J Neurol Sci 1995;131(2):162-169.
10. Conroy RM, Pyorala K, Fitzgerald AP, Sans S, Menotti A, De BG, De BD, Ducimetiere P, Jousilahti P, Keil U, Njolstad I, Oganov RG, Thomsen T, Tunstall-Pedoe H, Tverdal A, Wedel H, Whincup P, Wilhelmsen L, Graham IM. Estimation of ten-year risk of fatal cardiovascular disease in Europe: the SCORE project. Eur Heart J 2003;24(11):987-1003. 11. D'Agostino RB, Sr., Vasan RS, Pencina MJ, Wolf PA, Cobain M, Massaro JM, Kannel
WB. General cardiovascular risk profile for use in primary care: the Framingham Heart Study. Circulation 2008;117(6):743-753.
12. Wolf PA, D'Agostino RB, Belanger AJ, Kannel WB. Probability of stroke: a risk profile from the Framingham Study. Stroke 1991;22(3):312-318.
13. Brady CB, Spiro A, III, McGlinchey-Berroth R, Milberg W, Gaziano JM. Stroke risk predicts verbal fluency decline in healthy older men: evidence from the normative aging study. J Gerontol B Psychol Sci Soc Sci 2001;56(6):340-346.
14. Elias MF, Sullivan LM, D'Agostino RB, Elias PK, Beiser A, Au R, Seshadri S, DeCarli C, Wolf PA. Framingham stroke risk profile and lowered cognitive performance. Stroke
15. Llewellyn DJ, Lang IA, Xie J, Huppert FA, Melzer D, Langa KM. Framingham Stroke Risk Profile and poor cognitive function: a population-based study. BMC Neurol 2008;8:12. 16. Seshadri S, Wolf PA, Beiser A, Elias MF, Au R, Kase CS, D'Agostino RB, DeCarli C.
Stroke risk profile, brain volume, and cognitive function: the Framingham Offspring Study. Neurology 2004;63(9):1591-1599.
17. Marmot M, Brunner E. Cohort Profile: the Whitehall II study. Int J Epidemiol 2005;34(2):251-256.
18. Report of the expert committee on the diagnosis and classification of diabetes mellitus. Diabetes Care 2003;26 Suppl 1:S5-20.
19. Tunstall-Pedoe H, Kuulasmaa K, Amouyel P, Arveiler D, Rajakangas AM, Pajak A. Myocardial infarction and coronary deaths in the World Health Organization MONICA Project. Registration procedures, event rates, and case-fatality rates in 38 populations from 21 countries in four continents. Circulation 1994;90(1):583-612.
20. Heim AW. AH4: Group Test of General Intelligence. Windsor United Kingdom: NFER-Nelson Publishing Company, Limited; 1970.
21. Borkowski JG, Benton AL, Spreen O. Word fluency and brain damage. Neuropsychologica 1967;5:135-140.
22. Raven JC. Guide to using the Mill Hill vocabulary test with progressive matrices. London, UK: HK Lewis; 1965.
23. Alzheimer's Disease International. World Alzheimer Report. 2009.
24. Kivipelto M, Ngandu T, Laatikainen T, Winblad B, Soininen H, Tuomilehto J. Risk score for the prediction of dementia risk in 20 years among middle aged people: a longitudinal, population-based study. Lancet Neurol 2006;5(9):735-741.
25. Kivipelto M, Helkala EL, Hanninen T, Laakso MP, Hallikainen M, Alhainen K, Soininen H, Tuomilehto J, Nissinen A. Midlife vascular risk factors and late-life mild cognitive impairment: A population-based study. Neurology 2001;56(12):1683-1689.
26. Kivipelto M, Helkala EL, Laakso MP, Hanninen T, Hallikainen M, Alhainen K, Soininen H, Tuomilehto J, Nissinen A. Midlife vascular risk factors and Alzheimer's disease in later life: longitudinal, population based study. BMJ 2001;322(7300):1447-1451.
27. Kivipelto M, Ngandu T, Fratiglioni L, Viitanen M, Kareholt I, Winblad B, Helkala EL, Tuomilehto J, Soininen H, Nissinen A. Obesity and vascular risk factors at midlife and the risk of dementia and Alzheimer disease. Arch Neurol 2005;62(10):1556-1560.
28. Whitmer RA, Sidney S, Selby J, Johnston SC, Yaffe K. Midlife cardiovascular risk factors and risk of dementia in late life. Neurology 2005;64(2):277-281.
29. Tzourio C, Dufouil C, Ducimetiere P, Alperovitch A. Cognitive decline in individuals with high blood pressure: a longitudinal study in the elderly. EVA Study Group. Epidemiology of Vascular Aging. Neurology 1999;53(9):1948-1952.
30. Looi JC, Sachdev PS. Vascular dementia as a frontal subcortical system dysfunction. Psychol Med 2000;30(5):997-1003.
31. Elias PK, Elias MF, D'Agostino RB, Cupples LA, Wilson PW, Silbershatz H, Wolf PA. NIDDM and blood pressure as risk factors for poor cognitive performance. The
Framingham Study. Diabetes Care 1997;20(9):1388-1395.
32. Rabbitt P, Diggle P, Holland F, McInnes L. Practice and drop-out effects during a 17-year longitudinal study of cognitive aging. J Gerontol B Psychol Sci Soc Sci 2004;59(2):84-97. 33. Hachinski V. Shifts in thinking about dementia. JAMA 2008;300(18):2172-2173.
34. Elias MF, Beiser A, Wolf PA, Au R, White RF, D'Agostino RB. The preclinical phase of alzheimer disease: A 22-year prospective study of the Framingham Cohort. Arch Neurol 2000;57(6):808-813.
Table 1. Characteristics of the Study Population Variables Men (n=3486) Women (n=1341) P † Framingham General Cardiovascular Disease Risk Profile, % 12.0 (7.1) 4.1 (2.8) <0.001
General cardiovascular disease risk score components
Mean age (years) 55.1 (5.9) 55.3 (5.9) 0.24
Mean HDL (mg/dL) 53.0 (13.2) 65.0 (16.6) <0.001
Mean total serum cholesterol (mg/dL) 227.5 (39.1) 230.9 (41.3) 0.008 Mean untreated systolic blood pressure (mm Hg) 122.4 (15.5) 119.6 (16.7) <0.001 Mean treated systolic blood pressure (mm Hg) 131.6 (15.3) 129.2 (15.7) 0.12
Current smoker, % 7.9 10.4 <0.001 History of diabetes % 3.8 3.4 0.52 Covariates Marital status % Married/cohabiting 83.9 60.2 <0.001 Single/widowed/divorced 16.1 39.7 Ethnicity % White 94.3 87.9 <0.001 Non-white 5.6 12.1 Education % Lower primary/secondary 37.4 53.2 <0.001 A levels 28.1 23.0 University 34.5 23.8
Cognitive test raw scores at phase 5
Reasoning (AH4-I, range, 0-65) 49.2 (9.5) 42.9 (11.6) <0.001
Memory (range, 0-20) 6.9 (2.3) 7.1 (2.7) 0.12
Semantic fluency (range, 0-35) 16.8 (3.9) 16.2 (4.5) <0.001
Phonemic fluency (range, 0-35) 17.1 (4.2) 16.9 (4.6) 0.31
Vocabulary (Mill Hill, range, 0-33) 25.8 (3.6) 23.6 (5.2) <0.001
10-year cognitive decline ±
Reasoning (AH4-I, range, 0-65) -3.6 (6.1) -3.8 (6.3) 0.47
Memory (range, 0-20) -0.6 (2.5) -0.5 (3.2) 0.24
Semantic fluency (range, 0-35) -1.5 (3.4) -1.2 (3.5) 0.03
Phonemic fluency (range, 0-35) -1.7 (3.6) -1.7 (4.0) 0.98
Vocabulary (Mill Hill, range, 0-33) -0.02 (2.1) 0.2 (2.3) 0.003 * Values are mean (SD) where appropriate.
† P value for mean difference between men and women.
± Decline calculated using 3 repeat measures (phases 5 (1997-1999), 7 (2002-2004) and 9 (2007-2009) and standardized to represent 10-year decline in order to take into account variations in the follow-up.
Table 2. Cross-sectional association between a 10 % increment in the Framingham 10 year CVD risk and cognitive function
Unadjusted Adjusted for age Multiple adjusted *
Cognitive domain β† (95% CI) p β‡ (95% CI) p β‡ (95% CI) p
MEN
MANOVA <0.001 <0.001 0.05
Reasoning (AH 4-I) -1.66 (-2.10, -1.22) <0.001 -0.93 (-1.49, -0.37) 0.001 -0.34 (-0.82, 0.14) 0.17 Memory -0.56 (-0.66, -0.45) <0.001 -0.20 (-0.33, -0.06) 0.003 -0.14 (-0.27, -0.01) 0.04 Semantic fluency -0.85 (-1.03, -0.67) <0.001 -0.40 (-0.63, -0.17) <0.001 -0.24 (-0.45, -0.02) 0.03 Phonemic fluency -0.88 (-1.08, -0.69) <0.001 -0.40 (-0.64, -0.15) 0.001 -0.25 (-0.48, -0.01) 0.04 Vocabulary (Mill Hill) -0.09 (-0.26, 0.08) 0.30 -0.46 (-0.66, -0.24) <0.001 -0.23 (-0.42, -0.05) 0.01
WOMEN MANOVA <0.001 <0.001 0.03 Reasoning (AH4-I) -8.74 (-10.91, -6.58) <0.001 -5.60 (-7.78, -3.43) <0.001 -2.65 (-4.42, -0.87) 0.003 Memory -1.41 (-1.92, -0.91) <0.001 -0.92 (-1.44, 0.39) <0.001 -0.58 (-1.08, -0.07) 0.03 Semantic fluency -2.57 (-3.43, -1.72) <0.001 -1.33 (-2.19, -0.47) 0.002 -0.33 (-1.08, 0.42) 0.38 Phonemic fluency -2.24 (-3.12, -1.36) <0.001 -1.25 (-2.15, -0.35) 0.006 -0.62 (-1.48, 0.23) 0.15 Vocabulary (Mill Hill) -2.96 (-3.94, -1.98) <0.001 -2.28 (-3.29, -1.27) <0.001 -0.81 (-1.60, -0.02) 0.05 *Adjusted for age, ethnicity, marital status, education.
Table 3. The association between a 10 % increment in the Framingham 10 year CVD risk and cognitive decline †
Unadjusted Adjusted for age Multiple adjusted *
Cognitive domain β‡ (95% CI) p β‡ (95% CI) p β‡ (95% CI) p
MEN
MANOVA <0.001 0.04 0.04
Reasoning (AH 4-I) -1.30 (-1.58, -1.02) <0.001 -0.46 (-0.81, -0.10) 0.01 -0.47 (-0.82,-0.11) 0.009 Memory -0.05 (-0.16, 0.07) 0.45 0.08 (-0.06, 0.23) 0.28 0.06 (-0.09, 0.21) 0.43 Semantic fluency -0.27 (-0.43, -0.11) <0.001 -0.13 (-0.33, 0.07) 0.20 -0.15 (-0.35, 0.04) 0.14 Phonemic fluency -0.17 (-0.34, 0.00) 0.05 -0.14 (-0.36, 0.07) 0.19 -0.16 (-0.38, 0.05) 0.14 Vocabulary (Mill Hill) -0.25 (-0.35, -0.15) <0.001 -0.09 (-0.22, 0.03) 0.14 -0.08 (-0.21, 0.04) 0.17
WOMEN MANOVA 0.13 0.14 0.04 Reasoning (AH4-I) -0.06 (-1.28, 1.16) 0.92 1.09 (-0.16, 2.34) 0.08 1.17 (-0.08, 2.44) 0.07 Memory -0.33 (-0.94, 0.28) 0.29 -0.19 (-0.82, 0.44) 0.55 -0.27 (-0.91, 0.36) 0.39 Semantic fluency -0.56 (-1.22, 0.10) 0.09 -0.48 (-1.16, 0.21) 0.17 -0.67 (-1.36, 0.02) 0.06 Phonemic fluency -0.29 (-1.06, 0.48) 0.46 -0.15 (0.94, 0.65) 0.72 -0.08 (-0.89, 0.72) 0.83 Vocabulary (Mill Hill) -0.51 (-0.95,-0.06) 0.03 -0.39 (-0.85, 0.08) 0.10 -0.42 (-0.89, 0.04) 0.07 * Adjusted for age, ethnicity, marital status, education
† Decline calculated using 3 repeat measures (phases 5 (1997-1999), 7 (2002-2004) and 9 (2007-2009) and standardized to represent 10-year decline in order to take into account variations in the follow-up.
Supplementary tables
Table S1. Correlation coefficients between 10-year CVD risk at Phase 5 and cognitive function at phase 5, phase 9, and 10 year decline
Phase 5 (1997-1999) Phase 9 (2007-2009) 10-year decline† Cognitive domain Correlation coefficient (r)
MEN
Reasoning (AH4-I) -.12*** -.21*** -.15***
Memory -.17*** -.19*** -.01
Semantic fluency -.15*** -.22*** -.06***
Phonemic fluency -.15*** -.21*** -.03*
Vocabulary (Mill Hill) -.02 -.07*** -.08***
WOMEN
Reasoning (AH4-I) -.21*** -.22*** -.003
Memory -.15*** -.18*** -.03
Semantic fluency -.16*** -.19*** -.05*
Phonemic fluency -.14*** -.18*** -.02
Vocabulary (Mill Hill) -.16*** -.17*** -.06* *p<0.05, **p<0.01, ***p<0.001
† Decline calculated using 3 repeat measures (phases 5 (1997-1999), 7 (2002-2004), and 9 (2007-2009) and standardized to represent 10-year decline in order to take into account variations in the follow-up.
Table S2. Cross-sectional association between a 10 % increment in the Framingham 10 year CVD risk and cognitive function
Unadjusted Adjusted for age Multiple adjusted *
Cognitive domain β† (95% CI) p β† (95% CI) p β† (95% CI) p
MEN
MANOVA <0.001 <0.001 0.08
Reasoning (AH 4-I) -1.66 (-2.10, -1.22) <0.001 -0.93 (-1.49, -0.37) 0.001 -0.22 (-0.69, 0.24) 0.34 Memory -0.56 (-0.66, -0.45) <0.001 -0.20 (-0.33, -0.06) 0.003 -0.13 (-0.26, -0.01) 0.04 Semantic fluency -0.85 (-1.03, -0.67) <0.001 -0.40 (-0.63, -0.17) <0.001 -0.21 (-0.43, 0.00) 0.05 Phonemic fluency -0.88 (-1.08, -0.69) <0.001 -0.40 (-0.64, -0.15) 0.001 -0.21 (-0.45, 0.01) 0.06 Vocabulary (Mill Hill) -0.09 (-0.26, 0.08) 0.30 -0.46 (-0.66, -0.24) <0.001 -0.21 (-0.39, -0.03) 0.02
WOMEN MANOVA <0.001 <0.001 0.09 Reasoning (AH4-I) -8.74 (-10.91, -6.58) <0.001 -5.60 (-7.78, -3.43) <0.001 -2.08 (-3.77, -0.39) 0.01 Memory -1.41 (-1.92, -0.91) <0.001 -0.92 (-1.44, 0.39) <0.001 -0.54 (-1.05, -0.04) 0.03 Semantic fluency -2.57 (-3.43, -1.72) <0.001 -1.33 (-2.19, -0.47) 0.002 -0.18 (-0.93, 0.56) 0.62 Phonemic fluency -2.24 (-3.12, -1.36) <0.001 -1.25 (-2.15, -0.35) 0.006 -0.44 (-1.27, 0.39) 0.30 Vocabulary (Mill Hill) -2.96 (-3.94, -1.98) <0.001 -2.28 (-3.29, -1.27) <0.001 -0.53 (-1.28, 0.21) 0.16 * Adjusted for age, ethnicity, marital status, occupational position
Table S3. The association between a 10 % increment in the Framingham 10 year CVD risk and cognitive decline †
Unadjusted Adjusted for age Multiple adjusted *
Cognitive domain β ‡ (95% CI) p β‡ (95% CI) p β‡ (95% CI) p
MEN
MANOVA <0.001 0.04 0.04
Reasoning (AH 4-I) -1.30 (-1.58, -1.02) <0.001 -0.46 (-0.81, -0.10) 0.01 -0.46 (-0.82, -0.11) 0.009 Memory -0.05 (-0.16, 0.07) 0.45 0.08 (-0.06, 0.23) 0.28 0.06 (-0.09, 0.21) 0.43 Semantic fluency -0.27 (-0.43, -0.11) <0.001 -0.13 (-0.33, 0.07) 0.20 -0.15 (-0.35, 0.04) 0.12 Phonemic fluency -0.17 (-0.34, 0.00) 0.05 -0.14 (-0.36, 0.07) 0.19 -0.16 (-0.39, 0.05) 0.13 Vocabulary (Mill Hill) -0.25 (-0.35, -0.15) <0.001 -0.09 (-0.22, 0.03) 0.14 -0.09 (-0.21, 0.03) 0.16
WOMEN MANOVA 0.13 0.14 0.03 Reasoning (AH4-I) -0.06 (-1.28, 1.16) 0.92 1.09 (-0.16, 2.34) 0.08 1.25 (-0.01, 2.52) 0.05 Memory -0.33 (-0.94, 0.28) 0.29 -0.19 (-0.82, 0.44) 0.55 -0.27 (-0.91, 0.36) 0.39 Semantic fluency -0.56 (-1.22, 0.10) 0.09 -0.48 (-1.16, 0.21) 0.17 -0.67 (-1.36, 0.02) 0.05 Phonemic fluency -0.29 (-1.06, 0.48) 0.46 -0.15 (0.94, 0.65) 0.72 -0.09 (-0.91, 0.71) 0.81 Vocabulary (Mill Hill) -0.51 (-0.95,-0.06) 0.03 -0.39 (-0.85, 0.08) 0.10 -0.42 (-0.89, 0.04) 0.07 *Adjusted for age, ethnicity, marital status, occupational position
† Decline calculated using 3 repeat measures (phases 5 (1997-1999), 7 (2002-2004) and 9 (2007-2009) and standardized to represent 10-year decline in order to take into account variations in the follow-up.
Table S4. The association between categories of Framingham 10 year CVD risk and cognitive decline * MEN† WOMEN† 10 year decline± (95% CI) p 10 year decline± (95% CI) p Reasoning (AH 4-I) 0.03 0.02 CVD risk 0-9.9% -3.19 (-3.73, -2.66) CVD risk 0-4.9% -4.22 (-4.82, -3.62) CVD risk 10-19.9% -3.66 (-4.21, -3.10) CVD risk 5-9.9% -2.97 (-3.82, -2.13) CVD risk ≥ 20% -4.06 (-4.76, -3.37) CVD risk ≥ 10% -3.73 (-5.24, -2.22) Memory 0.06 0.24 CVD risk 0-9.9% -0.31 (-0.53, -0.08) CVD risk 0-4.9% -0.36 (-0.66, -0.05) CVD risk 10-19.9% -0.46 (-0.69, -0.23) CVD risk 5-9.9% -0.73 (-1.16, -0.31) CVD risk ≥ 20% -0.16 (-0.45, 0.13) CVD risk ≥ 10% -0.48 (-1.25, 0.28) Semantic fluency 0.08 0.02 CVD risk 0-9.9% -1.12 (-1.42, -0.82) CVD risk 0-4.9% -0.87 (-1.20, -0.54) CVD risk 10-19.9% -1.04 (-1.35, -0.73) CVD risk 5-9.9% -1.53 (-2.00, -1.07) CVD risk ≥ 20% -1.45 (-1.84, -1.06) CVD risk ≥ 10% -1.18 (-2.01, -0.36) Phonemic fluency 0.41 0.18 CVD risk 0-9.9% -1.37 (-1.69, -1.04) CVD risk 0-4.9% -1.82 (-2.21, -1.43) CVD risk 10-19.9% -1.36 (-1.70, -1.03) CVD risk 5-9.9% -1.55 (-2.10, -1.01) CVD risk ≥ 20% -1.62 (-2.04, -1.20) CVD risk ≥ 10% -2.53 (-3.50, -1.56) Vocabulary (Mill Hill) 0.24 0.14 CVD risk 0-9.9% 0.04 (-0.15, 0.23) CVD risk 0-4.9% 0.38 (0.16, 0.61) CVD risk 10-19.9% -0.02 (-0.21, 0.18) CVD risk 5-9.9% 0.06 (-0.25, 0.38) CVD risk ≥ 20% -0.17 (-0.41, 0.08) CVD risk ≥ 10% 0.22 (-0.35, 0.78)
*Adjusted for age, ethnicity, marital status, education
† In men(women) the low, intermediate and high CVD risk group cut offs are different and composed of 50% (73.8%), 34.3% (21%) and 14.7% (5.3%) of the sample.