Designing New Performance-Based Incentive Regimes for Operating Contracts in the Province of Gipuzkoa, Spain
by
David Antonio Laidig
B.A. American Studies, University of California at Santa Cruz (2005) Submitted to the Department of Civil and Environmental Engineering
in partial fulfillment of the requirements for the degree of Master of Science in Transportation
at the
Massachusetts Institute of Technology OFTECHNOLOGY
June 2010
JUL 152010
O Massachusetts Institute of
Technology
L
IRARIES
All rights reserved.ARCHIVES
Signature of Author...
Department of Civil and Environmental Engineering May 24, 2010
C ertified by ... ... . ...
John Attanucci Research Associate ivil and Environmental Engineering Thesis Supervisor
Accepted by ... ,... . . Daniele Veneziano Chairman, Departmental Committee for Graduate Students
Designing New Performance-Based Incentive Regimes for Operating Contracts in the Province of Gipuzkoa, Spain
by
David Antonio Laidig
Submitted to the Department of Civil and Environmental Engineering in partial fulfillment of the requirements for the degree of
Master of Science in Transportation ABSTRACT
Over the last several decades, local transport authorities in Europe and around the world have introduced competitive bidding in concessions for providing bus service, often resulting in reduced costs for service. The main caveat to this approach is that without proper oversight by the authority, operators may reduce quality to cut costs and maximize profits. To counter this, performance regimes are developed and incentives are typically offered to achieve the policy goals of the authority. Through an analysis of current theory and practice, this thesis is intended to serve as an introduction to the end-to-end process of transport contracts- drawing from the fields of contract economics, organizational structure, service quality, and performance measurement as they relate to public transport service.
Expanding on current practice, suggestions are offered for future interurban bus operations contracts in the Province of Gipuzkoa, Spain. First, several recommendations regarding contract structure and bidding procedures are discussed, proposed, and demonstrated. Then, under the framework of the European standard on quality management in public transport, a selection of performance measures are proposed. These measures were especially selected and designed for the technological capacities and operational conditions of Gipuzkoa. Several of these measures (ridership, on-time performance, and completed service) are then suggested for incentives within future contracts. Representative incentive levels and methods for calculating and paying each are proposed for an upcoming contract currently under consideration in Gipuzkoa.
Thesis Supervisor: John Attanucci
Acknowledgments
Like all other theses, this would research not have been possible without the support of many individuals. First and foremost, I would like to thank the Chicago Transit Authority and the Diputaci6n Foral de Gipuzkoa for their financial support.
To My Family, who supported me while taking the meandering path to reach where I am. To John Attanucci, whose encouragements to stick my neck out have not gone unnoticed. To Nigel Wilson, Rabi Mishalani, and Fred Salvucci, whose feedback have been invaluable in my research
Mila Esker to Mikel Murga for setting up the connection with Gipuzkoa and his constant positive attitude and encouraging words.
Eskerrik Asko to our colleagues at the DFG (Arantza Tapia, Pilar Arana and Aintzane) and the TGG (Arantxa Arocena, Jakot Karrera, and Agurtzane Allur), who made our stay in paradise both
comfortable and productive.
To Jared and Julian, my capable colleagues who have served as a shoulder to lean on many times over the past 21 months.
To my lab-mates (in no particular order: Yossi, Winnie, Liz, Val, Andrew, Uniman, Andre, Albert, Jay, Nihit, Sam, etc.), especially the night owls, who have kept me entertained and provided many welcome distractions, both in and out of 1-235.
To the MIT Cycling Team and Nicole Freedman, a group of phenomenal athletes who gave me further insight into the value of perseverance and never uttered a discouraging word after this author's often-dismal race results.
To Elissa for helping me get me in.
Table of Contents
1 Introduction and Background...10
1.1 Gipuzkoa...10
1.2 Public Transport within Gipuzkoa... 11
1.3 The Birth of Lurraldebus...12
1.4 Objectives and Research Approach... 15
2 Review of Literature and State of the Practice... 17
2.1 Contract Econom ics...17
2.2 Transport Contract Design...20
2.3 Transport O rganization Regim es and Tendering... 21
2.3.1 The Regulatory Framework within the European Union and Spain...23
2.4 Q uality and Perform ance M anagem ent ... 25
2.4.1 M easuring Results In Public Transport... 26
2.4.2 Seeing Success: Selecting Perform ance M easures... 27
2.4.3 Learning from Other Successes: Self-assessment and Benchmarking...31
2.4.4 Rewarding quality success: integration of quality into a tender... 35
2.4.5 M itigating the Risk of Failure: Dynam ic Benchm arking... 38
2.5 Conclusion...40
3 Case Studies of Current Practice in Contracts... 41
3.1 Sum m ary of Previous Case Studies... 41
3.1.1 M elbourne, Australia...41
3.1.2 Copenhagen, D enm ark... 42
3.2 Bidding and Perform ance in London Bus and U K Rail... 44
3.2.1 H istory of the System ... 45
3.2.2 Bidding Process...46
3.2.3 Contract Structure and Perform ance Incentives. ... 49
3.2.4 The Future of QICs ... 51
3.2.5 Additional Quality of Service Measures in London Bus Contracts...52
3.3 Stockholm , Sweden ... 54
3.3.1 History of Tendering and O rganizational Structure... 54
3.3.2 The Incentive Regim e...55
3.3.3 Effectiveness of the Incentive Regim e... 57
3.3.4 Conclusions...60
3.4 Catalonia (Spain) Interurban Bus Q uality Regim e... 61
3.4.1 Q uality M anuals...62
3.4.2 Custom er Charter...63
3.4.3 Conclusions...63
4 A Framework for the DFG's Lurraldebus Operations Contracts - the Proposed Bidding Regime 65
4.1 H istory of interurban bus organizational structure in G ipuzkoa... 65
4.2 The D onostialdea-Este Contract... 67
4.2.1 O bjectives...70
4.3 Proposed Bidding Regim e- Contract Structure... 71
4.3.1 Contract D uration...72
4.3.2 Inclusion of scheduling details... 72
4.3.3 Current and Proposed Cost M odel... 73
4.3.4 Handling eventualities: force majeure and act of god clauses... 77
5 The Proposed Perform ance Regim e... 79
5.1 Im portant considerations in defining a perform ance regim e... 79
5.2 The Benefits of Sim plicity...80
5.3 Elem ents of the Proposed Perform ance Regim e... 80
5.3.1
Availability ... 81 5.3.2 Accessibility ... 84 5.3.3 Inform ation...86 5.3.4 Tim e...88 5.3.5 Custom er care ... 97 5.3.6 Com fort...985.3.7 Safety and Security...101
5.3.8 Environm ental Im pact...101
5.3.9 O ther Perform ance M easures...102
5.4 The O perator Scorecard...104
6 The Proposed Incentive Regim e...107
6.1 Ridership...107
6.2 Reliability...112
6.3 Com pleted Service...114
6.4 Conclusion...116
7 Conclusions and Suggestions for Further Research...117
7.1 Sum m ary...117
7.2 Suggestions for Future Research...118
List of Tables
Table 3.1: Sample Copenhagen Quality Index Calculation...43
Table 3.2: Causes for canceled departures for S~derort from January 2000 to December 2006...59
Table 4.1: Sam ple bidder cost tem plate. ... 76
Table 5.1: Schedule:route Zumaia - Donostia. ... 87
Table 5.2: Overall travel Time, Route Beraun -Donostia Weekdays, Feb 2010...89
Table 5.3: Deviation of departure times (in minutes) from scheduled departures for selected routes. W eekdays, M arch 2010. ... 91
Table 5.4: Levels of Service for On-Time performance ... 92
Table 5.5: LOS grades for departure times on a selection of routes within the Donostialdea-Este concession, M arch 2010 ... 93
Table 5.6: Sample comparison between auto and public transport travel time ... 94
Table 5.7: Sample comparison between auto and public transport time on major OD pair...94
Table 5.8: RBT (Travel time only) on two routes in the Donostialdea-Este area...96
Table 5.9: Reliability Buffer Time, AM Peak. April 2010...96
Table 5.10: Sample Mystery Shopper Scorecard: Vehicle Cleanliness (CEN 2006)...100
Table 5.11: C ost-per-Passenger, 2008...103
Table 5.12: Exam ple route scorecard...105
Table 6.1: Exam ple Ridership by type of route...107
Table 6.2: Average fare by method of payment Donostialdea-Este routes, April 2010...109
Table 6.3: Exam ple ridership bonus calculation...109
Table 6.4: Example payment amounts based upon on-time performance...112
Table 6.5: Example contract payment amounts for missed trips incentive...114
Table A. 1: Calculated cycle times, Donostialdea-Este, February 2010...122
Table A.2: Calculated cycle times, Donostialdea-Este, February 2010...123
Table A.3: Calculated cycle times, Donostialdea-Este, February 2010...124
Table A.4: Calculated cycle times and possibilities for interlining...125
List of Figures
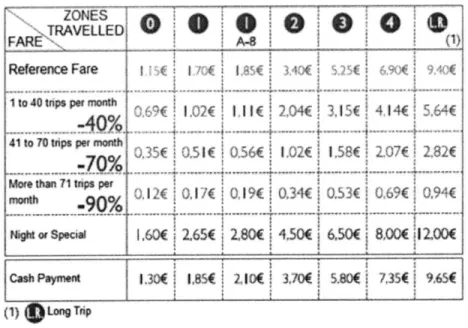
Figure 1.1: Lurraldebus zonal fare table... 14Figure 2.1, TCRP 88: Transit performance measure points of view, categories, and examples...28
Figure 2.2, QUATTRO Q uality Circle... 31
Figure 2.3: Dynamic benchmarking example 1...38
Figure 2.4: Dynamic benchmarking: incentive threshold resetting ... 39
Figure 3.1: U K Rail Franchise Process... 48
Figure 4.2: Interurban Bus Transport in Gipuzkoa after the creation of Lurraldebus...67
Figure 4.3: M ap of D onostialdea-Este area... 68
Figure 5.1: Loads by Half-Hour, Beraun- Donostia March 2010...83
Figure 5.2: Relations between information policies and ease of use. ... 85
Figure 5.3: Schedule, route Hondarribia - Txinguidi. ... 86
Figure 6.1: Example linear vs increasing slope payment amounts for OTP incentive...113
Figure 6.2: Example linear and increasing payment amounts for missed trip incentive...115
1
Introduction and Background
This thesis proposes an end-to-end bidding and performance-measurement regime for the interurban bus services in the province of Gipuzkoa, Spain through a critical evaluation of state-of-the-practice contract management procedures currently deployed within the EU. The desired result is to both improve efficiency and build institutional capacity through a combination of a well-defined bidding structure and improved performance measurement, all the while making use of state-of-the-art technology.
After a review of literature, best-practices and selected case-studies, a bidding structure is defined. This comprises several steps, beginning with the definition of a cost model for pricing both a specified level of service and small changes in service. Then, a series of performance metrics germane to the situation in Gipuzkoa are suggested. The proposed cost model is then extended into the beginnings of a basis for payment in new operations contracts. Within the concession itself there are several important dynamic modifications to payments, designed to provide incentives for the operators to undertake actions leading to service quality improvements. These incentives will be calculated using a subset of the performance measures defined earlier. While the central objective of this thesis pertains primarily to a specific application in Gipuzkoa, it is intended to be accessible for other local authorities in search of a synthesis of practice at the intersection of contracting and performance measurement.
1.1 Gipuzkoa
Gipuzkoa, a province in Northwest Spain, forms a part of the Autonomous Community of the Basque Country, and is bordered by the other Basque provinces of Biscay and Alava, the Spanish Autonomous Community of Navarre, the French province of Pyrinies-Atlantiques, and the bay of
Biscay. In 2006, the population of Gipuzkoa was approximately 687,000, a figure that is projected to grow to nearly 710,000 by 2020 (Basque Statistics Office n.d.). The provincial level government is known as la Diputacidn Foralde Gipuzkoa (DFG). Gipuzkoa is further divided into 9 counties
(comarcas), each of which has a nucleus in a principal town.
The provincial capital, Donostia-San Sebastiin, has a population greater than 180,000 and constitutes the origin or destination for the greatest proportion of trips within the province. There are five other towns with a population greater than 20,000- Irdin, Errenteria, Eibar, Zarautz, and Arrasate-Mondrag6n. Most passenger trips in the province occur either within the counties or between the counties and Donostia- San Sebastian', as well as between Donostia-San Sebastian and the neighboring provincial capital of Bilbao.
1.2 Public Transport within Gipuzkoa
Public passenger transport in Gipuzkoa includes a variety of modes and is provided by a number of operators. Several cities and towns also provide urban bus service within their community and surroundings, the largest being dBus, which provides urban service within Donostia- San
Sebastiin. Interurban bus services are provided by multiple operators throughout the province. Most of these operators2 are united under the Lurraldebus brand. These services carried nearly 21.3 million passengers in 2009 (slightly over 67,800 per median weekday), up from 18.2 million (approximately 58,600 per median weekday) in 2008.
In addition to bus service, two regional rail services cross the province: the Iberian gauge network of RENFE, which provides commuter rail service from Onate in the southwest to Irdin on the French border; and the meter-gauge network of EuskoTren, which provides service in the northern area of the province, originating in Bilbao in the neighboring province of Biscay, entering
Gipuzkoa at Eibar in the west and continuing east along the coast, through Irdn and terminating across the border at Hendaye in France. Both rail networks serve Donostia-San Sebastiin. This work 1 A total of 48% of trips on the Lurraldebus network begin or end in Donostia. For further information on passenger
trip distribution within Gipuzkoa, see Gomez Gelvez (2010).
2 The LOTT ( Ley de Ordenacidn de los Transportes Terrestres, the primary regulation which governs land-based transport in Spain) specifies that interurban services between autonomous communities are under the control of the
Spanish Ministry of Development, while the interurban services wholly within autonomous communities are designated by the competent local authority within the respective autonomous community (Comisi6n Nacional de la
Competencia 2008). It is primarily for this reason that not all interurban routes that travel within Gipuzkoa are under the Lurraldebus brand. For further information on the LOTT, see section 2.3.1.
focuses solely on the contractual interactions between the province, as manager of Lurraldebus SL and the operators that provide interurban bus service under the Lurraldebus brand. That being said, the fluid nature of bus service combined with a properly-designed, flexible contract for interurban bus service can aid in coordination across modes by allowing for targeted small changes to service, specifically network characteristics geared towards synchronization.
1.3 The Birth of Lurraldebus
Prior to mid-2007, the interurban buses of the province of Gipuzkoa were privately operated. Bus routes were packaged into concessions and awarded based largely upon historical precedent and allowing the local incumbent operators to retain their operating rights. While the province provided a subsidy for fleet renewalP existed, neither fares nor direct operations were subsidized and the DFG had little information to regulate the operators. These services were not highly regarded, and the automobile was making consistent gains in mode share. As a result, the number of interurban bus trips declined 25% in the decade between 1996-2005 (Diputaci6n Foral de Gipuzkoa 2008, 2).
To reverse this decline, in 2003 the province began studying methods to stimulate the demand for trips taken via interurban bus. The first major act of this effort was enacted on 28 December 2004, with the goals of stimulating improvement in passenger transport, the Gipuzkoa Provincial Council authorized the creation of agreements with various communities
(mancomunidades) and counties in order to finance "sustainable mobility plans." These plans focus
on near- and medium-term results to prioritize both improved mobility for the population and sustainability, with the goal of facilitating additional trips on public transport for those who live, work, or study within the same county. The first county to enact one of these plans was the Alto Deba, where the seat of major activity is the industrial and university town of Arrasate-Mondrag6n.
3 The subsidy provides for 50% of the purchase price of a new bus. The main goal of this subsidization regime is to
maintain a maximum vehicle age of 12 years, and a fleet average age of 6 years. Through this program, the DFG has subsidized 78 new buses between the years of 2003-2010 (El Diario Vasco 2010). This represents approximately 25% of the Lurraldebus fleet.
After this policy was devised, the province and the towns of the Alto Deba realized that it was necessary to redesign the bus passenger service throughout the area, focusing specifically on
improving service frequencies. These schedule changes were approved by provincial order on 22 August 2006. The implementation of new service resulted in a large increase in net cost, projected at C1.4 million for the first year of operation. Increases in fare revenue were not projected to offset these costs. As a result, on 12 September 2006, the provincial council approved the necessary measures to fund the new services offered by the concessionaire through the means of an operating subsidy. These services were put into effect that month.
After the inauguration of these new subsidies, the province, being the regulator of regular bus public transport has worked towards a series of measures to guarantee mobility within the entire territory and make public transport more attractive in relation to the private automobile for all of the services under its control. In addition, steps needed to be taken to improve the image of public transport. On 22 November 2005, the formation of Lurraldebus SL was approved by the provincial council. The Lurraldebus brand united all of the operators and services under provincial concession. The primary results of this initial effort were the development of the Billete
Onico
(common ticket), a smart card used as a method of payment across all operators, and the re-branding of all services provided by operators who were signatories to the original effort. Underlying the BilleteOnico
is an integrated fare collection and Automatic Vehicle Location (AVL) system, which was implemented by consultants involved in the project and coincidentally, provides a wealth of data for analysis.On 15 May, 2007, the provincial council approved the authorization and funding for the deployment of the Billete
Onico
for all concessions under provincial control. These included the setting of a timetable for implementation, the creation of a zonal fare structure with price discounts that increased with usage (Figure 1.1), and the creation of an annually revisable payment system designed to maintain the "economic equilibrium" of the concessions. In order to reach an agreement with the operators, the concession contracts for existing routes were rewritten to guarantee that if the concessionaires maintained the same level of service, their total revenue, from a combination of faresand subsidy, would not be less than a specific agreed-upon total revenue. Fares collected were returned to the operators, and subsidies were added, if needed, to this total in order to meet the agreed-upon revenue. These payments did not include any relation to the quality of service provided. Furthermore, the process of increasing offered level of service was not clearly defined.
ZONES] FARE4 A-8(1) Reference Fare 1._1 tC 185 1 to 40 tne pemno O 9 2( (24 31 5( 4 14(564
-40
41 to0
tnps p month 035f' 0.5 I I56C 12 158( 207 2,82(More than 71 tnps per
inonh
9
0
J124~ 01/( 1 9C 034( 0.53C( 0,0f Of)9"* 90%IZ
Ngt or Specal I.60( 2,65f 280( 450(- 6,50( 8.00 12.0(
(1)
DLong
Toi
Figure 1.1: Lurraldebus zonalfare table
As a result of the fare-policy changes introduced in the past several years, the system designed for the management of and payment for the services covered under concessions remains very
complex. The most difficult problem arising from the situation relates to the modification in levels of service for each operator. Thus, it is necessary to establish procedures with respect to the interaction and integration of individual bus routes and the multi-modal system as a whole, with the goal of easier facilitation of the administration's planning, operation and control of the services.
Realizing this, the DFG has modified the contract for the public transport services operated by the concessionaire Trasportes PESA, SA. As the system of passenger fare discounts has
unpredictably changed the structure and amount of revenue collected on a route-by-route basis, this modification moves the basis of payment from a guaranteed income to that of an audited per-kilometer cost. To aid in the modification of service, the amount of service-km may be modified by ±12% without re-negotiation. To further encourage the operator to maintain the service quality to
the benefit of passengers, an additional 7% of collected revenues is offered to the operator to provide for a reasonable profit. This contract is viewed as a test case for future concessions, which gradually will be put out to bid starting in 2012.
1.4 Objectives and Research Approach
The motivation for this research is the expiration of the current round of concessions in 2012. The DFG considers the Lurraldebus project to be a success, with substantial gains in the number of passenger trips being provided and taken on interurban public transportation-- increasing from nearly 15.4 million in 2005 to nearly 17.2 million in 2008 (Diputaci6n Foral de Gipuzkoa 2008, 2). Furthermore, the Billete Unico smart card is the method of payment used for nearly 70% of trips taken on the Lurraldebus network. This success, however, prompts new questions and the current situation leaves room for improvement in the contracting scheme. Given that the
Lurraldebus project and the contract modifications that accompany it were proposed and rolled out in a short period of time, this did not allow for an in-depth analysis of the goals beyond incremental ridership gains which the new regime was to accomplish.
Some of these goals are now clear. Re-organized concessions present an opportunity for increasing efficiency through economies of scale and density. Further efficiency can be gained by
using automated scheduling software to create schedules that both maximize efficiency for vehicles and provide more information to passengers. This process can make use of the data warehoused within the Lurraldebus information system.
Furthermore, before the next round of concessions are put up for bid, Gipuzkoa's Minister of Transport has expressed interest in the next round of contracts including a performance bonus given the attainment of certain criteria. This thesis seeks to select appropriate criteria and present methods for developing performance targets for the operators based upon both current operating data and policy objectives defined by the DFG administration.
Chapter 2 begins with a foundation from a wide variety of literature that will serve as technical background for the rest of the thesis- specifically brief introductions to contract
economics, cost modeling, bidding procedures, and performance measurement. Chapter 3 then continues with several case studies of contract and incentive structure in other European regions, utilizing the concepts introduced in Chapter 2 for analysis of previous and current practice.
Chapter 4 focuses on the design the contract bid framework and overall bidding process, taking special consideration of the relevant circumstances in Gipuzkoa. This focuses primarily on the Donostialdea-Este area, proposed to be the first concession to be bid after the introduction of the Lurraldebus project. This includes a reorganization of the existing concessions, as well as the inclusion of increased information in the bid package - primarily the inclusion of vehicle schedules and information on operational conditions and performance for the routes involved. The process will make use of Lurraldebus AVL and fare data, and will take into account variations in operating
conditions. Before the final bidding procedure can be introduced, several important aspects of a contract regime are covered. The chapter concludes with an improved cost model to guide the estimation of costs incurred in providing service or changes in service.
Chapter 5 defines the measures included within the proposed performance regime. The performance measurement regime is comprised of various measures covering a variety of quality aspects and focusing on the performance of the entire Lurraldebus network. Finally, the chapter concludes with recommendations on how to continuously monitor the performance of the operators within the Lurraldebus network.
Chapter 6 discusses a subset of these indicators previously proposed and their use as
incentives tied to the value of the contract. Examples, both real and theoretical, are given to show the reader how these incentives would modify the contract value.
Chapter 7 presents the conclusion of this thesis, beginning with a summary of the topics covered therein and the final recommendations. It concludes with some of the opportunities for future research that arose during the research process.
2 Review of Literature and State of the Practice
This thesis draws upon a wide variety of work in the fields of contract economics, transport contract design, quality management, and performance measurement in public transport in order to understand the state of the practice in transport quality. In order to further discuss a proposed
contract and performance regime for Gipuzkoa, a non-exhaustive introduction to each of these fields and the interrelationships between them is presented. For further information, it is suggested that the reader refer to the works cited.
2.1 Contract Economics
Halvorsen (1993) examined the relevance of the theory of contract economics in the transport context and surveyed public transport authorities within the US to determine their usage of various contracting forms. The development of the field of contract economics has been driven by the need to understand the implications of the relationships between a principal (the party who authorizes the actions of another party) and an agent (the party who will act given the will of the principal). Elements that may concern the public transport provisioning are the study of
development of a workable contract to entice the entrance of agents into a field, and to then entice these agents to perform in accordance with the wishes of the principal.
Frequently, it is assumed that two parties entering into an agreement have complete information about the factors relevant to the choices they make. This is often not the case, as the seller of a product (or in the transport context, the incumbent in an area) often knows more than the buyer. This phenomenon is referred to as asymmetric information (Pindyck and Rubinfeld 2001, 595)-. Literature on contract economics defines two large problems under the topic of asymmetric information; adverse selection-- the influence of asymmetric information on entering into a contract with another party-- and moral hazard-- where both parties enter into an agreement with equal information and eventually one fails to provide the information to the other. This causes the parties
to behave differently than they would otherwise. Adverse selection can arise when an operator, who is most aware of a deficiency within the contract specification and most aggressively pursues extra compensation for changes, can be awarded the contract (Hensher and Wallis 2005). Moral hazard has also become an acknowledged problem in some transport market failures, such as the spectacular contracting meltdown in Melbourne, where an overly optimistic contracting and finance scheme led to predictions for revenue growth that did not materialize. As a result, the operators involved
provided gradually degraded service and could not be held accountable by the local authority (Mees
2005; Blakey 2006).
Contract economics, as considered by Halvorsen, makes two assumptions about the environment in which parties enter into a contract. First, there is only one principle who offers the contract and that there are multiple bidders competing to win the contract. The principle must construct contracts that will interest a number of potential agents in the contract. The second assumption is that the principle understands the agent's objectives and cost and utility functions. If not, the contractor may determine a manner to achieve the stated objectives while negatively affecting the principle's utility.
Halvorsen notes two different schools of thought regarding contract development. Within the transportation literature, contract incentives are a method designed to steer the agent's behavior by providing incentives for the agent to attain certain standards. The process involves selection of quantities, gathering of indicators, and then the development of a payment function based upon the performance shown by these indicators, synthesized into the bid and contract documents.
Information on the structuring of performance regimes is described further in section 2.4. The other school of thought was the application of the theory of contract economics in transport contracting. Theoretically optimal contract economics requires the simultaneous consideration of four inter-related factors:
1. The objectives of the principal, such as quality service; 2. The objectives of the agent, such as profit and reputation;
3. The agent's cost of actions, such as incentive attainment; and 4. The parties' understanding of how the outcome can be verified.
By simultaneously considering these four factors, both the principal's net benefit can be increased and the resources used in the monitoring of the contractor's performance can be reduced.
Given the current realities of public passenger transport in the US and Western Europe--conflicting objectives of providing high quality service at minimal cost, while requiring a subsidy--simultaneously solving a system of equations based upon the above four factors is difficult, if not nearly impossible. Nevertheless, a crucial component of this is a utility function, which weighs the priorities of service quality and cost together, for the agency. If an agency is able to specify the acceptable ratio of quality to cost, the contracting process will be much easier to reconcile. Without understanding the objectives of both parties, agencies are at a disadvantage.
After estimating the objectives of contractors, the agency must then estimate the costs of obtaining these objectives. All work performed by a contractor involves costs, both direct and indirect. Without incentives or penalties, contractors will tend to optimize the service provided in a manner that minimizes net cost or maximizes net gain. In simple theoretical fixed price contracts, this can result in operators lowering service quality to a bare minimum, while in pure cost-plus
contracts this may result in a desire to increase costs and thus profit.
Similar to the agency's dilemma, not all contractors will have clear utility functions, as objectives such as maximizing profitability while maximizing reputation may be somewhat exclusive. Additional complications arise due to the fact that contractors have a greater set of options in their
operations under contract. Modeling the diversity of these options and obtaining the proper inputs given asymmetric information, Halvorsen notes, "would be a computational nightmare" (Halvorsen 1993, 50).
The difficulty in computing true utility functions aside, a great deal can be gleaned from the study of contract economics. First, the maximum benefit from contracting is achieved when there are
competition; a smaller number of bidders results in the authority's loss of power to determine the terms of the contract and hence the benefits of competition. Furthermore, the agency, when bidding new contracts, should have in mind the objectives-- both financial and reputational-- and costs of the potential contractors. Laffont and Tirole (1986) point out that with a greater degree of asymmetric information, the agency pays higher costs for lower quality. As stated above, with increased risk-- be it in the form of a large penalties or uncertainty-- the price of contract bids increase. Optimal contracts will involve the agency bearing more risk as the contract becomes more risky.
2.2 Transport Contract Design
Service contracts can be divided into two general forms, cost-plus and fixed-price. Cost-plus contracts specify an amount (which can be either fixed or a variable percentage of costs) above the contractor's cost to be added onto the contract in the form of profit for the contractor, while fixed-price contracts have the contractor initially define the cost of the service, including their expected profit, and are free to allocate their own costs.
In theory, pure cost-plus contracts provide no direct financial incentive for the operator to lower costs. In practice, however, transport contracts usually have a "ceiling," or an upper cost limit; they are not easily amended without re-negotiation and thus the incentive to control costs remains. In any case, monitoring contractor costs needs to be an integral part of a contractual arrangement for all cost-plus contracts. The theoretical inefficiencies of cost-plus contracting in public transport were confirmed empirically by Roy and Yvrande-Billon (2007) who found that over a large multi-year panel, French operators under cost-plus contracts exhibited greater levels of inefficiency than operators under fixed-price agreements.
In addition, Halvorsen found two further factors that may have the tendency to reduce a contractor's cost in cost-plus contracts: competition in the bid process (assuming the selection criteria is based at least in part upon the bid price), and possibility of a damaged reputation for the contractor if they exceed the estimated contract total by a significant amount.
Pure fixed-price contracts provide the contractor with a great incentive to minimize costs. While this may be seen as an advantage over cost-plus contracts, it can be a detriment as well. There is no direct incentive in the most basic fixed-price contract to provide quality service; without performance regimes, fixed-price contracts can compel the contractor to drive costs down, often having negative effects on service quality.
It is for this reason that performance measurement is commonly included in the contract terms for privatized public transport provision. The implementation of these standards tends to increase both service quality and cost. In order to maintain and stimulate quality results in accordance with the measures integrated into the contracts, penalties and incentives are usually applied to the contract terms. Operators will tend to concentrate on achieving them, often at the expense of other performance factors not specified in the contract. Further information on incentives in Transport contracts can be found in section 2.4.4.
2.3 Transport Organization Regimes and Tendering
A variety of organizational forms exist for public passenger transport. In the mid- 1990s, with the entrance of new member states into the European Union, research was conducted on
organizational a framework was developed to organize the process-- the Strategic, Tactical and Operational framework (otherwise known as STO) (Macario 2001; van de Velde 1999)-- treats policy, planning and operations as three different levels:
1. The Strategic level asks the fundamental question "what do we want to achieve?" The
organization in charge at this level should also provide guidance on achieving said goals. This role is often filled by a ministry of transport;
2. The Tactical level, where the translation of the political goals to the product specification--specifically fare and service policy-- is undertaken. This role can be filled either by a local transportation agency, an outside consultant acting under the authority of the ministry of transport, or the operator themselves; and
3. The Operational level, which is purely concerned with delivering the service defined
according to the strategic and tactical levels. The operational level can further be divided into what Van de Velde refers to as "hardware," that which produces the service-km, and
"software," (such as marketing and passenger information) that helps sell service-km and transform them into passenger-km. The hardware and software may be provided by different
organizations.
In practice, a multitude of forms of organizational relationships exist between principals and agents'. Two super-types of these relationships are the market initiative regime and the authority initiative regime.
Under a market initiative regime, commercially viable services are expected to be created by market processes. The purest form of this regime is an open entry regime, where there are few or no barriers to entry and operators "compete in the street" for passengers. Pure open entry regimes are optimal only in the absence of market failures. In the case of market failures, the regime can only reach a second-best equilibrium2, although this may be considered acceptable if the costs of regulation are higher than the benefits. Possibly the most recognized and studied example of this regime is the British Bus deregulation of the 1980s (Rye and Wilson 2002). A more common arrangement under a market initiative regime is an authorization regime, where the market is still tasked with creating service, but operators have to receive the authorization of the market regulator before entry.
Authority initiative regimes, on the other hand, are common where it is believed that markets cannot create profitable services. At its most pure, authority initiative regimes involve public
management and operation of transport service. This is common within the US and some regions of Europe. More common in Europe, however, is competitive tendering (CT) for the operation' of a network or parts of a network.
The rationale behind tendering public transport is often seen as a triumph of the power of free markets. Through the competitive process, it is believed, CT results in the provision of services 1 A number of examples of these forms as practiced throughout the EU are discussed in Inno-V et al. (2008) 2 A second-best equilibrium is when "one accepts that certain direct measures are not feasible for political reasons or
could not work because of practical objections. For this reason, one falls back on measures that are not 'first choice' for realizing a general optimum, such as indirect intervention in the transport sector." While not as efficient as a theoretical first-best solution, a second-best optimum has the advantage of political feasibility (Blauwens, Baere, and Voorde 2008, 374).
3 Some areas, such as the Netherlands, have tendered responsibilities at the tactical level. For more information on see
more responsive to public needs. The profit motive presumably drives operating costs and fares lower than under public operation, and demand will increase and be adequately provided for (Karlaftis 2008). There has been some evidence that this is generally the case. In 2001, a European
Commission survey found that cities using controlled competition in public transport experienced a 1.8% increase in the annual rate of change in passenger journeys, while cities without competition logged a 0.7% decrease (Colin Buchanan and Partners 2001, 2-4). While ridership has been shown to increase under CT, a consistent decrease in subsidies are not necessarily the case. After an initial tender, subsidies in tendered services can decrease in the range of 20-30%, yet subsequent tenders deliver minimal gains in subsidy reduction. Often, these re-tenders show cost increases at levels greater than the consumer price index, in part a response to the initial winner's curse (Hensher and Wallis 2005).
2.3.1 The Regulatory Framework within the European Union and
Spain
Within Spain, interurban land transport is regulated under a framework specified by national law (the Ley de Ordenacion de los Transportes Terrestres, or LOTT). The LOTT specifies that the operation of any over-the-road passenger transport services within Spain, the operator must be licensed and hold a title or concession to the routes serviced. The most common application of these regulations is the assignment of interurban bus routes to operators by tender and concession--meaning that operators compete "for the market," and after winning a concession have the sole right to operate services along a route or package of routes. Concessions under the LOTT have a length of six to fifteen years, while established practice reflects durations between eight and twelve years. Furthermore, the LOTT allows for the duration of a contract to be extended, allowing some flexibility (Comisi6n Nacional de la Competencia 2008).
At the level of the European Union, Regulation No 1370/2007 defines how "competent authorities may act in the field of public passenger transport to guarantee the provision of services of general interest which are among other things more numerous, safer, of a higher quality or provided
at lower cost than those that market forces alone would have allowed" (Anon. 2007, 6). The method for this provision of services through concession4 is the Public Service Obligation (PSO); regulation 1370/2007 is commonly referred in the literature to as the Public Service Obligation Regulation, or PSOR. In several areas, the PSOR supersedes the regulations of the LOTT, such as the stipulation of a maximum contract duration for PSO contracts of ten years for bus passenger transport. Within these ten years, contracts may be extended by a maximum of half their initial duration - i.e. a six year contract may include the option of a three year extension.
Some of the many aspects of the PSOR are the requirements to establish in advance the following points with regards to bonuses:
1. The parameters (including incentives) on the basis of which the compensation payment, if any, is to be calculated;
2. The nature and extent of any exclusive rights granted, in a way that prevents overcompensation;
3. A specification the arrangements for the allocation of costs connected with the provision of services; and
4. To ensure that no compensation payment exceeds the amount required to cover the costs in providing the Public Service Obligations, taking account of revenue kept by the public service operator and a reasonable profit. (Anon. 2007, 7)
Throughout the duration of a contract, these four points are to be addressed yearly by the authority in an aggregated report on the public service obligations that it is responsible for, including the selected public service operators, the compensation payments and the exclusive rights granted to the public service operators by means of reimbursement (Inno-V et al. 2008a, 80).
As the PSOR oversees the procurement of public transport contracts, all contracts and tenders must follow its guidelines. It serves as the underpinning for the proposed contract structure introduced in Chapter 4.
4 "A concession, as defined by the Public Procurement Directives, being a contract where the consideration for the provision of services consists either solely in the right to exploit the service or in this right together with payment." (Inno-V et al. 2008a, 92) If an operator is to take some portion of revenue risk that agreement is defined as a concession and not as a procured service.
2.4 Quality and Performance Management
Osborne and Gaebler (1992) discuss instances where government can function as efficiently and productively as private business. Moving from seeking and funding inputs or outputs to outcomes, they argue, has improved government performance at various levels; instead of defining arbitrary goals and funding amounts, efficient governments would define goals, various levels of indicators and objectives. Furthermore, measurement should focus on results and effectiveness, not the process and efficiency. While process and efficiency may be easier to measure, they are only indications of a small part of overall policy. Building on this work, Osborne and Gaebler defined six important points that show the power and motivation of performance measurement.
- If you do not measure results, you cannot tell success from failure. - If you cannot see success, you cannot reward it.
- If you cannot see success, you cannot learn from it.
- If you cannot reward success, you are probably rewarding failure. - If you cannot recognize failure, you cannot correct it.
- If you can demonstrate results, you can win public support. (Osborne and Gaebler 1992,
143-155)
These six points provide an introduction to results-based monitoring and evaluation in the quality literature and serve to guide the following sections.
What follows is a brief and non-exhaustive overview of quality management both in general and within the transport context, structured using the points above. For further information on general theories of quality, see Kusek and Rist (2004). For further references on quality management specific to transport, refer to MAX Consortium (2007) or Vincent (2002).
2.4.1 Measuring Results In Public Transport
The International Standards Organization (ISO) defines several renowned quality standards. The ISO 9002 Standard, developed in the late 1980s and later rewritten in 1994, served as a "model for quality assurance in production, installation, and servicing." Its major focus was to avoid product defects introduced in manufacturing. IS09004 further emphasized "Total Quality Management"
(TQM), a process for satisfying the expectations of customers while increasing productivity and competitiveness, generally in the management process.
Both ISO 9002 and 9004 were integrated into and superseded by ISO 9001. Quality management, according to ISO 9001, is an integrated system centered around the concept that each organization shall define a quality system for its own necessities. This system is based upon a
framework of certain principles which an organization is to base their quality management processes on. These principles are:
- Customer focus - Leadership
- Involvement of people " Process approach
- System approach to management - Continual improvement
- Factual approach to decision making
- Mutually beneficial supplier relationships (ISO)
While these principles are laudable, they apply most directly to organizations producing tangible products and focus on production quality, not output quality-- in other words they represent the ideology that "if the hens are well cared for, they will lay good eggs." In transport, this often turns out not to be the case, as the firm's view of quality and the customer's view of quality are often very different.
A key difference between the transportation industry and other industries is that the service must be produced at the moment it is needed and cannot be warehoused - providing exceptional service overnight or in the early morning is not useful to passengers traveling during the peak hour. An example of this need to remain customer focus is as follows: if a transport organization specifies the availability of an escalator in hours, the number of customers this affects will depend on the hour in which the downtime occurs. Downtime or poor performance at peak hour will impact more customers negatively than downtime at off-peak hours. The ISO's production-focused quality model does not acknowledge either of these factors. (Liekendael 2006).
TCRP 8 (1995) set out to introduce TQM principles to the transit world. It introduced
TQM as
"a comprehensive and long-term transformational process. As a result of this process, an or-ganization moves from a traditional, outdated mode of operating to a newer, more progress-ive way of running the enterprise. Along the way, the organization learns how to change, im-prove, and evolve continuously. It does this by focusing on people first - in particular, on passengers, employees, and people in the community. Systems, procedures, structure, meas-ures, and responsibilities are transformed to support the employee's desire to serve the pas-senger and the community (MacDorman 1995)."
The principles it focused on were largely organizational, dealing with customer and labor relations and effective management. While quality measurement was discussed, it proposed neither a usable framework for performance measurement of delivered service, nor an analysis of the relationship between service quality and customer satisfaction. While both the TQM procedures discussed in TCRP 8 and in the ISO quality frameworks are important to consider in the provision of passenger transport, the discussions do not provide sufficient methods for the creation of results-based
performance regimes.
2.4.2 Seeing Success: Selecting Performance Measures
TCRP 88 (Kittleson & Associates 2003a) focused specifically on designing transit performance-measurement systems. It described three reasons why performance is measured by transport agencies:
1. Because they are required to do so;
2. Because it is useful to the agency to do so; and
3. Because others outside the agency need to know what is going on. (Kittleson & Associates 2003a, 4)
The report then considers four distinct points of view from which performance can be measured: customer, community, agency and vehicle/driver. Each point has different criteria for what is important and vital regarding the performance and delivery of service. The framework presented for contemplating the four points of view were then conceptually arranged linearly, as is seen in Figure
2.1. Designing an effective performance-measurement regime must both measure and satisfy all of these points of view.
PERFORMANCE MEASURE EXAMPLES OTransit-Auto Travel sTransfer Time
Time
*service Coverage 6Frequency *Service Denials *Hours of Service
0 Reliability 'Passenger Environment SComfort *Customer Satisfaction
C)
*Vehicle Accident Rate *Crime Rate
e Passenger Accident 0% Vehicles with Safety Rate Devices
-Road Calls *Spare Ratio *Fleet Cleaning 'Construction Impact
oRidership a Cost Efficiency
*Fleet Maintenance Cost Effectiveness
... Performance
e etImpact eMblt
hVehecle Capacity eRoadway Capacity eV fume-to- Ca pacity
Figure 2.1, TCRP 88: Transit perormance measure points of view, categories, and examples
The steps defined in TCRP 88 for developing a performance-measurement program follow. s.
Define goals and objectives. An agency's first step should be to define its goals and objectives. If a program is not well integrated with an agency's goals and objectives, the
program will be ineffective in performing its core function: measuring the system's ability to
achieve its goals and objectives.
2. Generate management support. Once the
overall goals and objectives have been
determined, those objectives should be supported by agency management. A
performance-measurement regime is not effective without the ability to take corrective action. If
management has not "bought in" to the objectives, this is unlikely to happen smoothly.
Important factors in earning management support are providing easily understood aggregate measures that can be repeated at regular intervals.3. Identify internal users, stakeholders, and constraints. It is crucial
to determine who willbe using the performance-measurement program on a regular and periodic basis.
Furthermore, the level of detail in the resulting measures will be heavily influenced by the technical and financial resources available to the agency.
4. Select performance measures and develop consensus. In order to meet the objectives specified, performance-measurement categories are selected. A review performance measures used in similar circumstances should be undertaken. Data collection constraints, as identified in step 3 are taken into account as performance measures are selected. Targets or standards for the selected measures are set in accordance with the objectives. Building consensus among the key stakeholders involved on what aspects to measure and also how to measure is also crucial.
5. Test and implement the program. A pilot is conducted to test the agency's data collection and analysis capabilities. If issues arise, alternative measures or targets can be developed.
Program responsibilities are assigned to area staff, and the program is implemented.
6. Monitor and report performance; As the program is implemented, a schedule for regular performance reporting is created. System performance is monitored according to that schedule. Results are verified for reasonableness and integrated into a report format. 7. Integrate results into agency decision-making. After the results are available, develop a
preferred approach for improving certain measures. Compare the performance results with
the goals set for each measure; for measures not meeting their goals, identify action items for improving performance. For measures consistently exceeding their goals, consider increasing the target, if cost-effective to do so.8.
Review and update the program. (Kittleson
& Associates 2003a, 68-97)On a similar, yet slightly different track, the European Union funded the QUATTRO program (1996 - 1998) in order to further focus on the distinctive nature of public passenger transport with regards to both the organizational and customer perspective. QUATTRO was tasked with developing and improving "quality in urban public transport tendering, contracting, and
monitoring procedures," and asked two fundamental questions. First, how is service quality defined in public transport? Second, how can quality concepts be included in public tendering and
contracting to improve service provided?
QUATTRO identified four types of quality in Public Transport-- expected, targeted, delivered and perceived. The definitions from the report follow.
- Expected Quality: This is the level of quality anticipated by the customer and it can be defined in terms of explicit and implicit expectations. The level of quality expected by the passenger can be defined as the sum of a number of weighted quality criteria. Qualitative and
quantitative surveys can be used to identify these criteria and to assess their relative importance. Implicit expectations can also be determined from such studies. -
Targeted
quality: This is the level of quality that the operator aims to provide to passengers. It is dependent on the level of quality expected by the passengers, external and internal pressures, budgetary constraints and competitors' performance. The targeted service can be defined in terms of the results to be attained by the system rather than in terms of process characteristics. It is made up of an identified service, a level of achievement for that service and a threshold of unacceptable performance.- Delivered Quality: This is the level of quality that is achieved on a day-to-day basis in normal operating conditions. Service disruptions, whether or not they are the fault of the operator, are taken into consideration. The relevant measurements are established using statistical and observation matrices.
- Perceived Quality: This is the level of quality perceived by passengers in the course of their journeys. However, the way passengers perceive the service depends on their previous
personal experiences with the service or with its associated services, on all the information they receive about the service - not only that provided by the company but also information coming from other sources -their personal environment, etc.; Perceived quality is therefore subject to bias. (OGM s.a. 1998, 63)
In working towards uniting the four types of quality, a "quality circle," developed by Bernard Averous of the RATP in Paris and simplified from the ideas of ISO9004, was adopted by the
QUATTRO group (Liekendael 2006). The circle (Figure 2.2) clearly defines the four areas of quality to be measured. Unlike the 4 point-of-view model presented in TCRP 88, the QUATTRO project organizes the four types of quality under two distinct frames for perception-- operator (driver and agency) and customer (passenger). On the right side of the circle, operator perspective is considered and the left side of the circle the passenger expectations are considered.
Customer Perceptions
Operator Perceptions
Expected Quality
T ree
u lt
Customer Satisfaction
Oeao
efrac
MeasurementMesrmn
Perceived Quality
Delivered Quality
Figure 2.2, QUATTRO Quality Circle. The four measures of quality integrate multiple perspectives of quality and most importantly demonstrate the relationship between the types of quality. While the perspectives of operators and customers are different, interrelationships exist between the two. In addition, this perspective allows for conceptual measurements of the gaps in service design between each of the four quality areas. The difference between expected quality and delivered quality relates to the quality improvements in areas important to customers that operators are able to influence. The difference between targeted quality and delivered quality can be considered as the representative of the efficiency of the operator's efforts to reach their targets. The difference between quality perceived and quality delivered can be considered as the degree of customer satisfaction.
2.4.3 Learning from Other Successes: Self-assessment and
Benchmarking
After understanding quality theory and the relationships between the various types of quality, and yet before an organization can begin a process of continuous improvement, it must undergo a self-assessment-- "taking a hard look at your organization and scoring it against an ideal or model".
This provides several advantages, as promoted by the European Framework for Quality Management (EFQM), including
- A rigorous and structured approach to company improvement programs; - An assessment based on facts and not on individual perceptions;
- A way to reach a coherent orientation and a consensus on the actions to undertake; - A way to integrate multiple quality management initiatives to normal company activity; - A powerful diagnostic tool; and
- Benchmarking possibilities. (EFQM Self Assessment Guidelines, as cited in OGM s.a. 1998, 102)
Common issues that arise in the transport sector during the self-assessment procedure include: - Leadership and system coordination: The allocation of responsibilities between the
different bodies involved ("Who does what?") is not always well defined and this can lead to duplications of effort. Questions to address are: "Are the available resources efficiently exploited" and "Do processes exist to manage the total system optimally"
- Policy and strategy: Strategy and transport policy are not always coordinated or integrated in time and in space. The importance of PT in mobility policy is not always well understood or well developed. The PT sector does not offer any unified image of the complementary transport modes available to the public'.
- People management: In this respect, one important issue is: "Do the workers of the PT sector receive adequate training and development opportunities?"
- Customer satisfaction: Customer satisfaction is mainly measured at the level of the operator, asking questions such as "Does the service provided by the operator fulfill the expectations of the users?", "What about the measurement of their global satisfaction at with the transport system", "What about the expectations of stakeholders, non users and of potential users". (OGM s.a. 1998, 102-103)
A more comprehensive discussion of all of these topics is found in the QUATTRO report. It is in asking these questions critically and reviewing the answers that an organization can begin the process of deciding what measures, or benchmarks are to be used.
A benchmarking regime can be established to ask and answers three fundamental questions: "where are we now?", "Where do we want to go?", and "How do we get there?" On an ongoing basis, benchmarking is intended to promote improvements across an organization by allowing the
5 While the Lurraldebus brand has created a unified image for interurban bus service in Gipuzkoa, other modes, including urban bus and commuter rail remain to be integrated. For more information on the integration process, see Gomez Gelvez (2010).
comparison of performance among that organization's units. In the longer term, it can be integrated in setting strategic goals and identifying methods for their improvement. Benchmarking is
commonly described as the systematic comparison of the performance of an organization or department in one of the following two ways.
- Other departments (in the public transport context, commonly this is thought of as other routes or garages within the system). This is commonly referred as internal benchmarking. - Other organizations in the same field. This is known as external benchmarking. (OGM s.a.
1998, 109)
External benchmarking is becoming more common primarily within large public transport
operators. As the organizations that engage in comprehensive external benchmarking are comprised of the world's largest public transport authorities6, and not smaller authorities, like those of areas such as Gipuzkoa, further references to benchmarking will refer to internal benchmarking.
The principle task in the benchmarking process is the selection and measurement of quality indicators. According to the quality circle, there are two types of measurement to be made; targeted and delivered quality are measured by a combination of "Mystery Shopping Surveys" (MSS) and "Direct Performance Measures" (DPM), while perceived and expected quality are measured using"Customer Satisfaction Surveys" (CSS). Mystery Shoppers are trained teams who objectively measure the passenger experience according to pre-determined criteria, acting as if they were regular customers traveling on the system. Direct Performance Measures are more traditional analysis of operational performance, calculated from surveys and automatically collected data. Finally, Customer Satisfaction Surveys are designed to measure the extent to which a customer believes his/her
requirements have been met.
The quality circle, introduced in Section 2.4.2, was further expanded into the European Standard EN 13816. (CEN 2002, 7) EN 13816 was created as a concise framework to implement and operationalize the recommendations of the QUATTRO project. A quality management strategy
6 The CoMET group (Vincent 2002, 51) and the International Bus Benchmarking Group (IBBG) (Randall et al. 2007) are organized to share common information such as key performance indicators among members of the group.
The members of IBBG all have over 1000 buses, and there does not appear to be any similar alliance of smaller transport operators/authorities.