HAL Id: hal-02393907
https://hal.sorbonne-universite.fr/hal-02393907
Submitted on 4 Dec 2019
HAL is a multi-disciplinary open access
archive for the deposit and dissemination of
sci-entific research documents, whether they are
pub-lished or not. The documents may come from
teaching and research institutions in France or
abroad, or from public or private research centers.
L’archive ouverte pluridisciplinaire HAL, est
destinée au dépôt et à la diffusion de documents
scientifiques de niveau recherche, publiés ou non,
émanant des établissements d’enseignement et de
recherche français ou étrangers, des laboratoires
publics ou privés.
Genome-wide strategies identify downstream target
genes of chick connective tissue-associated transcription
factors
Mickael Orgeur, Marvin Martens, Georgeta Leonte, Sonya Nassari,
Marie-Ange Bonnin, Stefan Börno, Bernd Timmermann, Jochen Hecht,
Delphine Duprez, Sigmar Stricker
To cite this version:
Mickael Orgeur, Marvin Martens, Georgeta Leonte, Sonya Nassari, Marie-Ange Bonnin, et al..
Genome-wide strategies identify downstream target genes of chick connective tissue-associated
tran-scription factors.
Development (Cambridge, England), Company of Biologists, 2018, 145 (7),
TECHNIQUES AND RESOURCES RESEARCH ARTICLE
Genome-wide strategies identify downstream target genes of
chick connective tissue-associated transcription factors
Mickael Orgeur1,2,3, Marvin Martens3, Georgeta Leonte2,4, Sonya Nassari3, Marie-Ange Bonnin3,
Stefan T. Bö rno2, Bernd Timmermann2, Jochen Hecht2,5,6,7, Delphine Duprez3,*,‡and Sigmar Stricker1,2,*,‡
ABSTRACT
Connective tissues support organs and play crucial roles in development, homeostasis and fibrosis, yet our understanding of their formation is still limited. To gain insight into the molecular mechanisms of connective tissue specification, we selected five zinc-finger transcription factors– OSR1, OSR2, EGR1, KLF2 and KLF4 – based on their expression patterns and/or known involvement in connective tissue subtype differentiation. RNA-seq and ChIP-seq profiling of chick limb micromass cultures revealed a set of common genes regulated by all five transcription factors, which we describe as a connective tissue core expression set. This common core was enriched with genes associated with axon guidance and myofibroblast signature, including fibrosis-related genes. In addition, each transcription factor regulated a specific set of signalling molecules and extracellular matrix components. This suggests a concept whereby local molecular niches can be created by the expression of specific transcription factors impinging on the specification of local microenvironments. The regulatory network established here identifies common and distinct molecular signatures of limb connective tissue subtypes, provides novel insight into the signalling pathways governing connective tissue specification, and serves as a resource for connective tissue development.
KEY WORDS: Chicken model, Limb development, Connective tissue differentiation, Extracellular matrix, Signalling pathways,
Transcription factors, Transcriptional regulatory network INTRODUCTION
Connective tissue (CT) is one of the main components of the body essential for supporting tissues and organs, in part by the production of tissue-specific extracellular matrix (ECM). The term CT gathers together an ensemble of tissues, including specialized CT (cartilage and bone), soft CT (adipose tissue and vasculature) and dense CT. Dense CT can be divided into regular CT (tendon and ligament) and irregular CT (loose CT surrounding or within organs such as muscle CT) (Nassari et al., 2017a). Regular and irregular CTs are an integral
part of the musculoskeletal system. Muscle CT is pivotal for the mechanical properties of muscle and is structurally continuous with the tendons, which finally transmit force to the skeleton. Dysregulation of CT homeostasis leads to fibrosis, which is observed during pathological tissue repair or healing processes and in cancer (Kalluri, 2016). Although fibrosis is a common research subject, normal CT formation during development remains poorly investigated.
The appendage of vertebrate embryos is an excellent model system for analysing tissue differentiation and cellular interactions during development. In limbs, cells forming the skeleton, as well as regular and irregular CTs, are derived from the lateral plate mesoderm, whereas myogenic cells originate from the somites (Chevallier et al., 1977; Christ et al., 1977). Classical embryological experiments have shown that limb patterning is dependent on lateral plate-derived CTs that provide instructive cues to guarantee correct muscle, nerve and vessel formation (Gaut and Duprez, 2016; Kardon, 1998; Lance-Jones and Dias, 1991; Michaud et al., 1997). The nature of these cues is so far mostly elusive, but it is assumed that a key role is played by specific ECM in combination with locally produced paracrine signalling factors (Hasson, 2011; Nassari et al., 2017a). Altogether, CT cells appear to be key players creating local microenvironments that contain permissive and/or instructive cues for organ patterning.
Specification, differentiation and function taken by a progenitor cell involve dramatic transcriptional and finally phenotypic changes that differ for each cell/tissue type. Lineage-specific genetic programmes ensure fine-tuning between the repression and the expression of a given set of genes in response to extrinsic and intrinsic signals at a specific location and/or at a precise time (Heinz et al., 2015). Progenitor cells are specified and induced to differentiate along a certain lineage upon activation of lineage-specific key transcription factors (TFs) that drive lineage-specific transcriptional programmes (Spitz and Furlong, 2012). As a consequence, the differentiating progenitor cells express lineage-specific genes that reinforce lineage commitment, as well as providing unique characteristics to the specific cell type and the tissue it gives rise to. Although master TFs governing cell type-specific gene expression programmes have been identified for cartilage (SOX9), bone (RUNX2) and muscle (MYF5, MYF6, MYOD) development (Braun and Gautel, 2011; Kronenberg, 2003), knowledge is sparse for dense CT. CT is mostly identified by gene/protein expression associated with CT function. Irregular CT is associated with type-III and -VI collagens, whereas regular CT (tendon/ligament) is characterized by the expression of structural and functional components such as type-I and -XII collagens or tenomodulin (TNMD) (Gaut and Duprez, 2016; Huang et al., 2015). Few TFs specific to CT lineages have been identified. Scleraxis (SCX) is to date the best marker for tendon cells; however, it is not necessary for development of most tendons (Murchison
Received 2 November 2017; Accepted 24 February 2018
1Freie Universitä t Berlin, Institute of Chemistry and Biochemistry, Thielallee 63,
14195 Berlin, Germany.2Max Planck Institute for Molecular Genetics, Ihnestr.
63-73, 14195 Berlin, Germany.3Sorbonne Universités, UPMC Univ. Paris 06, CNRS
UMR 7622, Inserm U1156, IBPS-Developmental Biology Laboratory, 9 Quai Saint-Bernard, 75005 Paris, France.4Freie Universitä t Berlin, Institute of Biology,
Königin-Luise-Str. 1-3, 14195 Berlin, Germany.5Berlin-Brandenburg Center for
Regenerative Therapies (BCRT), Charité Universitatsmedizin, Augustenburger Platz 1, 13353 Berlin, Germany.6Centre for Genomic Regulation (CRG), The
Barcelona Institute for Science and Technology, Dr. Aiguader 88, 08003 Barcelona, Spain.7Universitat Pompeu Fabra (UPF), 08002 Barcelona, Spain.
*These authors contributed equally to this work
‡Authors for correspondence (delphine.duprez@sorbonne-universite.fr;
sigmar.stricker@fu-berlin.de)
D.D., 0000-0003-0248-7417; S.S., 0000-0002-7174-5363
© 2018. Published by The Company of Biologists Ltd|Development (2018) 145, dev161208. doi:10.1242/dev.161208
DEVEL
O
et al., 2007; Schweitzer et al., 2001). Early growth response 1 (EGR1) is involved in type-I collagen production in chick and mouse developing tendons (Lejard et al., 2011). Moreover, forced expression of EGR1 is sufficient to induce the expression of tendon-associated genes in murine mesenchymal stem cells (Guerquin et al., 2013). TBX4 and TBX5 are expressed in limb irregular CT, and TCF4 (TCF7L2) is expressed in irregular CT associated with muscle, but they have no obvious role in CT differentiation (Hasson et al., 2010; Kardon et al., 2003). In contrast, odd-skipped related 1 and 2 (OSR1 and OSR2) are expressed and involved in irregular CT differentiation during chick and mouse limb development (Nassari et al., 2017b; Stricker et al., 2006, 2012; Vallecillo-García et al., 2017). Moreover, TBX4, TBX5, TCF4 and OSR1 are involved in the non-cell-autonomous regulation of muscle patterning by CT (Hasson et al., 2010; Mathew et al., 2011; Vallecillo-García et al., 2017).
Here, we present a comprehensive analysis of five selected zinger finger TFs addressing the molecular mechanisms underlying CT differentiation and function during chick limb development. OSR1/ 2 and EGR1 were chosen based on their demonstrated contribution in irregular and regular CT development, respectively. KLF2 and KLF4 (Krüppel-like factor 2 and 4) were chosen based on their expression patterns in CT associated with tendons, although their role in limb development has not yet been determined. We combined whole transcriptome sequencing (RNA-seq) and chromatin immunoprecipitation sequencing (ChIP-seq) to identify the gene regulatory programmes downstream of the five selected CT-associated TFs. This allowed us to elucidate a novel and unique regulatory network underlying CT differentiation and to identify common and specific target genes that are regulated during this process. This study furthermore provides a resource framework for future analyses of CT development.
RESULTS
Limb expression patterns of CT-associated TFs
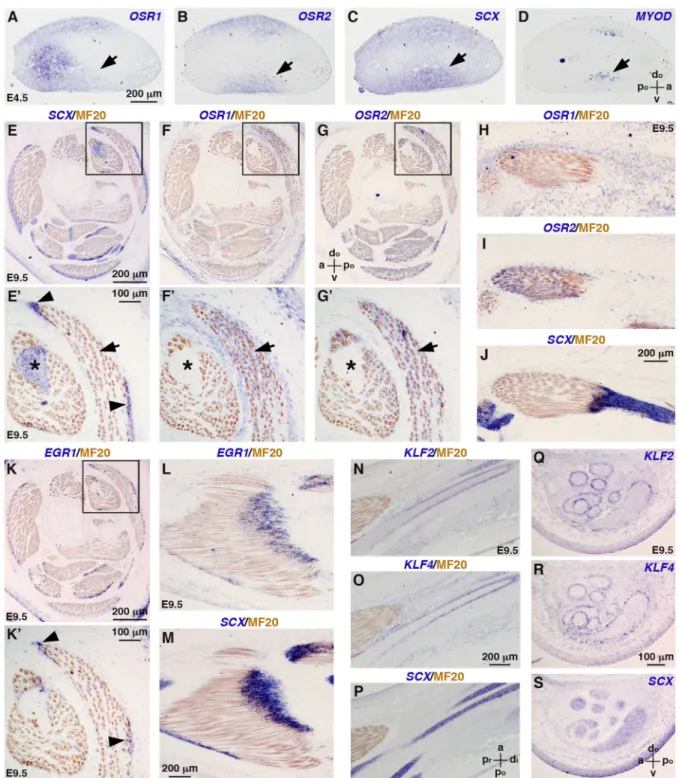
We first re-examined the gene expression patterns of the five selected CT-associated TFs in chick limbs during development. Consistent with previous observations (Stricker et al., 2006, 2012), OSR1 and OSR2 were expressed in dorsal and ventral limb regions of embryonic day (E) 4.5 chick embryos (Fig. 1A,B), overlapping in part with the expression domains of SCX and MYOD, which labelled tendon and myogenic cells, respectively (Fig. 1C,D). Although displaying overlapping domains, OSR1 and OSR2 were previously shown to be exclusive to PAX3+ and MYOD+ cells and to be partially co-expressed with SCX+cells in limbs of E4 chick embryos (Stricker et al., 2012). At E9.5, when the final pattern of the musculoskeletal system is set, OSR1 and OSR2 were not expressed in SCX+ tendons (Fig. 1E-J), but were expressed in muscle CT, interstitial to muscle fibres (Fig. 1F-I). Of note, OSR1 and OSR2 appeared to be expressed in all limb muscles, but at differing levels (Fig. 1F-G′) (Nassari et al., 2017b). OSR1 was also detected in CT surrounding individual muscles and in the dermis (Fig. 1F,F′), as has been reported for the mouse (Vallecillo-García et al., 2017). We concluded that although OSR1 and OSR2 were expressed in a subset of tendon progenitors (Stricker et al., 2012), their expression was excluded from mature tendons and became specific to irregular CT. In contrast to both OSR transcripts, EGR1, KLF2 and KLF4 were not detected in E4.5 limb buds, and were first observed in E5.5 limbs (Antin et al., 2010; Lejard et al., 2011). EGR1 was expressed in tendons, close to muscle attachments (Fig. 1E,E′,K-M), as previously described (Lejard et al., 2011), and KLF2 and KLF4 transcripts delineated SCX+ tendons of the knee of E9.5 chick embryos (Fig. 1N-S). In summary, OSR1 and OSR2 label irregular
CT, whereas EGR1, KLF2 and KLF4 are expressed in different regions of regular CT in developing chick limbs.
CT-associated TFs influence differentiation of limb mesenchymal progenitors
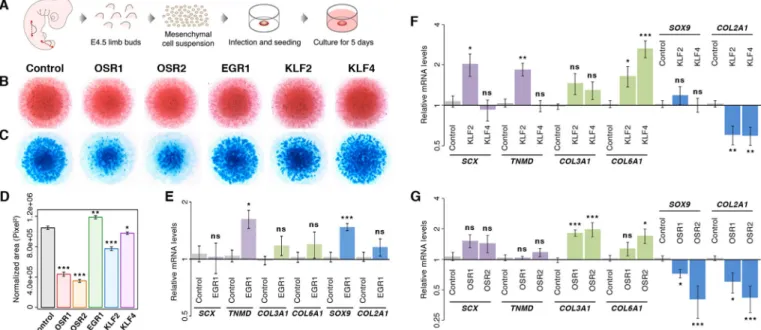
To analyse the functionality of the five TFs in relation to CT differentiation, we chose the chick micromass (chMM) explant model (Fig. 2A). In this three-dimensional culture model, limb bud cells behave close to the in vivo situation and differentiate into the mesenchymal lineages observed in native limb buds (Ahrens et al., 1979). We tested the ability of the five TFs to shift cell differentiation in chMM cultures by their overexpression with RCAS replication-competent retroviruses. This retroviral system allows for high transfection efficiency with mild overexpression of genes of interest, which has been shown to be in a physiological range compared with endogenous expression in native limb buds, and has been tested for cell differentiation, transcriptome and chromatin-binding analyses previously (Ibrahim et al., 2013). Owing to the absence of specific antibodies targeting each of the selected chicken TFs, we used the triple-FLAG (3F) tag, which was fused to the C terminus of the coding sequence (CDS) of each TF. Overexpression of the recombinant TFs was monitored by immunohistochemistry and western blot analysis against the 3F tag (Fig. S1). Although the overall morphology of the chMM cultures remained unchanged across all conditions, cartilage differentiation was affected upon TF overexpression (Fig. 2B,C). In agreement with previous observations (Stricker et al., 2012), OSR1 and OSR2 overexpression reduced chondrogenic matrix production by 58% and 67%, respectively, compared with control cultures (Fig. 2C,D). Similarly, KLF2 and KLF4 overexpression induced a reduction of cartilage nodule formation, but to a lesser extent compared with OSR1 and OSR2 (Fig. 2C,D). EGR1 was the only factor that increased chondrogenic matrix production within the chMM cultures (Fig. 2C,D). Quantitative RT-PCR analysis of transcript levels of the cartilage-associated genes SOX9 and COL2A1 confirmed the inhibitory effect of OSR1, OSR2, KLF2 and KLF4 overexpression, as well as the positive effect of EGR1 overexpression on cartilage differentiation (Fig. 2E-G). EGR1 overexpression increased the expression of the tendon differentiation marker, TNMD, but did not affect that of the irregular CT markers COL3A1 and COL6A1 (Fig. 2E). Overexpression of KLF2, but not that of KLF4, increased the expression levels of the tendon markers SCX and TNMD (Fig. 2F). Both KLF factors also increased COL6A1 expression (Fig. 2F). OSR2 overexpression increased the expression of the CT markers COL3A1 and COL6A1, whereas OSR1 overexpression only affected COL3A1 expression (Fig. 2G). In summary, overexpression of the different TFs had different effects on CT differentiation. OSR1 and OSR2 drove undifferentiated limb mesenchymal cells towards irregular CT differentiation at the expense of cartilage differentiation. EGR1 induced tendon and cartilage marker expression, but did not affect irregular CT marker expression. KLF2, but not KLF4, promoted the expression of tendon markers, whereas both KLF factors increased COL6A1 expression and decreased COL2A1 expression. In conclusion, all five TFs proved to be functional in this model in that they produced an effect on CT cell differentiation.
Transcriptome analysis reveals similar regulatory functions between CT-associated TFs
To gain insight into the regulatory functions of the five TFs, transcriptome analysis was performed by RNA-seq of two independent biological replicates of 5-day chMM cultures
TECHNIQUES AND RESOURCES Development (2018) 145, dev161208. doi:10.1242/dev.161208
DEVEL
O
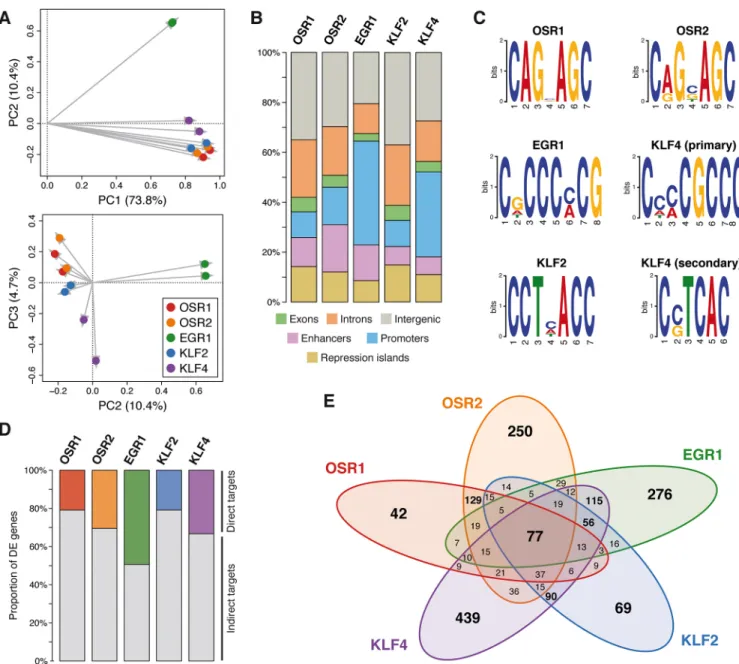
overexpressing each of the TFs. Principal components analysis (PCA) and hierarchical clustering of the Euclidean distances on global gene expression profiles revealed a separation between the TF-overexpressing chMM cultures (Fig. 3A, Fig. S2). Consistent with their similar expression domains in irregular CT, the gene
expression profiles induced upon OSR1 and OSR2 overexpression were grouped together. In contrast, the gene expression profiles retrieved upon overexpression of the tendon-related TFs EGR1, KLF2 and KLF4 were gathered together in a second group. Consistent with their distinct expression domains associated with
Fig. 1. Endogenous expression of CT-associated TFs in hindlimbs of chick embryos. (A-D) In situ hybridization to hindlimbs of E4.5 chick embryos. Adjacent and transverse limb sections were hybridized with OSR1 (A), OSR2 (B), SCX (C) and MYOD (D) probes (blue). Areas of overlapping expression are indicated by arrows. (E-S) In situ hybridization to hindlimbs of E9.5 chick embryos followed by immunohistochemistry with the MF20 antibody (brown), which recognizes skeletal muscle myosins. (E-G′,K,K′) Adjacent transverse limb sections were hybridized with SCX (E,E′), OSR1 (F,F′), OSR2 (G,G′) and EGR1 (K,K′) probes (blue). E′,F′,G′,K′ are higher magnifications of the boxed areas in E,F,G,K, respectively. Arrows indicate OSR1 and OSR2 overlapping expression domains that are exclusive to SCX expression domains (asterisks). Arrowheads indicate EGR1 and SCX overlapping expression domains. (H-J) Adjacent longitudinal limb sections were hybridized with OSR1 (H), OSR2 (I) and SCX (J) probes (blue). (L,M) Adjacent longitudinal limb sections were hybridized with EGR1 (L) and SCX (M) probes (blue). (N-S) Adjacent longitudinal (N-P) or transverse (Q-S) limb sections were hybridized with KLF2 (N,Q), KLF4 (O,R) and SCX (P,S) probes (blue). a, anterior; di, distal; do, dorsal; po, posterior; pr, proximal; v, ventral.
TECHNIQUES AND RESOURCES Development (2018) 145, dev161208. doi:10.1242/dev.161208
DEVEL
O
tendons, KLF2 and KLF4 profiles were more similar to each other than to EGR1. In summary, the gene expression profiles retrieved in the chMM cultures are in line with the limb expression patterns of the five TFs in the different CT subtypes.
We identified between 1369 and 2907 differentially expressed (DE) genes for each TF-overexpressing culture compared with control cultures (Fig. S3), resulting in a total of 10,712 DE genes for all TFs that corresponded to 4298 non-redundant genes (Fig. 3B, Table S1). While 1487 (34.6%) DE genes were specific to a single TF, 2811 (65.4%) DE genes were shared by at least two TFs (Fig. 3B). In addition, 726 (16.9%) DE genes were identified in all TF-overexpressing culture conditions (Fig. 3B). This indicates that the five TFs share a core of common regulatory targets, despite being expressed in distinct CT subtypes (SuperExactTest, P<10−10). When performing a fold-change comparison (i.e. whether the gene is upregulated or downregulated), only 48 (1.7%) DE genes that were shared by at least two TFs were identified as being regulated in opposite directions between the subset of TFs misregulating them (Fig. S4). Therefore, the TFs were similar not only in the genes they regulated, but also in the manner these genes were affected.
Based on their expression patterns across all culture conditions, the 4298 non-redundant DE genes were clustered using K-means and partitioned into eight groups (Fig. 3C, clusters I-VIII). Gene ontology (GO) analysis was then performed to identify potential biological processes enriched within each cluster (Fig. 3D). Genes downregulated by all five TFs were mainly involved in protein localization, ion transport and metabolic processes (Fig. 3C,D, cluster I). Genes upregulated by all five TFs were related to metabolic processes, gene expression, cellular component organization and several GO terms associated with the regulation of cell signalling and communication (Fig. 3C,D, cluster VIII). Clusters II, III, IV and V corresponded to genes upregulated specifically by one TF or by two closely related paralogous TFs (OSR1/OSR2 or KLF2/KLF4) (Fig. 3C). Genes in these clusters
were mainly enriched for cell differentiation, mesoderm development, cell signalling/communication and biological/cell adhesion (Fig. 3D). Genes downregulated upon OSR1 and OSR2 overexpression were enriched for biological processes related to chondrogenesis (Fig. 3C,D, cluster VI), which was consistent with their anti-chondrogenic effect in chick cell cultures (Fig. 2C,D,G) (Stricker et al., 2012). In summary, the five CT-associated TFs differentially regulate the expression of genes mainly related to cell differentiation, signalling and adhesion. Thereby, they show a significant degree of overlapping regulatory function despite belonging to distinct CT subtypes.
Molecular signatures downstream of the five TFs
Given that a high proportion of genes upregulated by the selected CT-associated TFs was involved in signal transduction and biological adhesion, we performed a signalling pathway enrichment analysis on the complete set of DE genes identified for each TF. Of particular interest, signalling pathways related to ECM components, such as integrin and cadherin signalling pathways, Wnt signalling, CCKR signalling and angiogenesis were enriched across all five TFs (Fig. 4A). Additional pathways were specifically enriched by a subset of TFs. The TGFβ signalling pathway was identified upon overexpression of OSR1, OSR2 and KLF2, whereas the Notch signalling pathway was enriched for both KLF2 and KLF4 DE genes (Fig. 4A). ‘Axon guidance mediated by netrin’ and ‘cytoskeletal regulation by Rho GTPase’ pathways were enriched in both OSR1-and OSR2-associated DE genes (Fig. 4A). When comparing the average fold change across all TFs for each DE gene, it appeared that DE genes within each aforementioned pathway were significantly upregulated (Fig. 4B, median log2 fold change close to 1; Wilcoxon rank-sum test, P<0.05). This tendency was not observed for the remaining non-DE genes associated with these signalling pathways (Fig. 4C, median log2 fold change close to 0). Nevertheless, a proportion of DE genes appeared to be downregulated for the integrin
Fig. 2. Differentiation of limb mesenchymal cells following TF overexpression. (A) Chick mesenchymal cells were isolated from E4.5 limb buds and cultured at high density for 5 days. (B) Eosin staining of TF-overexpressing chMM cultures. (C) Alcian Blue staining of cartilage nodules formed in TF-overexpressing chMM cultures. (D) Quantification of chondrogenic matrix production upon overexpression of the indicated TFs. Mean±s.e.m.; *P<0.05, **P<0.01, ***P<0.001 ( paired Student’s t-test). (E-G) Quantitative RT-PCR analysis of CT marker gene expression upon overexpression of EGR1 (E), KLF2 or KLF4 (F) and OSR1 or OSR2 (G) in chMM cultures. Graphs depict relative mRNA levels of SCX and TNMD (tendon markers), COL3A1 and COL6A1 (irregular CT markers), and SOX9 and COL2A1 (cartilage markers). Mean±s.e.m.; ns, non-significant; *P<0.05, **P<0.01, ***P<0.001 (two-tailed Mann–Whitney U-test).
TECHNIQUES AND RESOURCES Development (2018) 145, dev161208. doi:10.1242/dev.161208
DEVEL
O
and TGFβ signalling pathways (Fig. 4B, lower whiskers). This corresponded to a set of genes mainly repressed by both OSR factors (Fig. S5). Most of these genes encode collagens and BMP/GDF signalling molecules associated with cartilage and bone development, which is consistent with the anti-chondrogenic function of OSR1 and OSR2 (Fig. 2C,D,G) (Stricker et al., 2012). In agreement with the signalling pathway enrichment analysis, an
over-representation test on the 4298 non-redundant DE genes highlighted ECM, membrane and cytoskeleton cellular components (Fig. 4D). Altogether, gene expression profiling of chMM cultures overexpressing each TF supports a core of common regulatory functions across all TFs related to cell signalling, communication and ECM-based cell adhesion. In addition, each TF (or paralogous TFs) also appears to be involved in regulation of individual signalling
Fig. 3. Gene expression profiles in chMM cultures upon overexpression of CT-associated TFs. (A) PCA analysis of global gene expression profiles of TF-overexpressing chMM cultures. Each point represents the global gene expression profile retrieved in chMM cultures upon overexpression of each TF or no recombinant protein as control. (B) Venn diagram of the 4298 non-redundant DE genes detected across all TF-overexpressing chMM cultures. (C) Gene clusters identified by K-means partitioning on the 4298 non-redundant DE genes. (D) GO analysis for biological processes of the DE genes belonging to each K-means cluster. GO terms related to cell differentiation and development are depicted in green, cell signalling and communication in red, biological and cell adhesion in blue. Clusters having no significant enrichment for the specified GO terms are depicted in grey.
TECHNIQUES AND RESOURCES Development (2018) 145, dev161208. doi:10.1242/dev.161208
DEVEL
O
pathways, which could contribute to create a local microenvironment related to each CT subtype.
Establishing a regulatory chromatin map of the chMM system
We then explored the chromatin landscape of the chMM system by building a comprehensive map of promoter and enhancer regulatory domains. ChIP-seq was performed in two independent biological replicates of 5-day chMM cultures overexpressing no recombinant protein, corresponding to the control conditions used for RNA-seq, to reveal the unbiased chromatin landscape independently of TF overexpression. Mono-, bi- and tri-methylation of H3K4 (H3K4me1/2/3) were assessed to identify promoter and enhancer domains, while H3K27ac and H3K27me3 were used to distinguish between regions of transcriptional activity and facultative heterochromatin, respectively (Fig. S6A) (Kim and Shiekhattar, 2015). This identified 20,427 promoters and 55,597 enhancers (Fig. S6B,C). Surprisingly, we observed a globally decreased enrichment of active chromatin marks H3K4me3 and H3K27ac compensated by an increased signal of the repressive mark H3K27me3 at the transcriptional start site (TSS) positions of DE genes, compared with their genome-wide levels or a set of randomly selected genes of similar size (Fig. 5A-C). This suggested the existence of bivalent promoter domains, which are known to be enriched in lineage-regulatory genes (Mikkelsen et al., 2007).
Consistent with this, DE genes were more significantly associated with bivalent promoter domains at their TSS positions than randomly selected genes, regardless of their similar gene expression levels (Fig. 5D,E, left panels, white curve; Fisher’s exact test, P<10−10). By separating H3K4me3 (active and bivalent promoters) and H3K27me3 (bivalent promoters only) signals, it appeared that the H3K4me3 active mark was overall less enriched at the TSS positions of DE genes than randomly selected genes (Fig. 5D,E, middle panels), whereas the H3K27me3 repressive mark displayed an opposite distribution (Fig. 5D,E, right panels). Although we cannot exclude the possibility that the increased ratio between repressive and active signal at promoters of genes affected by TF overexpression may reflect regulatory dynamics in the different cell populations (Hong et al., 2011), bivalent promoter domains suggest that DE genes are overall dynamically regulated and likely to be associated with CT differentiation and subtype-specific function, as opposed to housekeeping and ubiquitous genes that would be active and expressed across all cell types in limb cultures.
Genome-wide CT-associated TF occupancy indicates a common regulatory core and distinct functions
To clarify the molecular mechanisms downstream of each TF, we aimed to investigate their genome-wide binding profile. ChIP-seq
Fig. 4. Signalling signature enrichment analysis of DE genes. (A) Panther pathways over-represented within the DE genes detected upon overexpression of each TF in chMM cultures. DE genes having no enrichment for the specified Panther pathway are depicted in grey. (B,C) Global expression levels of DE genes (B) and non-DE genes (C) belonging to the selected Panther pathways. Log2 fold changes of each gene were averaged across all chMM culture conditions and replicates. Each box represents the first, second (median) and third quartiles of the average log2 fold changes; top and bottom whiskers indicate the maximum and minimum values, respectively. Number of genes (n) in each Panther pathway is indicated at the bottom of each box. P-values ( paired Wilcoxon rank-sum test) are indicated at the top of each box. (D) Cellular component GO analysis of the 4298 non-redundant DE genes. Number and percentage of DE genes enriched within each GO term are indicated in parentheses.
TECHNIQUES AND RESOURCES Development (2018) 145, dev161208. doi:10.1242/dev.161208
DEVEL
O
was performed in two independent biological replicates of 5-day chMM cultures overexpressing each of the TFs by using an antibody directed against the 3F tag (Fig. S1). Similarity across all ChIP-seq signal profiles was assessed across the genome in 500-bp non-overlapping windows by PCA. Comparison of the three first principal components partitioned the TF signal profiles by biological replicates and TF subgroups (Fig. 6A), indicating that paralogous TFs (OSR1/OSR2 and KLF2/KLF4) had a similar distribution across the genome. Following peak calling, 95,884 TF binding sites (TFBSs) were identified (OSR1, 20,983; OSR2, 22,403; EGR1, 16,627; KLF2, 21,352; and KLF4, 14,519), corresponding to ten times as many DE genes. To assess TFBS functionality, binding locations identified for each TF were intersected with the regulatory domains. We focused on TFBSs contained within promoters and enhancers, because we considered that binding events located in these regulatory domains likely contributed to the regulation of gene expression. Out of the 95,884 binding sites identified across all TFs, 31,289 (32.6%) overlapped promoter and enhancer regions, corresponding to 3819-9291 (17.9%-55.9%) binding events for each TF (Fig. 6B). De novo motif analysis was then performed on the 1000 most significant binding sites for each TF. Recognition motifs identified for OSR1 and OSR2 were very similar and highly conserved with their known binding motifs in the fruit fly and the mouse (Fig. 6C) (Badis et al., 2009; Meng et al., 2005). In agreement with previous reports, EGR1 and KLF4 binding motifs were enriched in cytosine and guanine (Fig. 6C) (Badis et al., 2009; Chen et al., 2008). The KLF2 recognition motif was highly consistent with the core binding sequence of the KLF protein family and was similar to the KLF4
secondary motif (Fig. 6C) (Sunadome et al., 2011). Both binding motifs identified for KLF4 could contribute to its regulatory pattern observed in limb cell cultures, considering the 767 DE genes specifically identified for KLF4 and the 1866 DE genes shared between KLF4 and KLF2 (Fig. 3B).
Investigation of the genome-wide TF occupancy within promoters and enhancers revealed a consistency with the regulatory profiles retrieved from the RNA-seq data and the analogous recognition motifs. While 62.0% of binding regions were specific to a single TF, 38.0% were shared by at least two TFs and 5.9% were common to the five TFs (Fig. S7A; SuperExactTest for the 5-TFs occupancy, P<10−10). Closer investigation revealed that OSR1/OSR2 and EGR1/KLF4 tended to bind preferentially at similar regions (Fig. S7B-E; Fisher’s exact test, P<10−8), whereas KLF2 did not display any preferential binding with any of the other TFs, including KLF4 (Fig. S7F). We hypothesized that the genome-wide binding of KLF4 was mainly influenced by its primary binding motif, which resembles the EGR1 recognition motif (Fig. 6C). To distinguish between indirectly and directly regulated genes, TFBSs located within regulatory domains were intersected with the 4298 DE genes identified from the RNA-seq data by investigating regions spanning from 10 kb upstream of the gene TSS to 10 kb downstream of the gene 3′ end. This resulted in the identification of 3210 genes that were potentially directly regulated by the TFs (Table S1). The proportion of putative direct targets ranged from 20.9% (OSR1, 417; KLF2, 449) to 49.4% (EGR1, 677), depending on the TF (Fig. 6D). Consistent with the previous observations that the TFs shared common regulatory patterns in addition to their own specificity, the 3210 genes considered as
Fig. 5. Chromatin landscape in chMM cultures. (A-C) Normalized mean histone ChIP-seq signal surrounding the TSS of all genes (A), DE genes (B) and randomly selected genes (C). (D,E) Distribution of active (blue) and bivalent (red) promoter domains at the TSS of DE genes (D) and randomly selected genes (E). H3K4me3 (blue) signal is present in active and bivalent promoter domains, whereas H3K4me3 (red) signal is only detected in bivalent promoter domains. Intervals with a main regulatory domain being different from active and bivalent promoter are depicted in grey. Genes were ordered according to their expression levels (white curve).
TECHNIQUES AND RESOURCES Development (2018) 145, dev161208. doi:10.1242/dev.161208
DEVEL
O
potential direct targets corresponded to 1858 non-redundant genes (Fig. 6E). While 1076 (57.9%) genes were directly regulated by a single TF, 782 (42.1%) genes were shared by at least two TFs, including 77 (4.1%) genes common to all TFs (Fig. 6E; SuperExactTest for the 5-TFs direct targets, P<10−10). Consistent with their high number of shared target genes, OSR1/OSR2, EGR1/ KLF4 and KLF2/KLF4 tended to occupy similar binding locations in the vicinity of their common target genes (Fig. S8; Fisher’s exact test, P<10−4). Altogether, the binding profiles of CT-associated TFs reflect their specificity and similarity with regard to their regulatory patterns observed at the gene expression level.
Validation of selected target genes
Co-expression of a TF and its putative target gene is a prerequisite for transcriptional regulation. Therefore, we compared the expression domains of the TFs with those of selected candidate genes in chick
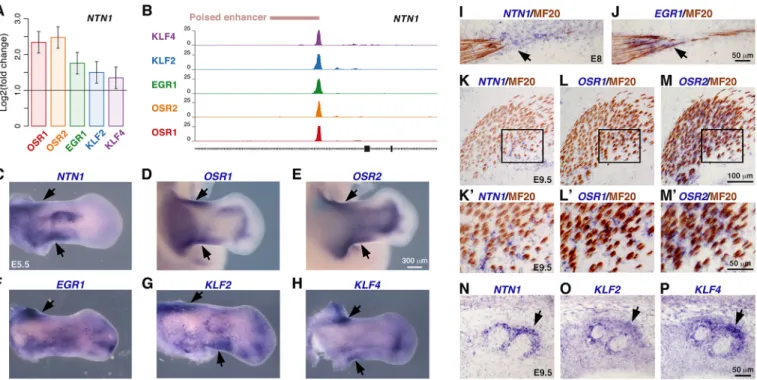
limbs. NTN1 (netrin 1) was one of the genes that was upregulated in limb cell cultures upon overexpression of each TF (Fig. 7A, Fig. S9A, Table S1), through binding within an intronic enhancer (Fig. 7B). NTN1 encodes a laminin-related secreted protein involved in axon guidance (Dominici et al., 2017; Serafini et al., 1996). In E5.5 chick embryos, NTN1 was expressed in both limb stylopod and zeugopod, displaying overlapping expression domains with those of all five TFs (Fig. 7C-H). At E8, NTN1 was expressed in tendons, overlapping with the EGR1 expression domain close to muscle attachment (Fig. 7I,J). NTN1, OSR1 and OSR2 expression was observed in muscle CT at E9.5 (Fig. 7K-M′). In addition, NTN1 transcripts were detected in tissues delineating tendons at E9.5, similarly to KLF2 and KLF4 transcripts (Fig. 7N-P).
Given the similar regulatory profiles of OSR1 and OSR2, we also selected WNT11, a common target gene of both TFs. WNT11 encodes a secreted component of the non-canonical Wnt planar cell
Fig. 6. Regulatory patterns of CT-associated TFs. (A) PCA analysis of the normalized ChIP-seq signal profiles of all TFs and biological replicates. Each point represents the genome-wide binding profile of each TF and biological replicate; grey arrows indicate the projections from the origin. (B) Proportion of TFBSs in the indicated chromatin domains and gene features. (C) TF recognition motifs. (D) Proportion of direct and indirect target genes of each TF in chMM cultures. (E) Venn diagram of the 1858 non-redundant direct target genes detected across all TF-overexpressing chMM cultures.
TECHNIQUES AND RESOURCES Development (2018) 145, dev161208. doi:10.1242/dev.161208
DEVEL
O
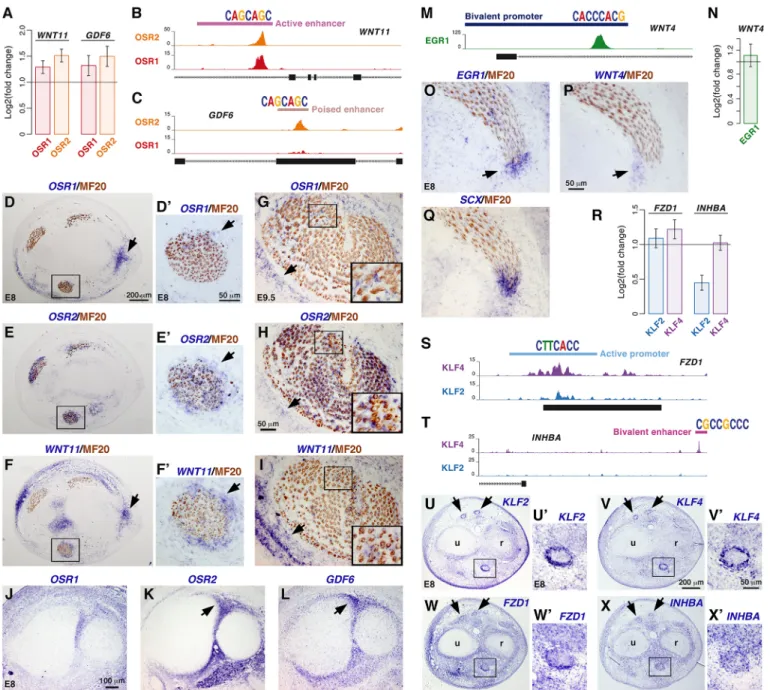
polarity pathway (Gao, 2012), which is involved in regulating muscle fibre type and orientation (Anakwe et al., 2003; Gros et al., 2009). Both OSR factors increased WNT11 expression in chMM cultures and bound at the same location within an intronic enhancer (Fig. 8A,B, Fig. S9B, Table S1). In E5.5 chick embryos, WNT11 was expressed in limb mesenchyme, consistent with OSR1 and OSR2 expression patterns (Fig. S9C-E). At E8 and E9.5, WNT11 transcripts were detected in irregular CT within and surrounding muscles, overlapping with OSR1 and OSR2 transcripts (Fig. 8D-I). An additional target gene, GDF6, which encodes a secreted signalling factor of the TGFβ superfamily (Settle et al., 2003), was upregulated upon overexpression of OSR1 and OSR2 in chMM cultures (Fig. 8A, Fig. S9B, Table S1). However, only a binding site for OSR2 was detected in the vicinity of GDF6, indicating that OSR1 was not directly involved in the regulation of GDF6 expression (Fig. 8C). In limbs of E5.5 and E8 chick embryos, GDF6 expression domains overlapped with those of OSR2 (Fig. 8J-L, Fig. S9D,F). In addition to OSR2 expression in muscle CT, we observed OSR2 transcripts in limb myosin+cells at E9.5 (Fig. 8H) (Nassari et al., 2018 preprint). Consistent with this, we identified FHL1 (four and a half LIM domains 1) among the OSR2 direct target genes (Fig. S10A,B). FHL1 was expressed in CT at E8 (Fig. S10C,D) and in both muscle CT and fibres at E9.5 (Fig. S10E,E′). Interestingly, mutations in FHL1 are causative for various rare X-linked myopathies (for example, see Gueneau et al., 2009).
As a specific target gene of EGR1, we selected WNT4, which encodes a secreted member of the canonical Wnt signalling pathway (DiRocco et al., 2013). WNT4 was upregulated upon EGR1 overexpression in chMM cultures and was associated with an EGR1-binding site in its promoter region (Fig. 8M,N, Fig. S9G, Table S1). This is consistent with previous findings where EGR1 has been shown to bind upstream of the Wnt4 gene in the
uterine endometrium during mouse pregnancy (Liang et al., 2014). EGR1 and WNT4 displayed overlapping expression domains in proximal regions of forelimbs of E5.5 chick embryos (Fig. S9H,I) and in tendons, close to muscle attachment, in E8 limbs (Fig. 8O-Q).
Given the common regulatory patterns of both KLF factors, we selected FZD1, which encodes a frizzled class receptor of Wnt signalling proteins (Laeremans et al., 2010). FZD1 was upregulated upon overexpression of KLF2 and KLF4 in chMM cultures (Fig. 8R, Fig. S9J, Table S1) and harboured a binding site for both KLF factors within its promoter region (Fig. 8S). In E8 chick embryos, FZD1 was expressed in tissues delineating tendons, overlapping with the expression domains of KLF2 and KLF4 (Fig. 8U-W′). Considering that KLF4 also displayed a distinct regulatory profile (Fig. 6E), we selected INHBA, which encodes the inhibin beta A subunit, a member of the TGFβ signalling pathway (Howley et al., 2016). INHBA was upregulated upon KLF4 overexpression in chMM cultures (Fig. 8R, Fig. S9J, Table S1). In addition, a KLF4-binding site was located within an enhancer upstream of the TSS position of INHBA (Fig. 8T). In chick limbs, INHBA and KLF4 displayed overlapping expression domains at E5.5 and in tissues delineating tendons at E8 (Fig. 8V,V′,X,X′, Fig. S9K-M). Altogether, the selected target genes and their related CT-associated TFs exhibit overlapping expression domains in chick limbs.
Common and divergent signalling/ECM signatures regulated by the CT-associated TFs
It is generally assumed that CT cells shape their microenvironment mainly by production of signalling/ECM molecules and/or via remodelling of the ECM. To explore how this feature could be guided by the CT subtype-specific TFs, we built a regulatory
Fig. 7.NTN1 is a common target gene to the five CT-associated TFs. (A) NTN1 expression levels in TF-overexpressing chMM cultures determined by RNA-seq. Mean±s.e.m. (B) Binding site for the five TFs identified by ChIP-seq within an intronic enhancer of the NTN1 gene. (C-H) Whole-mount in situ hybridization to hindlimbs of E5.5 chick embryos with NTN1 (C), OSR1 (D), OSR2 (E), EGR1 (F), KLF2 (G) and KLF4 (H) probes (blue). (I-P) In situ hybridization to forelimbs of E8 (I,J) and E9.5 (K-P) chick embryos followed by immunohistochemistry with the MF20 antibody (brown). (I,J) Adjacent longitudinal limb sections were hybridized with NTN1 (I) and EGR1 (J) probes (blue). (K-P) Adjacent transverse limb sections were hybridized with NTN1 (K,K′,N), OSR1 (L,L′), OSR2 (M,M′), KLF2 (O) and KLF4 (P) probes (blue). K′,L′,M′ are higher magnifications of the boxed areas in K,L,M, respectively. Areas of overlapping expression are indicated by arrows.
TECHNIQUES AND RESOURCES Development (2018) 145, dev161208. doi:10.1242/dev.161208
DEVEL
O
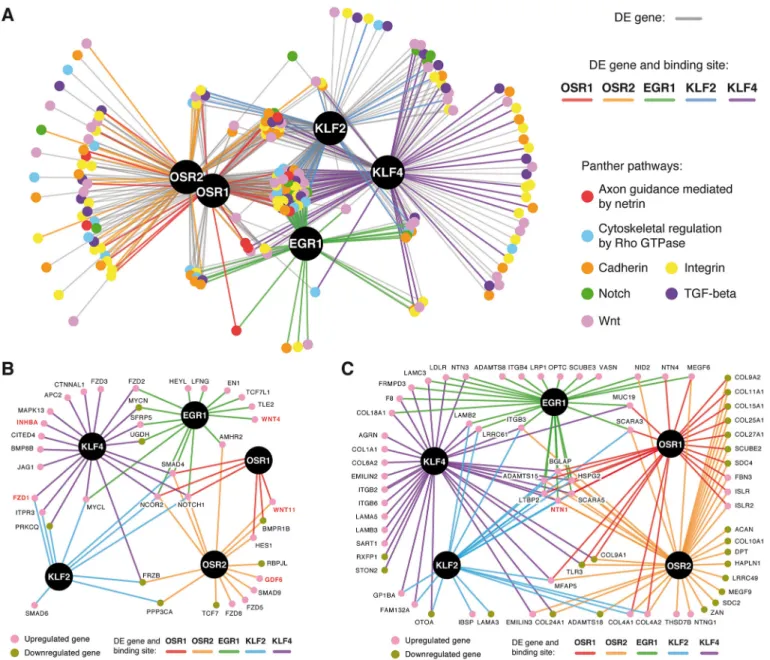
network on the 189 DE genes that were associated with seven of the previously identified signalling pathways (Fig. 4A,B, Table S1). The resulting transcriptional network was composed of 513 interactions divided between 175 (34.1%) direct and 338 (65.9%) indirect connections (Fig. 9A). This network highlighted common and unique features for the CT-associated TFs. Thirty-eight (20.1%)
genes were regulated by all five TFs, revealing a CT-typical signalling signature, whereas 47 (24.9%) genes were exclusively shared by paralogous TFs (OSR1/OSR2 and KLF2/KLF4) and 45 (23.8%) genes were specific to a single TF (Fig. 9A, Table S1). The regulatory network was then subdivided for each individual TF to visualize the molecular interplay of each TF on selected
Fig. 8. Selection of target genes encoding signalling molecules downstream of the five CT-associated TFs. (A) WNT11 and GDF6 expression levels in OSR1- and OSR2-overexpressing chMM cultures determined by RNA-seq. Mean±s.e.m. (B) Binding site and motif for OSR1 and OSR2 identified by ChIP-seq within an intronic enhancer of the WNT11 gene. (C) Binding site and motif for OSR2 identified by ChIP-seq within an exonic enhancer of the GDF6 gene. (D-I) In situ hybridization to forelimbs of E8 (D-F′) and E9.5 (G-I) chick embryos followed by immunohistochemistry with the MF20 antibody (brown). Adjacent and transverse limb sections were hybridized with OSR1 (D,D′,G), OSR2 (E,E′,H) and WNT11 (F,F′,I) probes (blue). D′,E′,F′ are higher magnifications of the boxed areas in D,E,F, respectively. Insets in G-I are magnifications of the boxed areas. (J-L) In situ hybridization to adjacent transverse forelimb sections of E8 chick embryos with OSR1 (J), OSR2 (K) and GDF6 (L) probes (blue). (M) Binding site and motif for EGR1 identified by ChIP-seq within the promoter of the WNT4 gene. (N) WNT4 expression levels in EGR1-overexpressing chMM cultures determined by RNA-seq. Mean±s.e.m. (O-Q) In situ hybridization to adjacent transverse forelimb sections of E8 chick embryos with EGR1 (O), WNT4 (P) and SCX (Q) probes (blue) followed by immunohistochemistry with the MF20 antibody (brown). (R) FZD1 and INHBA expression levels in KLF2- and KLF4-overexpressing chMM cultures determined by RNA-seq. Mean±s.e.m. (S) Binding site and motif for KLF2 and KLF4 identified by ChIP-seq within the promoter of the FZD1 gene. (T) Binding site and motif for KLF4 identified by ChIP-seq within an enhancer located upstream of the INHBA gene. (U-X′) In situ hybridization to adjacent transverse forelimb sections of E8 chick embryos with KLF2 (U,U′), KLF4 (V,V′), FZD1 (W,W′) and INHBA (X,X′) probes (blue). U′,V′,W′,X′ are higher magnifications of the boxed areas in U,V,W,X, respectively. Areas of overlapping expression are indicated by arrows. r, radius; u, ulna.
TECHNIQUES AND RESOURCES Development (2018) 145, dev161208. doi:10.1242/dev.161208
DEVEL
O
signalling pathways (Figs S11-S15). For instance, the Wnt signalling pathway was differently affected depending on the TF, with different sets of WNT ligand and FZD receptor genes regulated by each TF (Figs S11-S15).
To reduce complexity, we then focused on the Notch, TGFβ and Wnt signalling pathways (Fig. 9B). Key components of these signalling pathways, NOTCH1 (Notch receptor) and SMAD4 (TGFβ signalling transducing protein) were regulated by all five TFs (Fig. 9B, Table S1). By contrast, other genes were regulated by a subset of TFs. For instance, WNT11 and BMPR1B (BMP receptor) were specific to OSR1 and OSR2, whereas FZD1 and PRKCQ ( protein kinase C theta) were regulated exclusively by both KLF factors (Fig. 9B, Table S1). Lastly, we found genes that were specific to a single TF. This is the case for GDF6 and SMAD9 directly upregulated by OSR2, WNT4 and TCF7L1 (TCF3) directly
upregulated by EGR1, and INHBA and BMP8B (BMP secreted ligand) directly upregulated by KLF4 (Fig. 9B, Table S1). Altogether, this regulatory network identifies signalling genes that are likely to contribute to the biological function of all CTs or CT subtypes.
Finally, by focusing on direct target genes associated with the ECM, we found that the TFs regulated distinct, but partly overlapping, molecular ECM niches (Fig. 9C, Table S1). ADAMTS15, for example, was directly upregulated by the five TFs and ADAMTS8 was specific to EGR1, whereas ADAMTS18 was directly downregulated by OSR2 and KLF2 (Fig. 9C, Table S1). ADAMTS proteins are secreted metalloproteases with a thrombospondin type-I motif that are involved in procollagen processing (Apte, 2009). Whereas ADAMTS15 and ADAMTS8 have proteoglycanolytic activity (Apte, 2009), mutations in
Fig. 9. Regulatory networks of CT-associated TFs. (A) Transcriptional regulatory network of the CT-associated TFs (black nodes) and their target genes related to the indicated signalling pathways (coloured nodes). Coloured connections correspond to direct interactions between the TFs and their target genes (DE genes and TFBSs), indirect interactions are depicted in grey (DE genes only). (B) Network representation of the 38 target genes associated with the Notch, TGFβ and Wnt signalling pathways (coloured nodes) that are directly regulated by the TFs (black nodes). (C) Network representation of the 70 target genes associated with the ECM (coloured nodes) that are directly regulated by the TFs (black nodes). Genes in red correspond to the selected target genes investigated by in situ hybridization.
TECHNIQUES AND RESOURCES Development (2018) 145, dev161208. doi:10.1242/dev.161208
DEVEL
O
ADAMTS18 have been associated with bone disorders (Wei et al., 2014). In addition, CT-associated TFs appeared to mediate collagen deposition by directly regulating genes encoding collagenα-chains. COL4A1 and COL4A2 were directly upregulated by OSR1, OSR2 and KLF2 (Fig. 9C, Table S1). Type-IV collagen contributes to the assembly of basal lamina by binding to laminins (Mouw et al., 2014). By contrast, COL9A1, COL9A2 and COL11A1 were directly downregulated by OSR1 and OSR2 (Fig. 9C, Table S1). Type-IX and -XI collagens are known to form a network with type-II collagen in cartilaginous ECM (Fernandes et al., 2003). KLF4 directly promoted the expression of COL1A1 (Fig. 9C, Table S1). Type-I collagen fibrils are the main component of tendons (Gaut and Duprez, 2016). The ECM also acts as a source of developmental signals by sequestering and diffusing paracrine factors. The TFs appeared to mediate directly the positive expression of genes encoding laminin-related secreted netrins, such as NTN1 (all five TFs), NTN3 (EGR1 and KLF4), NTN4 (OSR1 and EGR1) and NTNG1 (OSR2) (Fig. 9C, Table S1). In conclusion, the CT-associated TFs contribute to provide distinct local patterning cues by mediating the expression of specific environmental molecules.
DISCUSSION
The transcriptional network downstream of five CT-associated zinc finger TFs presented here identifies common and specific molecular signatures involved in limb CT specification. TF overexpression led to transcriptional changes in limb cells impacting on numerous cellular processes, including cell-cell/cell-matrix adhesion, cell communication and migration. Consistently, genes encoding signalling molecules, ECM components and cytoskeletal proteins appeared to be regulated by the five TFs.
A core molecular network downstream of the five TFs
Among the 4298 non-redundant DE genes upon overexpression of the five TFs, 2811 (65.4%) were shared by at least two TFs, while 726 (16.9%) were common to all TFs. When direct regulation as judged by TF binding was considered, 77 genes were shared between the five TFs. We note that we performed a conservative analysis and also restricted regulatory elements to a distance of 20 kb. It is well established that enhancer elements can be located further away; however, identification of these regulatory interactions would require analysis of the 3D chromatin structure (de Laat and Duboule, 2013). Consequently, the number of common direct targets that we identified is likely to be imperfect. Our data nevertheless show that the five TFs display common direct target genes despite their expression in different subcompartments of the limb musculoskeletal system. This indicates that irrespective of CT type, whether it is specialized, dense regular or dense irregular, key molecular features are shared during the differentiation process of CT types, suggesting an archetypical CT signature.
One example for a common and directly regulated gene downstream of the five TFs is NTN1. Netrin 1 is a secreted ligand involved in axon guidance and developmental angiogenesis, in addition to preventing apoptosis triggered by one of its receptors, DCC (deleted in colorectal cancer) (Cirulli and Yebra, 2007). With the exception of EGR1, which only activates the expression of netrin ligands (NTN1, NTN2 and NTN3), the other TFs positively regulate the expression of netrin receptors, UNC5A and/or UNC5B (Table S1), known to mediate netrin 1-induced axon chemorepulsion (Cirulli and Yebra, 2007). Our data suggests that NTN1 is an unexpected actor involved in migration and/or survival of CT cells during limb development.
Notably, the molecular core downstream of the five TFs comprises a myofibroblast signature with SRF, TAGLN (SM22, transgelin), TAGLN2 (transgelin 2), CNN1 (calponin 1) and ACTG2 (actin gamma 2) genes, which are positively activated by the five TFs, although not involving systematically direct binding sites (Table S1). SMAD4 is a well-known profibrotic factor downstream of TGFβ1 (Xu et al., 2016) and is directly regulated by all TFs (Table S1). The myofibroblast signature upon TF overexpression indicates that developmental CT differentiation shares molecular mechanisms with myofibroblast activation during fibrosis. We note that NOTCH1, a component of a developmental signalling pathway shown to be also involved in adult fibrosis (Hu and Phan, 2016), is a common and directly regulated gene downstream of the five TFs (Table S1). The upregulation of Notch pathway components by each of the TFs suggests an unexpected involvement of Notch signalling in limb CT formation during development.
It has to be noted that none of the TFs investigated here is a comprehensive marker for the different CT subtypes. For example, muscle CT appears to be a heterogeneous entity with areas in the mouse limb specifically expressing OSR1, and other areas expressing TCF4 during development (Vallecillo-García et al., 2017). Consequently, the molecular network identified here may not uniformly apply to all muscle CT or tendon cells in the limb bud. Taking into consideration the common regulatory features exhibited by the five TFs, however, makes us confident that the mechanisms we identified by choosing five example TFs may be a common theme with foreseeable local variation.
Specific regulatory patterns downstream of the five TFs
In addition to sharing a common molecular core, each TF displayed a specific regulatory pattern, although convergence was observed between related TFs, i.e. between OSR1 and OSR2, which are associated with irregular CT, and between EGR1, KLF2 and KLF4, which are mainly associated with regular CT. OSR1 and OSR2 are two markers of irregular CT and overexpression of each factor promotes the expression of irregular CT markers, such as COL3A1, while inhibiting that of cartilage markers in chick limb cells, as previously observed (Stricker et al., 2012) and consistent with the upregulation of cartilage-associated genes observed in irregular CT cells of Osr1 null mouse embryos (Vallecillo-García et al., 2017). The master regulator of cartilage SOX9 appears to be a direct target of OSR2 and the secondary regulatory factors SOX5 and SOX6 appear to be direct targets of both OSR1 and OSR2 in chMM cultures (Table S1). OSR1 and OSR2 share 318 common target genes, but also display their own specificity. Whereas only 42 target genes are unique to OSR1, 250 target genes are specifically regulated by OSR2 (Table S1). The BMP ligand GDF6 is one of the OSR2-specific target genes. GDF6 is known to play a role in establishing boundaries between skeletal elements during limb development, as inactivation of the Gdf6 gene causes defects in joint, ligament and cartilage formation in mice (Settle et al., 2003). This is in line with Osr2/OSR2 expression in joint interzones in mouse (Stricker et al., 2006) and chick embryos (Fig. 8K), as well as with the joint fusion defects observed in Osr1/Osr2 double mutant mice (Gao et al., 2011).
Although not being specific to tendons, EGR1 overexpression is sufficient to drive tendon cell differentiation in mouse mesenchymal stem cells (Guerquin et al., 2013). Over 100 genes upregulated upon EGR1 overexpression were listed as being enriched in the transcriptome of Scx+cells isolated from limbs of mouse embryos (Havis et al., 2014), including ADAMTS8, ADAMTS15, TAGLN, TAGLN2, FZD5 and WNT4, among others (Table S1). BMP4, known to be expressed in chick limb tendons (Wang et al., 2010), was also
TECHNIQUES AND RESOURCES Development (2018) 145, dev161208. doi:10.1242/dev.161208
DEVEL
O
positively regulated by EGR1 (although not directly) in our data (Table S1). EGR1 is characterized as a fibrosis-promoting factor in many organs (Ghosh et al., 2013). EGR1 has been also shown to regulate Tgfb2 transcription directly in adult mouse tendons (Guerquin et al., 2013). We note that TGFB1 is positively regulated by EGR1 (albeit not directly) in chick limb cells (Table S1).
The function of KLF2 and KLF4 in limb musculoskeletal system formation is currently not known. However, we show here that both KLFs display a striking expression delineating SCX+ tendon/ ligaments. In addition to the clear adhesion/migration signature downstream of both KLF factors in chick limb cells, KLF2 and KLF4 activate cell cycle genes such as CDKN1A (P21) and pluripotency-associated genes (SOX7 and DKK1, among others) (Table S1). The recognized function of KLF2 and KLF4 in somatic cell reprogramming and pluripotency (Jiang et al., 2008) raises the interesting hypothesis that cells surrounding SCX+expression domains could be a source of tendon progenitors during development. Consistent with this idea, different tenogenic properties have been described for peritenon cells and tendon proper cells (Mienaltowski et al., 2014). Given the identified role of the Notch signalling pathway in cell stemness (Mourikis and Tajbakhsh, 2014), the upregulation of Notch signalling components upon overexpression of KLF2 and KLF4 also suggests this potential implication. Beyond the 313 target genes that are shared between both KLFs and their similar binding occupancy in the vicinity of these target genes, KLF4 possesses 439 specific target genes. KLF4 specificity is corroborated by its primary binding motif, which differs from the KLF core binding sequence identified by KLF2 and KLF4 ChIP-seq (Fig. 6C). Indeed, the KLF4-binding site identified upstream of INHBA encompasses its primary recognition motif, whereas KLF2 and secondary KLF4 binding motifs are detected in the promoter region of their common target gene FZD1 (Fig. 8S,T).
A versatile molecular toolkit for shaping local niches
A significant proportion of directly or indirectly regulated DE genes comprises genes encoding signalling-associated molecules or ECM components and cell-matrix attachment molecules. The ECM is a three-dimensional insoluble network composed of secreted macromolecules, which provides positional and physical cues to influence cell position, migration and differentiation (Charras and Sahai, 2014; Mammoto et al., 2013; Rozario and DeSimone, 2010). Moreover, the ECM is a storage space for diverse growth factors that can be released upon, for example, proteolytic cleavage or mechanical stimulation. In this view, the ECM is both a scaffold structure and an integral part of cell-cell signalling mechanisms. Our data provide evidence that regional subspecification of limb bud mesenchymal tissues by TFs may be concomitant to local changes in the extracellular milieu. Of note, we show that there is a common ECM signature activated by the five CT-associated TFs in addition to specific ECM and signalling factor genes. Individual TF or combinatorial TFs will impinge on the production of a particular ECM with specific growth factor decoration. This is likely to influence the behaviour of neighbouring tissues and to create beneficial environments for invading cells. This is in line with the recognized importance of cell-ECM interactions for skeletal muscle, nerve and blood vessel development (Eichmann et al., 2005; Thorsteinsdóttir et al., 2011). Thus, coordinated expression of a combination of TFs may be an elegant and adaptable way to achieve tissue (sub)compartmentalization and to convey patterning information in development.
Concluding remarks
In conclusion, the transcriptional network presented here brings new insights into the molecular mechanisms orchestrating chick
limb CT differentiation and function. The common and specific programmes identified here are likely to be at the root of tissue subspecification and local compartmentalization in developing limbs leading to the creation of local niches supporting organogenesis. This regulatory network and the genome-wide data offer valuable resources and open new roads for better analysis and understanding of CT formation and function during limb development. In addition, such adaptable local transcriptional programmes could apply to diverse contexts and might be a general principle of functional modulation.
MATERIALS AND METHODS Chick embryos
Fertilized eggs used for in situ hybridization were provided by the Institut de Sélection Animale (JA 57 strain, Lyon, France). Fertilized eggs used to prepare chMM cultures were obtained from VALO BioMedia (Lohmann Selected Leghorn strain, Osterholz-Scharmbeck, Germany). Embryos were staged according to the number of days in ovo at 37.5°C.
Molecular cloning of the transcription factors
The CDSs of the chicken TFs OSR1, OSR2, EGR1, KLF2 and KLF4 were amplified by PCR by using the primers listed in Table S2. Cloning of the TF CDSs was performed by using a modified version of the pSlax-13 vector and the RCAS-BP(A) vector as previously described (Ibrahim et al., 2013), with the exception that the 3F tag was fused to the C terminus of each CDS. Chick micromass cultures
chMM cultures were prepared as previously described (Solursh et al., 1978). Briefly, limb buds were extracted from E4.5 chick embryos, ectoderm was dissociated using a Dispase solution (Gibco) at 3 mg/ml, and limb mesenchyme was digested using a solution composed of 0.1% collagenase type Ia (Sigma-Aldrich), 0.1% Trypsin (Gibco) and 5% fetal bovine serum (FBS; Biochrom) in 1× DPBS (Gibco). Prior to seeding, mesenchymal cells were mixed with retroviruses (1:1) and maintained in culture for 5 days at 37°C in DMEM/Ham’s F-12 (1:1) medium (Biochrom) supplemented with 10% FBS, 0.2% chicken serum (Sigma-Aldrich), 1% L-glutamine (Lonza) and 1% penicillin/streptomycin (Lonza). To assess cartilage differentiation, chMM cultures were fixed for 30 min with Kahle’s fixation solution (1% formalin, 30% ethanol and 4% acetic acid) and stained overnight at 4°C in 1% Alcian Blue (Sigma-Aldrich) in 0.1 M HCl. Chondrogenic matrix areas were measured using ImageJ (Schneider et al., 2012). For Eosin staining, chMM cultures were fixed overnight with 4% paraformaldehyde in PBS at 4°C and incubated for 2 min with 2.5 g/l of Eosin (Sigma-Aldrich) in 80% ethanol and 0.5% acetic acid. Viral 3F-tagged TF expression was monitored using a mouse antibody directed against the 3F tag (Sigma-Aldrich, F1804; 1:500). Immunohistological staining was performed using the Vectastain Elite ABC and the DAB Peroxidase Substrate kits (Vector Laboratories).
RNA sequencing
Two biological replicates of chMM cultures were prepared from two independent pools of E4.5 limb buds and infected for 5 days with RCAS-BP(A) retroviruses overexpressing each of the TFs or no recombinant protein as control. For both replicates, RNA extracts were obtained by harvesting six chMM cultures with RLT buffer (Qiagen). Total RNAs were purified using the RNeasy mini kit (Qiagen) in combination with a DNase I (Qiagen) treatment to prevent genomic DNA contamination. RNA libraries were prepared using the TruSeq Stranded mRNA Library Preparation kit (Illumina), which preserves the RNA strand orientation. Strand-specific 50-bp paired-end reads were generated using a HiSeq 2500 sequencer (Illumina) with a mean insert size of 150 bp (Table S3).
ChIP sequencing
Harvesting of chMM cultures and ChIP experiments were performed as previously described (Ibrahim et al., 2013). Histone modification occupancy was investigated in two independent biological replicates of
TECHNIQUES AND RESOURCES Development (2018) 145, dev161208. doi:10.1242/dev.161208
DEVEL
O
chMM cultures infected with RCAS-BP(A) retroviruses overexpressing no recombinant protein. Chromatin extracts (10 µg; eight chMM cultures) were incubated overnight at 4°C with gentle rocking with the following antibodies: 4 µg of mouse anti-H3K4me1 (Abcam, ab8895); 8 µl of mouse anti-H3K4me2 (Abcam, ab32356); 4 µl of mouse anti-H3K4me3 (Millipore, 07-473); 4 µg of mouse anti-H3K27ac (Abcam, ab4729); and 4 µg of mouse anti-H3K27me3 (Millipore, 07-449). TF binding profiles were investigated in two independent biological replicates of chMM cultures infected with RCAS-BP(A) retroviruses overexpressing each of the TFs. Chromatin extracts (30 µg; 24 chMM cultures) were incubated overnight at 4°C with gentle rocking with 10 µg of mouse anti-FLAG (Sigma-Aldrich, F1804). Antibody-TF/Histone-DNA complexes were pulled down using 40 µl magnetic beads (Dynabeads protein G, Thermo Fisher). Ethanol-precipitated ChIP samples were re-suspended in 46 µl ddH2O. Libraries
were prepared using the NEBNext Ultra DNA Library Preparation kit for Illumina (New England Biolabs) and 50-bp single-end reads were generated using a HiSeq 1500 sequencer (Illumina) (Tables S4 and S5). As input control, sonicated DNA from the nuclear fraction of each sample used for the ChIP procedures was also sequenced.
In situ hybridization and immunohistochemistry
Endogenous expression of the TFs was assessed by in situ hybridization on paraffin-embedded tissue sections. Chick embryo limbs were fixed overnight at 4°C in 60% ethanol, 30% formaldehyde at 4°C in Farnoy [60% ethanol, 30% formaldehyde (stock at 37%) and 10% acetic acid], and further processed as previously described (Wilkinson et al., 1987). Following in situ hybridization, immunohistochemistry was performed on tissue sections with the mouse monoclonal MF20 antibody (Developmental Studies Hybridoma Bank; non-diluted supernatant). For whole-mount in situ hybridization, chick embryos were fixed overnight at 4°C with 4% formaldehyde in 1× PBS and processed as previously described (Henrique et al., 1995). The following probes were used: cOSR1 and cOSR2 (Stricker et al., 2006); cEGR1 (Lejard et al., 2011); cKLF2 and cKLF4 (Antin et al., 2010). Expression of tendon and myogenic markers were assessed with the following probes: cSCX (Schweitzer et al., 2001); cMYOD (Pourquié et al., 1996). The primers listed in Table S2 were used to generate probes detecting the following genes: cFHL1; cFZD1; cGDF6; cINHBA; cNTN1 (Murakami et al., 2010); cWNT4 (GEISHA ID, WNT4.UApcr); cWNT11 (GEISHA ID, WNT11.UApcr).
Quantitative RT-PCR analysis
Total RNAs were isolated from independent biological replicates of chMM cultures infected for 5 days with RCAS-BP(A) retroviruses overexpressing each of the TFs or no recombinant protein as control. RNA extracts were obtained as described for RNA-seq and 500 ng of RNA extracts were used as template for cDNA synthesis using the High-Capacity cDNA Reverse Transcription kit (Applied Biosystems). Quantitative RT-PCR was performed using the SYBR Green PCR Master mix (Applied Biosystems) in duplicate. Relative mRNA levels were calculated according to the 2−ΔΔCtmethod (Livak and Schmittgen, 2001).ΔCts were obtained from Ct normalized to chick RPS17 (S17) and GAPDH. For each investigated gene, the mRNA levels of control chMM cultures were normalized to 1. Statistical analysis was performed using the Mann–Whitney U-test with GraphPad Prism V6 software. Primers used for quantitative RT-PCR are listed in Table S2. Gene expression profiles
RNA-seq strand-specific read pairs were mapped against the chicken genome galGal4 (Hillier et al., 2004) using TopHat2 v0.14 (Kim et al., 2013) ( parameters: -r 150; -N 3; --read-edit-dist 3; --library-type fr-firststrand; -i 50; -G) and the gene annotation model previously generated (Orgeur et al., 2018). Alignment maps were split by strand using SAMtools v1.2 (Li et al., 2009) according to their FLAG field (strand plus: -f 128 -F 16, -f 80; strand minus: -f 144, -f 64 -F 16). Fragments (both reads of a pair) mapped on gene features were counted using featureCounts v1.4.6-p3 (Liao et al., 2014) ( parameters: -p; -s 2; --ignoreDup; -B; -R). Chimeric fragments aligned on different chromosomes were taken into consideration to overcome the gene fragmentation due to the location of gene parts on multiple chromosome contigs (Orgeur et al., 2018). Fragment counts were
then normalized using DESeq2 v1.8.1 (Love et al., 2014) and transcript abundances were calculated as transcripts per million (TPM) values according to the formula described by Wagner et al. (2012). To evaluate discrepancies among biological replicates and conditions, a regularized-logarithm (rlog) transformation was applied to normalized fragment counts followed by PCA analysis and hierarchical clustering of the Euclidean distances (Love et al., 2014). Differential expression analysis was finally carried out using DESeq2 and a false-discovery rate (FDR, alpha) of 0.01. Genes with an absolute fold change of at least two and a Benjamini– Hochberg-adjusted P-value ( padj) below 0.01 were considered as being differentially expressed (Table S1). Heat maps were generated using the function heatmap.2 from the R package gplots. For given gene lists, rlog-transformed fragment counts were used as input and hierarchical clustering was performed according to the one minus Pearson correlation.
K-means gene clustering
K-means clustering was performed on the normalized fragment counts of the DE genes using GENE-E (https://software.broadinstitute.org/GENE-E/) with a row distance metric set at 1 minus Pearson correlation and 2000 iterations. The number of K clusters was defined at eight because lower values did not separate distinct gene clusters and higher values subdivided meaningful gene clusters.
Gene ontology analysis
GO analyses were performed for given gene lists using the PANTHER statistical over-representation test r20160321 (Mi et al., 2010) and the Bonferroni correction for multiple testing. The following annotations were interrogated: PANTHER version 10.0 released on 2015-05-15 for GO-slim biological process, cellular component and pathways; GO ontology database released on 2016-04-23 for GO biological process complete. ChIP sequencing coverage profiles
50-bp single-end reads generated for each ChIP and input fractions were first filtered on their quality using the FASTX-Toolkit v0.0.13 (http://hannonlab. cshl.edu/fastx_toolkit/). Reads with a median quality value of at least 28 were retrieved and mapped against the chicken genome galGal4 (Hillier et al., 2004) using BWA v0.5.9 (Li and Durbin, 2009) (default parameters). Uniquely mapped reads were then extracted and duplicated reads were finally removed using the tool rmdup from SAMtools v1.2 (Li et al., 2009). Histone mark and TF coverage profiles were generated using the tool bdgcmp from MACS2 v2.1.0.20140616 (Zhang et al., 2008). ChIP-seq signal was normalized independently for each biological replicate against the pooled input controls of both replicates according to the negative log10 of the Poisson P-value (-m ppois). Similarity between the TF binding profiles was assessed at a genome-wide level in 500-bp non-overlapping windows by PCA analysis with the R function prcomp ( parameters: center TRUE; scale. TRUE). Histone modification peak calling
Peak calling for the histone ChIP-seq was performed as suggested by the ENCODE consortium (Kellis et al., 2014). For each histone modification, peaks were called independently for each biological replicate and for the pooled biological replicates, each time against the merged input control of both replicates, using MACS2 v2.1.0.20140616 (Zhang et al., 2008) ( parameters: --bw 400, according to the sonicated DNA size; -g 1.0e9; --to-large). Except for the H3K27me3 mark, peak calling was performed twice for each replicate and pooled replicate: (1) narrow peaks passing a P-value (-p) of 0.01; and (2) broad peaks passing an additional broad-peak P-value (-p 0.01; --broad; --broad-cutoff ) of 0.1. Only broad peaks were called for the H3K27me3 ChIP-seq due to its diffused signal. Broad peaks detected for each replicate and pooled replicate that contain at least one narrow peak were extracted using BEDtools intersect v2.24.0 (Quinlan and Hall, 2010). Final sets of peaks for each histone modification were obtained by filtering broad peaks called for the pooled replicates that are shared between both biological replicates independently.
Identification of regulatory domains
Regulatory domains were defined according to the combination of the different histone modification profiles obtained by ChIP-seq, independently
TECHNIQUES AND RESOURCES Development (2018) 145, dev161208. doi:10.1242/dev.161208