Developing Effective Management Flight Simulators by
Bruce J. DiBello
Submitted to the Department of Electrical Engineering and Computer Science in Partial Fulfillment of the Requirements for the Degrees of
Master of Engineering in Electrical Engineering and Computer Science at the Massachusetts Institute of Technology
May 26, 2006
0 2006 Massachusetts Institute of Technology. All rights reserved.
Author
Department of El'ctcal Engineering Certified by
Accepted by
and Computer Science May 26, 2006 John Sterman
A thur C. Smith Chairman, Department Committee on Graduate Theses
MASbA(HUS.t N U OFTECHN
Developing Effective Management Flight Simulators by
Bruce J. DiBello
Submitted to the
Department of Electrical Engineering and Computer Science May 26, 2006
in Partial Fulfillment of the Requirements for the Degree of Master of Engineering in Electrical Engineering and Computer Science
Abstract
A novel, easy-to-use interactive simulator is developed to help students and others learn about the impact of time delays in complex systems. Users attempt to follow a target on a computer screen, with different patterns for the target and different time delays between control actions and their impact on the screen position. The delay simulator is an effective management flight simulator for assisting in teaching the concept of delays in supply chains and other complex systems. The simulator's usability factored into its effectiveness. Extensive user feedback and testing were carried out to yield a simple, intuitive interface. Human subjects were given specific tasks to perform on the simulator. The results from these experiments were used to determine the learning effect of the simulator. As expected, performance and consistency both improved as the number
of trials for each user grew.
Thesis Supervisor: John Sterman
Table of Contents
I
In tro du ctio n ... 52 B ack grou n d ... 5
3 Developing the delay simulator ... 7
3 .1 D e sig n ... 7 3.2 Implementation ... 8 3 .3 D escrip tion ... 9 3.4 Design Decisions ... 11 3 .4 .1 H eu ristics ... 1 1 3 .4 .2 Jav a ... 12 3 .4 .3 S corin g ... 12 3 .4 .4 C ontro ls ... 13 3.4.5 M odifying settings ... 13 3.4.6 Visibility of Controls ... 14 3.4.7 Starting method ... 15
3.4.8 Setting the delay ... 16
3.5 Problem s encountered ... 17
3 .5 .1 S izin g ... 17
3 .5 .2 Jav a 5 .0 ... 17
3.5.3 Hiding the mouse cursor ... 17
3.5.4 Java Painting ... 18 3.5.5 Error offset ... 19 3.5.6 Canceling a simulation ... 19 3.6 User testing ... 20 3 .6 .1 B riefi n g ... 2 1 3 .6 .2 T ask s ... 2 1 3.6.3 Feedback ... 22 4 Running experiments ... 25 4 .1 S et I ... 2 5 4 .2 S et 2 ... 2 6 5 R esu lts ... 2 7 5.1 Step Path Trials I ... 27
5.2 Step Path Trials 2 ... 29
5.3 Random Trials ... 31
6 F u tu re w ork ... 3 2 7 R eferen ces ... 3 4 A Consent form ... 35 B U ser m an u al ... 3 8
1
Introduction
One method of learning is to learn by doing. However, such learning cannot always be done because of time or cost constraints when the material covers large systems or events. Management flight simulators are used to help teach such concepts and others through interactive games. The user interface is an important factor to consider when developing such a management flight simulator. Focusing on its user interface, I developed a management flight simulator in order to assist in teaching the concept of delays in supply chains.
The development process took many iterations of designing, implementing, and evaluating. The simulator was tested by target users to further evaluate and improve it. Once the simulator was completed, human subjects were given tasks to perform on it. The data from their experiments was collected and analyzed to determine the simulator's learning effect, which was very noticeable. Performance improved significantly as the number of trials for each user grew.
2 Background
A large percentage of the general public does not understand concepts that are obvious to people with technical backgrounds. Simple concepts such as rate of change are easily misinterpreted, which is described in detail in studies dealing with the rate of change of the water level in a bathtub [6] and the rate of change of global warming [7]. The problem is apparent in business schools where understanding of such concepts is essential to the success of one in a managerial position. Even students with technical backgrounds can misconstrue technical concepts.
One such concept is that of the delays that occur when propagating some information or material. An example can be seen in supply chain management [5]. When a company releases a new product, the demand for the product may exceed initial estimates. As a result, the company must increase the supply to match the demand. However, the supply does not instantly increase to the desired level. There are many steps along the way that impede this increase. When the supply finally reaches the new level, the demand may have fallen below the current supply. Now the company must reduce the supply so as to match the current demand. If the length of these delays was known, a more efficient path could have been taken. The supply could have been increased incrementally until it reached the demand.
One way to teach such concepts in a fun, easy way is to use an interactive, computerized simulation. Learning by actions is an extremely effective practice for learning new material. It is also a method for retaining knowledge because one can later recall what happened during the simulation.
Such interactive computer games or "management flight simulators" have existed for a number of years. One such example was a simulator that modeled a firm, its market, and its competition [1]. Users set product prices and supply throughout a ten-year period. Throughout the simulation users could see their status and make changes accordingly. This simulator allowed users to see the impact of their actions on the market without any real life consequences. Users could play the simulator multiple times to learn the best strategies for each scenario.
In order for a simulator to be as effective as possible, it must have a good interface. Most users will not have in depth training or experience with such simulations.
Therefore, users should be able to easily learn how to use the simulator. The usability of a simulator has a huge effect on the user's experience. If a user doesn't have to focus on interface issues, he or she can devote his or her full attention to the simulation. An inefficient user interface would not only waste a user's time, which is very valuable, it would also negatively impact the user's learning experience because the user has to focus on resolving issues caused by the interface. Its also important for the interface to prevent any possible errors the user could cause. Error prevention is a high priority as seen in the Therac-25 accidents [1]. While those accidents are much more extreme than any management flight simulator, they show that the user interface cannot be neglected.
3 Developing the delay simulator
3.1 Design
Professor John Sterman conceived the initial design for the delay simulator. The goal of the simulator was to simulate delays in supply chains. Users could not predict the future demand and could only control the supply level. However, the supply would not immediately respond to changes due to the delays that exist in supply chains. As a result, the user would learn better strategies for adjusting the supply level.
A common and intuitive depiction of supply and demand is two lines/paths on a graph, one for supply and one for demand. The y-axis of the graph represents the level of supply or demand. The x-axis of the graph represents time. The two paths move from left to right as time progresses. The user has no control over the path representing demand. The user can only control the level of the supply path, as represented by its position on
the screen, but since there is a delay associated with supply chains, the user does not get immediate feedback from his or her actions.
3.2 Implementation
The delay simulator was coded in Java 1.4.2 on the Eclipse platform using the Swing toolkit for the user interface. The delay simulator was developed using the spiral model. The spiral model is currently the best process for developing graphical user interfaces. The delay simulator went through many iterations, each consisting of design, implementation, and evaluation stages. The first iteration consisted of sketches of the interfaces. Each iteration improved on the previous version by adding or removing features or enhancing the look. Professor Sterman and I evaluated most of the early iterations together. We discussed what needed to be improved and what didn't. Towards the end of development, users new to the simulator were asked to test and critique the simulator. Changes were made according to their feedback. Figure 1 depicts the current version of the delay simulator. There were many changes made between the first version and the current version. Some of these changes will be discussed in Section 3.4.
Place the mouse cursor over the red square to begin
lick
herefor instructions
U
Figure 1. Ihe current version or the delay simulator. inis is tne initial view snown to tne user when the simulator begins. The bottom area contains controls for customizing the simulation.
3.3 Description
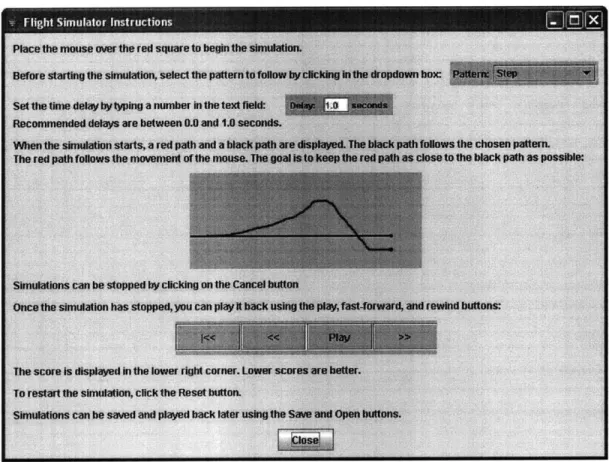
Figure 1 shows the screen users see when the simulator is first launched. Users can click the button labeled "Click here for instructions" to view how to use the simulator. Figure 2 shows the popup window containing the instructions. The bottom part of the simulator's main window contains controls for changing characteristics of the simulation. A user can change the delay or change the type of demand path. The simulation is started when the user places the mouse cursor in the red square on the left and leaves it there for approximately two and a half seconds. The controls then become disabled and the instructions button and label disappear while the supply and demand paths travel across the screen. The demand path is black and moves according to the
pattern chosen in advance by the user, e.g. a step, sine wave, or random walk. The supply path is red and follows the vertical position of the mouse but is delayed. The mouse cursor cannot be seen until the end of the simulation unless the mouse cursor leaves the simulation window. If a user could see the mouse cursor, the user could easily set the supply to the demand.
Figure 2. The popup window that appears when the user clicks on the button labeled
"Click here for instructions."
After a simulation, a user can play it back using controls on the bottom of the window. The user also has the option of viewing a phase plot of the simulation or saving the simulation to be viewed later. The user's score is displayed in the lower right. Lower scores are better with zero being a perfect score. The scoring system is explained in detail
in section 3.4.3. A screenshot of the playback can be seen in Figure 3. For full detailed instructions, see Appendix B.
Player
Lj show Mmse Posoon osr- W- ft plo Score: 43
Figure 3. The view shown to the user during playback. The bottom area contains
playback controls.
3.4 Design Decisions
3.4.1 Heuristics
The simulator was designed with Nielson's ten usability heuristics in mind [3]. In the case of the simulator, some of these heuristics are particularly important. The system status should always be visible to the user, so the user knows what the application is doing at all times. The user must have full control and freedom. Users should be able to easily undo or cancel an unwanted action. The simulator should prevent a user from causing any errors and allow a user to easily recover should an error occur. A user should
not have to memorize how to use the simulator. Users should easily be able to look at it and understand how it works. A user's time is valuable and therefore the simulator should be efficient, allowing frequent users the ability to quickly perform any task. The simulator should be aesthetically appealing. It should not be cluttered with unnecessary details. Finally, the simulator should contain answers to any important questions a user might have.
3.4.2 Java
The simulator was coded in Java for several reasons. First, Java is platform-independent. Java code works the same on a Windows machine as on a Macintosh or Linux machine. Another reason Java was used is because Java applets can be embedded
in web pages and Java applications can be downloaded as executable applications.
3.4.3 Scoring
There were many different options to choose from when deciding the scoring system. A good scoring metric will indicate the ability of the user to match supply and demand over the entire course of a simulation. It should also be easy to interpret. Originally, the score was computed as the sum, over the length of the trial, of the absolute value of the difference in pixels between the two paths at every point along the paths. This number was on the order of 105, which was too large. To reduce the score, we divided it by the number of points in the paths (the length of the paths), so that the resulting score was the mean absolute deviation between the target and actual path over the length of the trial:
IS(i)
- D(i)l where: nn = number of points in the path S(i) value of supply path at point i D(i) value of demand path at point i
We use the mean absolute deviation between demand and supply rather than, say, the mean squared error or root mean squared error to aid user comprehension. Mean absolute deviation is very easy for a user to understand. Additionally, the mean absolute deviation generates scores that are relatively small (usually less than 100). Smaller numbers are easier for users to understand and better for users' morale when they know that they are trying to get a low score.
3.4.4 Controls
The controls on the bottom row of the delay simulator change depending on which mode the user is in. When the user is in the simulating mode, the controls allow the user to change the demand path and the delay. However, once a simulation ends and the simulator goes into playback mode, the bottom row contains the score and controls that pertain to playback. This violates the consistency heuristic that we were trying to follow. However, in this case, the violation does not outweigh the benefit of being able to reuse the bottom row to save screen real estate. While the inconsistency may have confused first-time users, most users quickly understood the changes and had no related problems.
3.4.5 Modifying settings
When developing the delay simulator, we kept in mind that others may want to use it in a way that we did not anticipate. We wanted to give others the ability to
customize their simulations. In the dropdown box of patterns for the demand path, there are several different options. The demand can be a step, ramp, or sine function. It can also be a random walk or a combination of the previously stated paths. There are preset random walks that can be selected if someone wants to compare how multiple users perform on the same random walk (useful for research purposes). Users can also change the height of the step function, the slope of the ramp function, and the amplitude of the sine function. Instead of making the user set these values in pixels, the user simply enters a number between 0 and 10 with 5 being the default value. The number is then scaled to pixels automatically. Changing the demand path takes up very little screen real estate because of the use of a dropdown box and popup window.
3.4.6 Visibility of Controls
The bottom part of the window contains all of the controls for the delay simulator. Included in this area are the demand path pattern and the supply path delay. We wanted the controls to be visible for a couple reasons. For the simulations I ran, all of the users were informed of the type of demand path they would see as well as the supply path delay they would have to account for. Therefore, showing them the controls didn't give them any additional information. Also, it is much easier to change settings if the controls are always visible.
Some may question why a popup window is used to change the step height, ramp slope, or sine amplitude. One reason is that there isn't a lot of space for the controls. Another is that changing these values is more of an advanced feature that casual users won't have a need for and therefore don't need to see. Finally, displaying these values could give the user too much information about the path.
Others may want all the controls to be hidden from the user when running their own experiments. This can easily be achieved by anyone with a moderate amount of programming experience.
3.4.7 Starting method
I considered two possible methods for users to begin the simulation. The method implemented consists of the user placing the mouse cursor in a red square and leaving it there for approximately two and a half seconds. An alternative method considered was to replace the red square with a button that would start the simulation when clicked. I chose the first method for several reasons.
The most important reason was that with a button a user could accidentally move the mouse a significant distance immediately after clicking on the button. The user would not see this until the delay had passed at which point the supply path would jump to the location that the mouse moved to after clicking the button. Such a jump would confuse users and alter performance artifactually. Requiring users to keep the mouse cursor in the red square ensures that the mouse cursor has not moved more than a very small distance for approximately two and a half seconds, ensuring the user will never see a sudden an unexpected jump near the beginning of a simulation.
Another reason is that the starting area had to be relatively small. If the user clicked in a large area to begin the simulation, the user might be confused when the supply path, which the user is told follows the mouse, doesn't start right next to the mouse. Users are not used to very small buttons so requiring users to click in a small button to begin could cause problems.
3.4.8 Setting the delay
If a user desires to change the default delay, he or she has to enter a new delay in the text field in the lower right corner of the screen. However, a simulation should not run if the user entered an invalid number in the text field (e.g. 1.5s2). The design decision here is determining when the delay should be checked and set. I felt that there were only three possible options. One option is to have the user click a button to make a popup window appear. The user could then enter the delay in that window and click a set button to set the delay and close the window. This is similar to the method for changing path settings. However, I felt that most users will change the delay more often then they would change path settings. For that reason, the user shouldn't have to deal with a popup window every time the user wanted to change the delay. Another possible option is to have a set button right next to the text field. After a user enters in a new delay, he or she clicks the set button to set the new delay. However, there is really no good reason to require the user to click the set button. It unnecessary work and if the user forgets, the user will think that the delay he or she entered was set when it never was.
The third possible decision is the one I implemented. The user simply enters the new delay in the text field. The user doesn't have to click any buttons or do anything else. However, the simulator needs to know when to check and set the new delay. This occurs after the 3-2-1 countdown and just before the simulation begins. An alternative time to check would be when the mouse first enters the red starting square. However, a user could accidentally mouse over the red square without intending to start the simulation. If that happens and there is an invalid number in the text field, the user will have to deal with an annoying popup window informing the user of the invalid delay.
3.5 Problems encountered
While developing the delay simulator, I encountered many problems. Here are a few of them.
3.5.1 Sizing
While Java is platform independent and performs the same across different operating systems, user interfaces don't always appear exactly the same due to sizing differences. I developed the delay simulator on a computer running Windows. After placing all of the components in their desired locations and setting their sizes and the window size, I noticed that the delay simulator, when run on a Macintosh computer, was not displayed correctly. Strings of text were cut off or ran past the edge of the window. I had to account for this by adding a little extra space for each component and window. Whenever I made any changes to the interface, I tested the delay simulator on a Macintosh to ensure that it would be displayed correctly.
3.5.2 Java 5.0
The latest version of Java is currently 5.0 (or 1.5.0). However, since not all computers supported Java 5.0 at the time that I began developing the delay simulator, I had to use Java 1.4.2. This was only a minor problem. I was still able to achieve everything I needed to; certain tasks just required a little creativity.
3.5.3 Hiding the mouse cursor
When a user is running a simulation, it is extremely important that the user not be able to see the mouse's position. Therefore, a method for hiding the mouse cursor was
required. However, Java does not have a simple function for hiding the mouse cursor, probably for a good reason. In almost every application, there's no reason to hide the cursor and doing so would probably just scare the user.
Since Java does not have a function for hiding the cursor, I had to find a workaround. Java allows the cursor to be changed to any of a preset list of cursors (resizing arrows, hourglass, etc.). Java also allows the cursor to be changed to an image file. I created a completely transparent image that the mouse cursor changes to when a simulation starts. When the simulation ends, the mouse cursor returns to its default cursor and appears again. Thus, I was able to hide the mouse cursor during a simulation.
3.5.4 Java Painting
Java does not have a built in class that draws paths on the screen. Therefore, I had to create my own method to draw the paths. There were three different models I could have used: component, stroke, and pixel. I used the stroke model, which consists of drawing lines, shapes, curves, and text onto a drawing surface. The supply and demand paths were created by drawing a small square at each point along the paths. During simulation, the location of each point was saved and displayed in real time. During playback, only points up to the current time were displayed.
One important aspect I had to consider was how much to repaint at each time step (time step = 30ms). I decided to repaint every point along the path. This included the current point and every point before it. I wanted to make sure that if the window needed to be repainted for any reason (window moved, resized, covered, etc.), the paths would be repainted correctly. This required iterating through an array of points for each path at every time step. While this may not have been the most efficient method, the paths were
always displayed correctly and performance did not suffer during simulation or playback even when multiple paths and the phase plot were all displayed at once. However, performance could potentially suffer on older computers if the paths were made much longer, or if the time steps were shorter.
3.5.5 Error offset
As mentioned earlier, the supply path follows the position of the mouse. The simulation starts by placing the mouse cursor in the red square on the left and leaving it there for approximately two and a half seconds. To make it easy to keep the mouse cursor in the red square, the red square is thicker than the supply and demand paths, which start from the red square. However, if the mouse is not exactly in the middle of the red square, the supply and demand paths won't start at the exact same level at the beginning of the simulation. They will be off by a few pixels. In order to eliminate this error, I incorporated an offset to the mouse position that was based on where the mouse was relative to the center of the red square (<10 pixels). The offset is used to calculate where the supply path should be relative to the mouse cursor. With the offset, the supply path and demand path are always exactly equal to each other at the beginning of every simulation even if the user does not place the cursor exactly in the center of the start box.
3.5.6 Canceling a simulation
While simulations do not take a long time (< 10 seconds), some users may want to cancel a simulation prior to termination. This would usually occur when they realize that they wanted to change some aspects of the simulation (demand pattern, delay, etc.). In my original design, a user could cancel a simulation by pressing the "Esc" key. After
implementing such functionality, I found that pressing the "Ese" key would not always cancel the simulation. This was because the correct component was not given the focus and therefore another component was receiving the keystroke event. To address this issue I added a "Cancel" button that cancels the current simulation when clicked. Even though the mouse cursor is hidden during the simulation, it appears again if the mouse leaves the window or enters the bottom area containing the controls. Since the Cancel button is in the lower left corner, users can simply move the mouse to the lower left until the cursor appears, then click on the button. While the Cancel button wasn't part of my initial design, I feel that, at least in terms of consistency, it is better than pressing the "Esc" key. For the most part, users only need to use the mouse to use the delay simulator. Therefore, it makes sense for them to be able to cancel the simulation using the mouse as opposed to having to use both the keyboard and mouse.
3.6 User testing
After developing the delay simulator to the point where it had most of its desired functionality, I had five MIT undergraduates, some but not all of whom were computer science majors, test it to find any problems or ambiguities that would cause difficulties for first time users.
I tested several aspects of the delay simulator. The main purpose of testing was to check if users were indeed learning the concepts the simulator was supposed to help teach. The application's usability as a computer application was also thoroughly tested. An application's usability has a huge impact on its teaching ability. If users have trouble using an application, they most likely won't be learning much from it. Additionally, a user's time is very valuable and it shouldn't be wasted on interface issues. Users should
be able to easily understand the interface and learn how to use the simulation without any outside assistance. I monitored users as they first viewed the delay simulator to make sure that they were not confused.
Specifically, I focused on the dimensions of usability described in [2]: * Learnability: is it easy to learn?
* Efficiency: once learned, is it fast to use?
- Memorability: is it easy to remember what you learned? - Errors: are errors few and recoverable?
- Satisfaction: is it enjoyable to use?
3.6.1
Briefing
Before test users saw the delay simulator they were given a briefing describing the process. I began by informing the user of the purpose of the delay simulator. The user was informed that I would be testing the application and not the user. Any problems encountered were the application's fault and not the user's. Users were asked to say their thoughts out loud as they used the delay simulator. Users were informed that they could stop at any time for any reason. The identity of the user and the results of the testing would remain completely confidential. Finally, I answered any questions that the users had.
3.6.2 Tasks
Users were asked to perform the following tasks: 1. Run a simulation
3. Run a simulation and cancel it while its running 4. Change pattern and run another simulation
5. Save the simulation
6. Change pattern and delay and run another simulation 7. Customize a pattern and run a simulation with that pattern 8. Open a saved simulation
9. Freely explore the simulator
Aside from giving the user the next task, I remained quiet and tried not to disturb the user.
3.6.3 Feedback
Users provided a great deal of useful feedback, which was used to improve the delay simulator. Originally, the entire delay simulator was the same default color. Some users were confused as to how the area displaying the paths was connected to/separated from the bottom area containing the controls. To resolve this ambiguity, I changed the colors of the two areas to separate them. The paths area is much lighter than the controls area.
Through users' actions and feedback, I was able to determine that the text that was most important needed to stand out more. For example, not all users read the instructions even though they didn't know anything about the simulation. Thus, I increased the font size and used bold type for the instructions label and the text of the instructions button as well as certain text in the "customize path" window.
Several users had issues with the playback controls, specifically the fast-forward and rewind buttons. The main complaint was that they were too fast. It was difficult for
users to stop exactly at a desired point. I slowed down fast-forward and rewind to a rate that satisfied users. Another issue some users had with the fast-forward and rewind buttons was that they had to click the buttons to start them and click them again to stop them. I changed the functionality so that fast-forwarding and rewinding would only happen when a user clicked and held the mouse button down. Users responded well to this change. One user suggested modifying the fast-forward and rewind buttons so that clicking them once would cause the animation to jump forwards or backwards, respectively. I felt that users are not accustomed to this type of functionality and thus
decided not to implement it.
The version of the delay simulator given to users to test displayed a dropdown box during playback that allowed the user to select how much of the path to display. A user could choose to either see only the current point and no other part of the path, the current point and the path that had been traversed thus far, or the current point and the entire path. Users did not see the need for this and also weren't exactly sure what the dropdown box did, even after selecting an option from it. Also, the dropdown box was in the same location as another dropdown box that was displayed during simulation, which further confused users. For these reasons, the dropdown box was removed. It was never an important piece of the simulator. I originally added it as an advanced feature with no obvious purpose. I wanted to receive feedback from users about it before removing it completely.
When users were told to change the delay, every user increased it to greater than one second, the default delay. However, when the delay is too large, the user has a very difficult time trying to get the supply and demand paths close together. Very little
information can be recovered from simulations with large delays. In order to solve this problem, I added the following in the instructions: "Recommended delays are between 0.0 and 1.0 seconds." When asked to change the delay, users that read the modified instructions decreased the delay to somewhere between 0.0 and 1.0 seconds.
Unfortunately, most users do not know the best ways to improve an interface. User testing is very effective for discovering parts of an interface that need improvement. However, user testing does not necessarily reveal how to fix those problems. Users will often give ideas on how to fix a problem without knowing that their suggestion is infeasible or violates usability heuristics. Therefore, after I received feedback from users, I had to determine which suggestions to implement and which to disregard. One suggestion that I did not implement was mentioned earlier: modifying the fast-forward and rewind buttons so that clicking them once would cause the animation to jump forwards or backwards, respectively. Another user recommended modifying the fast-forward and rewind buttons so that they would initially fast-fast-forward or rewind at a slow rate but then speed up on each successive click. Such functionality violates the consistency heuristic. Users are not familiar with such behavior with fast-forward and rewind buttons. Therefore, they would not expect the animation to speed up even more upon clicking the fast-forward button a second time. Most users would assume that clicking the button again would stop the fast-forwarding. Thus, I did not implement this functionality. These were just a couple examples of ideas received from users that were not implemented.
4 Running experiments
To collect data, I had human subjects run several simulations each. The Committee On the Use of Humans as Experimental Subjects approved the experiment beforehand. Before running the simulations, subjects were given a consent form to read and sign (Appendix A). Subjects were recruited through two different methods. I asked students that I knew to run the experiments. Students were also recruited from the system dynamics classes at the MIT Sloan School of Management. No incentive was offered. Subjects were put through one of two slightly different sets of simulations.
4.1 Set I
The first 20 subjects to run the experiment were given the first set of simulations. This set consisted of the following:
1. Training
2. Step path with 1 second delay (repeated a total of three times) 3. Step path with no delay
4. Preset random path with 1 second delay (a total of five trials) 5. Preset random path with no delay
The training simulation consists of only a supply path that follows the movement of the mouse. There is no delay. The training path serves to acquaint the user with the simulation, the response of the cursor on the screen to the mouse, and otherwise familiarize themselves with the simulator. The user follows this up with three consecutive simulations of the demand path simulating a step function and the supply path incorporating a one second delay. Next, the delay is removed and the demand path is still
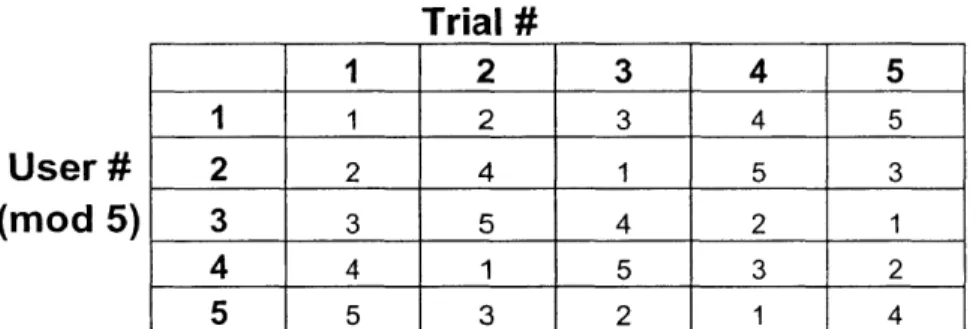
a step function. Built into the delay simulator are six preset random paths. For the first five preset random paths, the demand path follows the preset random path while the supply path has a one second delay. A 5x5 Latin square is used to determine which order the user sees the preset random paths. Figure 4 depicts the Latin square used. User n sees the preset random paths in the order they are listed in row number (n mod 5) of the Latin square. The preset random paths are depicted in Figure B3 in Appendix B. A Latin square is used so that we can separate the effect the path has on the user's score from the effect the trial number has on the user's score. For the final simulation, the demand path follows the sixth preset random path and the supply path has no delay.
Trial #
User#
(mod 5)
12
3
4
5
1 1 2 3 4 5 2 2 4 1 5 3 3 3 5 4 2 1 4 4 1 5 3 2 5 5 3 2 1 4Figure 4. The Latin square used to determine the order for presenting paths to each user.
For user n's trial number m, the user received the preset random path located at row n (mod 5) and column m of the table.
4.2 Set 2
The next 20 subjects to were given the second set of simulations. This set consisted of the following:
1. Training
2. Step path with no delay
3. 3 x Step path with I second delay
4. 5 x Preset random path with 1 second delay 5. Preset random path with no delay
Note that set 2 is very similar to set 1. The only difference is that steps 2 and 3 are switched. This is to determine the learning effect and delay effect for the zero delay step path simulation.
5 Results
5.1
Step Path Trials
1
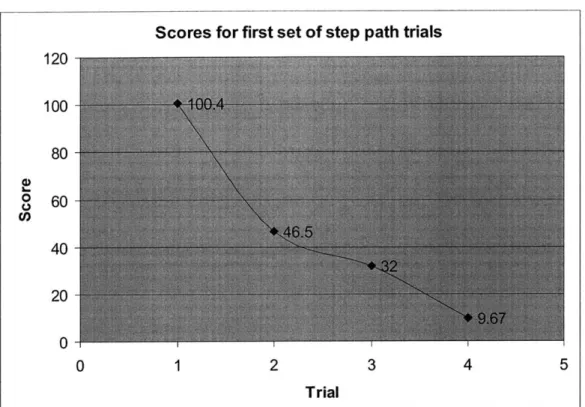
The first set of experiments consisted of twenty subjects running the simulation with the demand path following a step pattern. For the first three trials, the supply path was delayed by one second. For the fourth trial, the supply path had no delay. Figure 5 shows trial number one for four different users. In tasks such as this a significant learning curve is expected. Figure 7 shows how mean score improved (fell) with trials. The largest improvement occurred on the second trial. This is obviously because the users were not used to such a simulation and therefore performed poorly during the first trial. The improvement on the third trial is not as large. By the third trial, users have devised a strategy for achieving a good score. Performance on the fourth trial is much better than the third because users do not have to account for a delay. The delay has a huge effect on a user's performance. The average score for trials with a delay was 59.5. The average score for trials without a delay was 10.8. Figure 6 shows trial number four (without a delay) for four different users.
(1) / \ / (3) f
/
,/
\~
/
(2) /1 it~1
~~~~~~~1 (4)-N
/ / //
/N
Figure 5. The first trial from four different users. The demand path is a the delay is one second. Notice that they all exhibit oscillatory behavior.
(1)
step function and
(2)
Figure 6. The fourth trial from four different users. The demand path is a step function
and there is no delay.
/
________/
(2)
Scores for first set of step path trials
120 10080
0
60
CO 40 200
0 1 2 3 4 5 TrialFigure 7. Graph displaying the average score for each of the four trials for the first set of subjects.
5.2 Step Path Trials 2
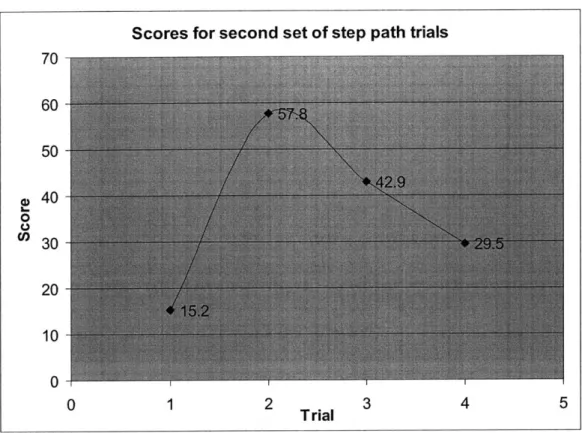
The second set of experiments also consisted of subjects running the simulation with the demand path following a step pattern. For the first trial, the supply path had no delay. For the next three trials, the supply path was delayed by one second. The results of these trials can be seen in Figure 8. Looking at the graph, one can see that performance improves from trial two to trial four. The first trial obviously had the lowest score because users did not have to account for a delay. Even though the first trial contained no delay, it still had an effect on the user's following delayed trials. The average score for trials with a delay was 43.4. The average score for trials without a delay was 15.2.
0
1
2 Tria 3 4 5Figure 8. Graph displaying the average score for each of the four trials for the first set of subjects.
The reasoning behind running two sets of experiments with the difference being whether the user ran the trial with no delay first or last was to be able to distinguish the learning effects. There is a learning effect that occurs after every simulation a user sees. There's also a learning effect that occurs after a user has seen his or her first delayed simulation. The first set of experiments combines both learning effects on the first trial, which is why there is such a large improvement on the second trial. The second set of experiments separates both learning effects into the first two trials. Performance on the trial with no delay from the first set of experiments is better than the trial with no delay from the second set because of the learning effect from seeing simulations. A user from the first set has already seen three experiments whereas a user from the second set has yet to see an experiment. Similarly, the scores for the three delayed trials in the second set
Scores for second set of step path trials
707, 6050
040 zz-0 2010
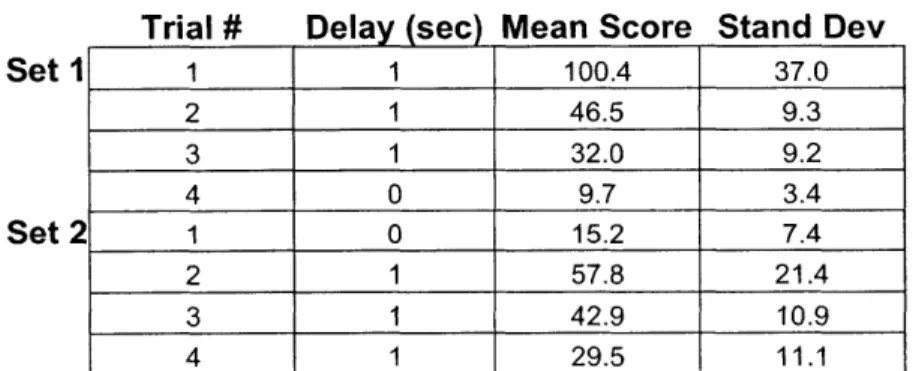
Aare all better than the scores for the three delayed trials in the first set. This is because users in the second set have seen one more experiment prior to each trial compared to users in the first set. Figure 9 shows the mean scores and standard deviation for each trial. From the table we can see that not only does the score decrease greatly after the first delayed trial, but the standard deviation drops significantly as well. This shows that in addition to user perfonnance improving, users also get more consistent.
Trial # Delay (sec) Mean Score Stand Dev
1 1 100.4 37.0 2 1 46.5 9.3 3 1 32.0 9.2 4 0 9.7 3.4 1 0 15.2 7.4 2 1 57.8 21.4 3 1 42.9 10.9 4 1 29.5 11.1
Figure 9. Table containing the mean scores and standard deviation for all of the users from each set of experiments. N = 20 subjects for set I and 20 for set 2.
5.3 Random Trials
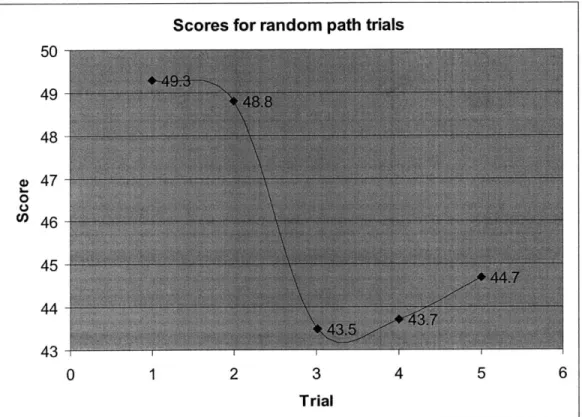
Subjects in both sets of experiments were put through a similar set of random path trials after their experience with the step trials. Each subject was given the same five preset random paths with a one second delay. The paths were ordered five different ways and each subject was shown the paths in one of the five orders. Finally, each subject was given the same preset random path with no delay. Average performance can be seen in Figure 10. The range of scores does not vary greatly. Compared to the first few trials with the step pattern, the learning effect here is very small. This is because users are already familiar with the delay. The small learning effect comes from the users not being used to a random path. As seen in Figure 10, the learning effect is most significant in the third trial. However, users on average do worse on the fourth and fifth trials. By this time,
Set I
users could be bored with the experiment and may no longer concentrate on trying to improve their score. Another explanation is that by the third random path, additional simulations no longer have any learning effect. Thus, the scores for the fourth and fifth random paths should be very close to the scores for the third random path, which they are. As with the step patterns, the delay has a large impact on the user's performance. The average score for trials with a one second delay was 46.0. The average score for trials with no delay was 13.4.
Figure 10. Graph displaying the average score for each of the five trials for the random path experiments.
6 Future work
The main purpose of the delay simulator was to use it to aid in the teaching of the concept of delays in supply chains. Hopefully it will be used in System Dynamics courses in the future.
Scores for random path trials
50 49 48 047 00 *" 46 45 44 43 E--0 1 2 3 4 5 6 Trial I I
In addition to using the delay simulator in its current form to teach, professors and students can also use it to perform different types of experiments. The delay simulator was developed so that it would be very easy for someone to customize demand paths and thus be able to customize their own experiments. It might be interesting to see if the learning effect changes based on which path the user is exposed to. This could be done by testing users with only one type of path then testing a separate group of users with a different type of path and comparing the two results.
Those with programming experience should find it easy to make modifications to the delay simulator. While I didn't find it necessary to include any other features, others might feel differently and want to add a feature for their own purposes. They would simply need to make a few changes to the source code, which should be readily available to them.
The delay simulator was only one example of a management flight simulator. It would be ideal if many additional management flight simulators were developed for different types of concepts. Hopefully, future developers will be able to look at my work
7 References
[1] N. Levenson, "An Investigation of Therac-25 Accidents," IEEE Computer, vol. 26, no. 7, pp. 18-41, 1993.
[2] R. Miller, "Introduction to Usability," [Online document], 2005 Sept 7, [cited 2006 May 4], Available HTTP: http://groups.csail.mit.edu/uid/6.831/lectures/L1 .pdf [3] J. Nielsen, "Ten Usability Heuristics," [Online document], [cited 2006 May 4],
Available HTTP: http://www.useit.com/papers/heuristic/heuristic-list.html
[4] M. Paich, J. Sterman, "Boom, Bust, and Failures to Learn in Experimental Markets," Management Science, vol. 39, issue 12, pp. 1439-1458, 1993.
[5] J. Sterman, Business Dynamics: Systems Thinking and Modeling for a Complex World, McGraw-Hill, 2000.
[6] J. Sterman, L. Sweeney, "Bathtub Dynamics: Initial Results of a Systems Thinking Inventory," System Dynamics Review, vol. 16, issue 4, pp. 249-286, 2000. [7] J. Sterman, L. Sweeney, "Cloudy Skies: Assessing Public Understanding of Global
A Consent form
CONSENT TO PARTICIPATE IN NON-BIOMEDICAL RESEARCH
Usability and Effectiveness of Management Flight Simulators
You are asked to participate in a research study conducted by Bruce DiBello and Professor John Sterman, from the System Dynamics Group at the Massachusetts Institute of Technology (M.I.T.). The results will be used in Bruce DiBello's Masters thesis. You were selected as a possible participant in this study because you are a MIT undergraduate or graduate student. You should read the information below, and ask questions about anything you do not understand, before deciding whether or not to participate.
* PARTICIPATION AND WITHDRAWAL
Your participation in this study is completely voluntary and you are free to choose whether to be in it or not. If you choose to be in this study, you may subsequently withdraw from it at any time without penalty or consequences of any kind. The investigator may withdraw you from this research if circumstances arise which warrant doing so.
- PURPOSE OF THE STUDY
The purpose of the study is to evaluate the usability and effectiveness of a Management Flight Simulator.
* PROCEDURES
If you volunteer to participate in this study, we would ask you to do the following things: Familiarize yourself with the Management Flight Simulator. Run a few simulations. Give feedback on your experience. The entire process should take less than one hour.
* POTENTIAL RISKS AND DISCOMFORTS
The simulator interface may be difficult or frustrating to use. If so, this is the simulator's fault. You should not feel that any problems you encounter are your fault.
. POTENTIAL BENEFITS
You will receive little benefit from this experiment. You may learn a managerial concept that you previously did not know.
If the simulator is successful, it will be used by professors to help teach concepts. Other simulators will also be developed.
- PAYMENT FOR PARTICIPATION
You will not receive any payment for your participation.
- CONFIDENTIALITY
Any information that is obtained in connection with this study and that can be identified with you will remain confidential and will be disclosed only with your permission or as required by law.
No personally identifiable information will be stored. Results from tests will not contain any user information. Saved file names will not have any reference to users.
- IDENTIFICATION OF INVESTIGATORS
If you have any questions or concerns about the research, please feel free to contact Principle Investigator: Bruce DiBello
617-642-7657 dibelloLamit.edu Faculty Sponsor: Professor John Sterman
617-253-1951 jsterman wymit.edu
* EMERGENCY CARE AND COMPENSATION FOR INJURY
In the unlikely event of physical injury resulting from participation in this research you may receive medical treatment from the M.I.T. Medical Department, including emergency treatment and follow-up care as needed. Your insurance carrier may be billed for the cost of such treatment. M.I.T. does not provide any other form of compensation for injury. Moreover, in either providing or making such medical care available it does not imply the injury is the fault of the investigator. Further information may be obtained by calling the MIT Insurance and Legal Affairs Office at 1-617-253 2822.
- RIGHTS OF RESEARCH SUBJECTS
You are not waiving any legal claims, rights or remedies because of your participation in this research study. If you feel you have been treated unfairly, or you have questions regarding your rights as a research subject, you may contact the Chairman of the Committee on the Use of Humans as Experimental Subjects, M.I.T., Room E32-335, 77 Massachusetts Ave, Cambridge, MA 02139, phone 1-617-253 6787.
SIGNATURE OF RESEARCH SUBJECT OR LEGAL REPRESENTATIVE I understand the procedures described above. My questions have been answered to my satisfaction, and I agree to participate in this study. I have been given a copy of this form.
Name of Subject
Name of Legal Representative (if applicable)
Signature of Subject or Legal Representative Date
SIGNATURE OF INVESTIGATOR
In my judgment the subject is voluntarily and knowingly giving informed consent and possesses the legal capacity to give informed consent to participate in this research study.
B User manual
B.1 Starting the app
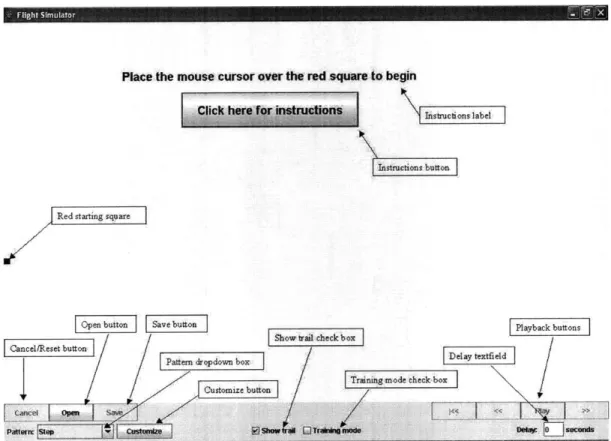
The delay simulator is an executable Jar file. In order to run the application, the user simply needs to run the Jar file. Figure B1 shows a screenshot of the application when it is first started. Note the labels on all of the components in Figure B . I will be referencing the components by these labels throughout the rest of the manual.
Place the mouse cursor over the red squae to begin
Click hene for tiotruction
Red starting sqtrare
Open button Save button Playback buttons
Cancel/Reset [ibet[Patt-m button]
dropdswn bos Delay textfield Trainingsnode check box
Customize button igmdchkbo
Cancl' OpOOn
Pattemn kShwalera LITtah tnWnM Detewr seCondt
Figure B1. A screenshot of the delay simulator when it is first started. All of the components are labeled.
B.2 Description of Components
B.2.1 Instructions label
This label simply informs the user how to start the simulation. Initially it says "Place the mouse cursor over the red square to begin." Once the mouse cursor enters the
red square, the instructions label changes to "Begin in 3" and counts down to 1. The simulation starts if the user leaves the mouse cursor in the red square for approximately two and a half seconds. If the mouse cursor ever leaves the red square, the instructions label changes back to "Place the mouse cursor over the red square to begin."
B.2.2 Instructions button
Clicking on the instructions button brings up a popup window containing brief instructions for how to use the delay simulator. This window can be seen in Figure B2.
Figure B2. The instructions popup window that appears when the user clicks the instructions button.
B.2.3 Red starting square
The red starting square is on the left of the screen. The simulation starts when the mouse cursor remains in the red square for approximately two and a half seconds. The
supply and demand paths start from the position of the red square. The red square's position may move slightly based on which demand pattern the user has selected.
B.2.4 Cancel/Reset button
During a simulation, the Cancel/Reset button says "Cancel." The user can click this button to stop the simulation and return to the starting screen. During playback, the Cancel/Reset button says "Reset." Again, the user can click this button to return to the starting screen. This action cannot be undone. Once the user cancels a simulation or resets back to the starting screen, the data from the previous simulation is permanently
deleted.
B.2.6 Save button
While in the starting screen, the Save button is disabled. This is because the user must first complete a simulation before being able to save it. The Save button will be discussed in more detail later.
B.2.5 Open button
Users can click the Open button to view a previously saved simulation. A file chooser window appears that allows the user to select exactly which file to open. If the file is a valid saved simulation, the delay simulator will switch to playback mode. The user can then use the playback controls to view the open simulation. If the file was not a valid saved simulation, the user will get an error message.
B.2.7 Pattern dropdown box
The pattern dropdown box is used to select which type of pattern the demand path will follow. The current options are Step, Ramp, Sine wave, Random walk, Mystery, Random 1, Random 2, Random 3, Random 4, Random 5, and Random 6. Step is a step
function. Ramp starts off completely horizontal then has an upward slope then finishes horizontal. Sine wave is a sine wave that starts up with equal probability as down. Random walk is a completely random path. Mystery combines properties of each of the four previously listed patterns. Random 1 through 6 are preset random paths that are the same every time. These paths can be seen in Figure B3.
(1)
(3)
(4)
(6)
B.2.8 Customize button
Users can change certain properties for a few of the patterns by clicking on the Customize button. Figure B4 shows a popup window that appears when the user clicks the Customize button. Users can adjust the height of the Step pattern, the slope of the Ramp pattern, or the amplitude of the Sine pattern. For each of these values, 5 is the default value. Users can enter a number between 0 and 10 to decrease or increase the value.
Step:
step
height.F[ (o-1o)
Ramp: slope* E_ (0-10) Sine: amplitude 5
|(0-
10)Figure B4. The popup window that appears when the user clicks the Customize button.
B.2.9 Show trail check box
By default, the show trail check box is checked. When this is the case, the path that the user has created thus far for the supply path is displayed during the simulation. When the check box is not checked, the user can only see the current position of the check box. The demand path is not affected by either case. When a user is able to see exactly how well he or she is doing, that could potentially have an affect on the rest of the simulation.
B.2.10 Training mode check box
By default, the training mode check box is not checked. When this is the case, the
simulation runs regularly. When the training mode check box is checked, the demand
path is not displayed during simulation. Also, the delay is zero regardless of what the user
entered for the delay. The purpose of training mode is simply for new users to become
familiar with how the simulation is going to run, and how the screen position of the
cursor is affected by the mouse, before running an actual simulation.
B.2.11 Playback buttons
The playback buttons are disabled in the starting screen. They will be described
later.
B.2.12 Delay text field
The delay text field is used to set the supply path delay for simulations. The user
simply enters a number into the text field before starting a simulation. Just before the
simulation starts, the number in the text field is checked. If it is a valid number, the
simulation runs with that number as the supply path delay. If it is an invalid number
(negative, contains letters or other symbols, etc.), the user receives an error message.
Figure B5 shows the message displayed to the user.
B.3 Running the app
Once a simulation begins, two paths, a red supply path and a black demand path,
start to move across the screen from left to right. The demand path follows the pattern
selected prior to the start of the simulation. The supply path follows the movement of the
mouse with an additional delay as entered prior to the start of the simulation. The goal is
to keep the two paths as close together as possible. During simulation, the mouse cursor
is hidden so the user can only rely on the location of the supply path to determine where
the cursor is. The simulation ends once the paths reach the right edge of the window.
Simulations can be canceled by clicking on the Cancel button. Figure B6 shows a running
simulation.
/
Demand pathPmSthowtrai I raivawrg mode DOW.
seconds
B.4
Description of playback controls
Once a simulation ends, the delay simulator goes into playback mode. Figure B7 shows a screenshot of the simulator in playback mode.
Phase plot]
Derand'Pathi Sp lspath
Mouse position
Show mouse position check box
Show phase plot check box
Figure B7. Screenshot of the simulator in playback mode.
B.4.1 Playback buttons
The playback buttons are enabled in playback mode. Clicking the Play/Pause button begins the playback of the simulation. The paths move across the screen at the same rate as during simulation. Clicking the Play/Pause button to begin playback changes the text of the button from "Play" to "Pause." Clicking the button again pauses the simulation and changes the text from "Pause" to "Play." The full rewind button (<<) can be clicked to reset playback to the very beginning. The fast-forward (>>) and rewind (<<) buttons quickly animate the playback forwards or backwards respectively. They are
click-PlW& Taraet I I I
ii
I 1 Iand-hold buttons. The user has to hold the mouse button down after clicking on them in order to keep fast-forwarding or rewinding.
B.4.2 Show mouse position check box
By default, this check box is unchecked. When it is checked, an additional blue path appears during playback. This blue path shows the actual mouse position during simulation. If there was no delay, the blue path is overlapped by the red path. If there is a delay, the blue path will be the red path shifted to the left. This can be useful in seeing how users react when they see the results of their previous actions. For example, a user may continue moving the mouse up until he or she sees that the red supply path has moved above the black demand path at which point he or she will move the mouse down.
B.4.3 Show phase plot check box
By default, this check box is unchecked. When it is checked, a phase plot appears in the upper left corner of the window. If the show mouse position check box is checked,
a blue path representing the mouse position will also be in the phase plot.
B.4.4 Score
As soon as a user completes a simulation, the score for that simulation is computed as the mean absolute deviation between demand and supply. It is displayed in the lower right corner of the window. Lower scores are better, with a perfect score being 0.0. The score is the average number of pixels that the two paths were from each other at any point during the simulation. A score of 40 means that the two paths were approximately 40 pixels apart at any point during the simulation.
B.4.5 Reset button
Clicking the Reset button returns to the starting screen. This action cannot be undone.
B.4.6 Open button
Similar to the starting screen, clicking the Open button allows a user to open and view a previously saved simulation.
B.4.7
Save button
Clicking the Save button allows a user to save the last simulation. A file chooser appears that allows the user to name the file and place it anywhere in the file system. A user can view the simulation later by opening the saved file.