Developing a Robust Harvest for High Cell Density CHO Cell
Culture
by
Nicole Ann Oliver
B.S., Biological Engineering, Northwestern University, 2014
Submitted to the MIT Sloan School of Management and the MIT Department of Biological Engineering in Partial Fulfilment of the Requirements for the degrees of
Master of Business Administration and Master of Science in Biological Engineering in conjunction with the Leads of Global Operations Program at the
MASSACHUSETTS INSTITURE OF TECHNOLOGY May 8, 2020
@ 2020 Nicole Oliver. All rights reserved
Signature of Author……… MIT Sloan School of Management MIT Department of Biological Engineering May 8, 2020 Certified by...
Roy Welsch, Thesis Supervisor Professor of Statistics and Management Science, MIT Sloan School of Management Certified by...
Douglas Lauffenburger, Thesis Supervisor Ford Professor of Biological Engineering, Chemical Engineering, and Biology Accepted by...
Maura Herson, Assistant Dean, MBA Program MIT Sloan School of Management Accepted by...
Katharina Ribbeck, Chair, Graduate Program Committee Professor of Biological Engineering
Developing a Robust Harvest for High Cell Density CHO Cell
Culture
by Nicole Oliver
B.S., Biomedical Engineering, Northwestern University, 2014
Submitted to the MIT Sloan School of Management and MIT biological Engineering on May 8, 2019, in partial fulfillment of the requirements for the degrees of Master of Business
Administration and Master of Science in Biological Engineering
Abstract
The biotechnology industry relies on living organisms (e.g., mammalian cells) in the production of therapeutically beneficial products. Significant developments within the biotechnology industry have focused on maximizing the productivity of these living organisms. One such development is perfusion culture manufacturing, the continual addition of nutrients and removal of waste. Perfusion culture processes offer the potential of increased cell density compared to fed-batch, allowing for smaller facility footprints.
The high cell densities resulting from perfusion processes give rise to challenges when harvesting the product from cell culture. Many harvest technologies cannot support high cell densities because they would require large footprints and/or would result in low yields.
Microfiltration-based tangential flow filtration (TFF) and alternating flow filtration (ATF) best support high cell densities by maintaining high product yield and a small-manufacturing footprint. However, ATF/TFF membranes readily foul (i.e., the deposition of particles within membrane pores or on the membrane surface), leading to variable product sieving.
The study sought to understand the impact of particle size on TFF fouling through a series of filtration experiments. Perfusion cell culture supernatant was fractionated by particle size and filtered using TFF under varying operating conditions. The resulting pressures and sieving were measured to quantify fouling and its consequences.
The results demonstrated that the degree of fouling is dependent on particle size. Generally, increasing the particle size is associated with increased fouling and decreased harvest yield (18.31% decreased in harvest yield per 1 µm increase in particle size). Particles less than 0.1 µm are an exception to the general rule: these particles exhibited significant fouling, suggesting that underlying particle chemistry also contributes to aggregation and fouling.
The findings support decreasing ‘problematic’ particle sizes – particles less than <0.1 µm and greater than 1 µm – to decrease fouling and increase harvest yield. Possible solutions to reduce such cell debris include engineering cells with higher viability, pre-filtering the feed solution, reducing shear from the pump, and shifting harvest earlier.
Acknowledgments
I want to first thank my MIT academic advisors, Douglas Lauffenburger and Roy Welsch, for their advice and mentorship throughout the project. I am privileged to have learned from them. Second, I want to thank Amgen Inc. for providing the opportunity, resources, and support to work on such a challenging and exciting project. I especially want to thank my supervisors: Glen Bolton, Kyle McElearney, and Nick Marchand. Their advice and mentorship were essential to the success of the project.
I am also grateful for the support structure at Amgen Inc. I want to thank Dollie Grajczak, who ensured our experience was enriching and enjoyable from start to end. I also want to thank Aine Hanley, the LGO executive sponsor at Amgen Inc. Her active involvement in our projects and championship of the LGO program enhanced our internship experience. Finally, I would like to thank MIT LGO alumni at Amgen Inc., who went above-and-beyond in helping us navigate the internship.
Special thanks to my fellow off-cycle Amgen Inc. interns, Aaron Baskerville-Bridges, Or Dan, and Zoe Wolszon. They provided continuous feedback and insights and inspired me to become a better leader and professional. I cannot imagine doing this work without them.
I also want to thank the MIT LGO program. The program has been a life-changing experience because of the supportive staff and amazing students. I would like to especially thank Thomas Roemer, Patty Eames, Ted Equi, and Anna Voronova.
Finally, I want to thank my family and friends who have been immensely supportive throughout my time at MIT.
Table of Contents
Chapter 1: Introduction ... 13
A. Project Motivation ... 13
B. Problem Statement... 15
C. Hypothesis Statement and Research Methodology ... 17
D. Scope and Limitations ... 18
E. Thesis Overview ... 19
Chapter 2: Problem Background ... 20
A. Biomanufacturing ... 20
i. Cell Line Development (Pre-Manufacturing) ... 21
ii. Upstream Process ... 22
iii. Downstream Process ... 22
B. Bioreactor Processes ... 23
i. Fed-Batch ... 24
ii. Perfusion Culture ... 24
C. Harvest Technologies ... 26 D. Fouling Principles ... 29 i. Concentration Polarization ... 30 ii. Fouling ... 31 E. Fouling Models ... 33 F. Fouling Factors ... 34 i. Feed Inputs ... 35
ii. Operational Inputs ... 38
iii. Raw Material Inputs ... 41
Chapter 3: Materials and Methods... 43
A. Experiment Overview ... 43
B. Step 1: Separation of Cell Culture Supernatant by Size ... 44
i. Centrifuge Cells ... 44
ii. Fractionate Supernatant... 44
iii. Verify Particle Size Fractions ... 52
C. Step 2: Filter Supernatant Fractions Under Varying Conditions ... 53
i. Design of Experiment (DOE) ... 54
ii. Overall Set-up ... 57
iii. Materials and Equipment ... 58
iv. Detailed Protocol ... 61
D. Step 3: Polystyrene Microspheres Filtered using TFF ... 63
Chapter 4: Results ... 65
A. Step 1: Results of Fractionation ... 65
ii. Main Effect Plots ... 70
iii. Model Analysis ... 75
iv. Evaluation of Hypothesis ... 80
v. Business Implications... 81
vi. Fraction <0.1 µm ... 86
C. Step 3: Polystyrene Microspheres Filtered using TFF ... 89
Chapter 5: Conclusion ... 94
Appendices ... 96
Appendix A: Loading Experiment ... 100
Appendix B: Antibiotic Experiments ... 101
List of Figures
Figure 1-1. Scope of Work……….………..XX
Figure 2-1. Biomanufacturing Process………XX Figure 2-2. Fed-Batch vs. Perfusion Culture………XX Figure 2-3. Dead-end vs. Crossflow……….……XX Figure 2-4. ATF and TFF……….……XX Figure 2-5. Concentration Polarization………...……….……XX Figure 2-6. Fouling Modes…………..………...……….……XX
Figure 3-1 (A and B). Fractionation Line 1 and 2………...……….……XX Figure 3-2. Dead-end Filter Set-up.…………..………..………….……XX Figure 3-3. Crossflow Filter Set-up….…………..………..………….…XX Figure 3-4. Freeze-Thaw Cycle….….…………..………..………….…XX Figure 3-5. DynaPro NanoStar…….….…………..………..…………..XX Figure 3-6. Filtration Set-up………XX Figure 3-7. Levitronix Pump………XX Figure 3-8. Hollow Fiber Cartridge………..………XX Figure 3-9. IgG Assay………..………XX
Figure 4-1. TMP Categorization……….……….XX Figure 4-2. Harvest Calculation………...………XX Figure 4-3. Main Effect Plots………...XX Figure 4-4. Cell Density versus Titer Trade-off………...XX Figure 4-5. Delta Titer versus Delta Production Bioreactor Duration………..XX Figure 4-6. TMP Curves for Run 2 and Run 25………XX Figure 4-7 (A and B). Microsphere vs. Supernatant (Pair 1 and 2)………..XX
List of Tables
Table 1-1. Operating Conditions………..………XX
Table 2-1. Downstream Methods……….XX Table 2-2. Harvest Technologies……….XX Table 2-3. Fouling Factors………..……….XX
Table 3-1. Operating Conditions……….……….XX Table 3-2. Separation of Cell Culture Supernatant..……….XX Table 3-3. Operating Conditions………..XX Table 3-4 (A and B). Full Factorial and Final DOE……….XX Table 3-5. Filter Flush………..XX Table 3-6. Flux Ramp-up……….XX Table 3-7. Microsphere Operating Conditions……….XX
Table 4-1. Dynamic Light Scattering (DLS) Results………XX Table 4-2. Model Results (with Fraction <0.1 µm)……….XX Table 4-3. Model Results (without Fraction <0.1 µm)……….XX Table 4-4. Model Results (Independent Fractions)………..XX Table 4-5. Microsphere Operating Conditions……….XX Table 4-6. Microspheres vs. Supernatant……….XX
List of Equations
Equation 2-1. Darcy’s Law……….………….XX Equation 2-2. Hermia’s Blocking Law (Flux Decline to Fouling Mode)……….XX Equation 2-3. Hermia’s Blocking Law (Volume Decline to Fouling Mode)………..XX Equation 2-4. Hermia’s Law Modified for Crossflow……….XX Equation 2-5. Darcy’s Law……….………….XX Equation 2-6. Darcy-Wesibach Equation………XX Equation 2-7. Design of Experiment (DOE) Model………XX
Equation 4-1. Transmembrane Pressure (TMP) Calculation………...……XX Equation 4-2. Darcy’s Law………...………...XX Equation 4-3. Average TMP Calculation………XX Equation 4-4. Sieving Calculation………...XX Equation 4-5. Relationship between Factors and TMP………XX Equation 4-6. Relationship between Factors and Sieving………XX Equation 4-7. Relationship between Factors and Harvest Yield………..XX Equation 4-8. Darcy’s Law………...………...XX Equation 4-9. Stoke’s Law………..…………XX Equation 4-10. Titer and Cell Debris Trade-off (Approximation).………..XX Equation 4-11. Bioreactor Duration (Approximation)………XX Equation 4-12. Design of Experiment (DOE) Model………..………XX Equation 4-13. Stoke’s Law………..………..…………XX
Chapter 1: Introduction
A. Project Motivation
Amgen is a leading biotechnology company that develops and produces medicines for patients with serious illnesses. Biotechnology “refers to the use of biological systems (e.g., cells or tissues) or biological molecules (e.g., antibodies) for/in the manufacture of commercial products” [1]. The application of biological processes has revolutionized industries, from agriculture to pharmaceuticals. With the advent of recombinant DNA and hybridoma technology in the 1980s, biopharmaceutical companies could produce therapeutic proteins and peptides that treated diseases that small molecules could not (e.g., insulin for diabetes).
Biological knowledge has only continued to expand, enabling further healthcare innovation and a rapid increase in the number of first-in-class and best-in-class therapies. With exponential biotechnological progress came exponential market growth: starting from modest beginnings in the mid-1980s, the industry is now valued at over $100 billion and is comprised of over 10,000 companies [1]. Though the biopharmaceutical industry is continuing to grow, the landscape is becoming increasingly competitive for individual firms as companies tackle more challenging, niche diseases. The average cost to develop a new product increased from $1.19 billion in 2010 to $2.17 billion in 2017 [2]. Concurrently, the rate of return on biopharmaceutical R&D investments decreased from 10.1% to 3.2% from 2010 to 2017 [2].
In an increasingly competitive market, Amgen recognizes manufacturing as a differentiating capability. Amgen invests heavily in advancing internal biomanufacturing capabilities to both increase production
capacity and reduce cost. From 2014 to 2018, Amgen surpassed its commitment to reducing its manufacturing footprint by 23% by implementing higher efficiency processes (i.e., “next-generation biomanufacturing”) [3]. Next-generation biomanufacturing increases cell culture density in the production bioreactor and productivity (mg of product/L of culture), thereby increasing production capacity per batch. With improved capacity, Amgen is better able to deliver “the right drug to the right patient every time.”
Next-generation biomanufacturing relies heavily on perfusion processes to cultivate denser and more productive cell cultures. Cell cultures are commonly grown using fed-batch or perfusion processes. Fed-batch culture adds nutrients in a base medium and replenishes nutrients at discrete points once they are depleted. Perfusion processes, in contrast, continuously circulates media, simultaneously removing waste and adding nutrients. The product is either harvested continuously or retained within the bioreactor until peak cell density is reached. Approximately five-times more product is produced per volume using perfusion processes compared to fed-batch processes. With greater volumetric
productivity, a smaller manufacturing footprint is needed, thereby lowering capital expenditures.
Furthermore, Pollock et al. estimated a 20% reduction in the cost of goods using perfusion processes [4].
The high cell densities resulting from perfusion processes give rise to challenges when harvesting the product from cell culture (henceforth known as “harvest”). Many harvest technologies used in fed-batch processes cannot support perfusion cultures with viable cell densities approaching 108 cells/mL and cell
viabilities ranging from 50 to 80%. These technologies are not suited for high cell densities because they would require prohibitively large footprints (e.g., dead-end) and/or would result in prohibitively low yields (e.g., expanded bed chromatography). Microfiltration-based tangential flow filtration (TFF) and
alternating flow filtration (ATF) best support high cell densities by maintaining high product yield and a small-manufacturing footprint. TFF and ATF are forms of crossflow microfiltration, meaning the feed stream flows in parallel to a permeable membrane. The permeate stream containing the molecule of interest flows perpendicularly through the membrane, driven by transmembrane pressure.
The most significant challenge with TFF/ATF is fouling, the deposition of particles within membrane pores or on the membrane surface. Membrane fouling increases resistance to fluid flow, which manifests in an increase in transmembrane pressure (TMP) and/or a decrease in permeate flux. With lower permeate flux, product sieving decreases, leading to low product yields. TMP may also surpass operational limits, requiring filter change-out before harvest can proceed. Overall, fouling limits process robustness and increases manufacturing costs via inconsistent yields and/or filter change-out. Numerous factors influence fouling, including feed inputs (e.g., cell viability; cell culture additives), operational inputs (e.g., crossflow; permeate flux), and raw material inputs (e.g., fiber material; fiber porosity), but the interrelation between these factors is not well-understood. Hence, fouling remains an unsolved, challenging, and widespread problem.
B. Problem Statement
Cell culture with higher densities and/or lower viability has been empirically associated with greater fouling in ATF/TFF. Solutions with higher concentrations of cell debris have a greater propensity to attach to membranes and are associated with a more rapid decline in sieving [5]. In contrast, viable cells have been shown not to cause fouling [6]. The results invite the obvious question: why are cell debris associated with fouling? The answer to this question will enable process development scientists to develop solutions to reduce fouling from cell debris.
Concerning filtration efficiency, cell debris differs in size, shape, and chemistry, which may contribute to membrane fouling in ATF/TFF. Cell debris is composed of particles primarily ranging from <1 nm to 1000 nm, which may block or clog membrane pores of the same magnitude. The shape of the particles is also irregular; filters are typically rated for spherical particles, so irregular shapes may more readily enter and block membrane pores [7]. Finally, lysed cells (i.e., broken cell membrane) expose particles of varying zeta potential, such as DNA, that may more readily attach to the membrane surface. Literature does not elucidate the impact of cell debris shape, size, or chemistry on membrane fouling. Hence, we decided to investigate one of these elements: particle size. The other elements are out-of-scope but are opportunities for future work.
Previous studies often investigate one fouling factor without considering its dependency on other variables, which limits the utility of the findings. Varying particle size while holding other variables constant only reveals the impact of particle size for one condition. Thus, we chose to conduct a
multivariate study, varying particle size along with membrane pore size and permeate flux. If fouling is dependent on particle size, membrane pore size will likely dictate which particle size causes fouling (e.g., small particles may not foul membrane with large pores). Numerous studies have also
demonstrated the importance of flux on fouling [8][5].
To summarize, we decided to investigate the impact of particle size on fouling under varying TFF operating conditions (pore size, flux). Our investigation will address the following problems: 1) it will reveal the relationship between particle size and membrane fouling, which is currently unknown, and 2) it will be translatable across multiple operating conditions, unlike one-dimensional fouling studies.
C. Hypothesis Statement and Research Methodology
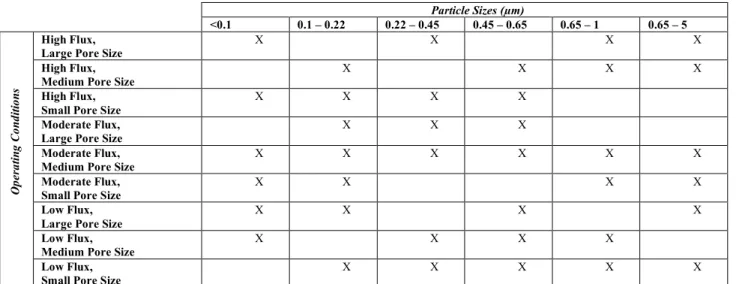
We hypothesized that: 1) the degree of fouling is dependent on particle size, and 2) for a given particle size fraction, the extent of fouling is impacted by pore size and/or flux. We tested our hypothesizes empirically. Cell culture supernatant was fractionated by particle size and then filtered using TFF while varying the permeate flux and filter pore size (Table 1-1). The resulting pressures and sieving were measured to quantify fouling and its consequences. The study was constructed as a fractional factorial experiment (i.e., design consist of a carefully chosen subset of the experimental runs) following Design of Experiment (DOE) principles. The design enabled us to discern the effect of each factor on fouling, as well as the effects of interactions between factors on fouling. Chapter 3 describes the experiment in further detail. Particle Sizes (µm) <0.1 0.1 – 0.22 0.22 – 0.45 0.45 – 0.65 0.65 – 1 0.65 – 5 Op era tin g C on di tio ns High Flux,
Large Pore Size X X X X
High Flux, Medium Pore Size
X X X X
High Flux, Small Pore Size
X X X X
Moderate Flux,
Large Pore Size X X X
Moderate Flux, Medium Pore Size
X X X X X X
Moderate Flux,
Small Pore Size X X X X
Low Flux, Large Pore Size
X X X X
Low Flux, Medium Pore Size
X X X X
Low Flux, Small Pore Size
X X X X X
Table 1-1. Operating Conditions. Each particle size fraction was filtered under varying operating
conditions – specifically, flux and filter pore size. The levels of each factor were as follows: particle size fraction – 6 levels; flux – 3 levels; and pore size – 3 levels. A fractional factorial design was conducted, with the runs selected designated by X. A subset of the selected runs was also replicated.
D. Scope and Limitations
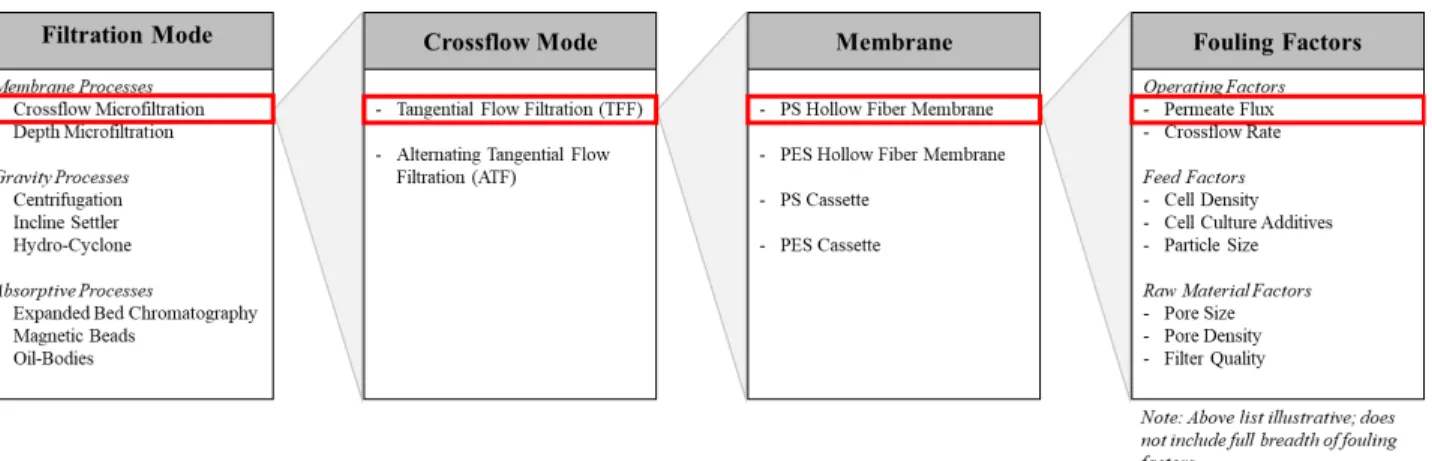
To conduct the study within the internship time constraints, the scope of work was limited in the following dimensions (Figure 1-1):
1) Harvest Technology: Crossflow microfiltration because it best supports high cell densities from perfusion processes while also maintaining a small manufacturing footprint.
2) Crossflow Mode: We focused on TFF for several reasons. First, TFF equipment supports membranes with small filtration areas, and thus TFF requires less feed material than ATF. Second, unidirectional flow is less complex to model than bidirectional flow. Hence, TFF is logically studied first; the ATF model can then be built upon the TFF model. Third, TFF equipment allows for higher crossflow rates than current ATF equipment, which enables conditions that may reduce fouling. For this reason, Amgen is exploring TFF as an alternative to ATF.
3) Membrane Type and Material: We limited the study to polysulfone (PS) hollow fiber membranes in alignment with Amgen protocol. PS is a standard membrane material for the biotechnology industry. Hollow fiber modules are used over cassettes because cassettes increase shear, which is thought to be harmful to cells.
4) Fouling Factors: Fouling factors we decided to investigate are particle size, pore size, and permeate flux (see Appendix A).
Figure 1-1. Scope of Work. The schematic illustrates the scope of work. The scope of work was defined
by sequentially selecting the filtration mode, crossflow mode, membrane, and fouling factors.
E. Thesis Overview
The thesis is organized into five chapters. The first chapter introduced the project motivation and scope. The second chapter reviews the project background and relevant literature. The third chapter covers the experiment design and data analysis methodology. The fourth chapter discusses the project results. Finally, the fifth chapter reviews the project conclusions and next steps.
Chapter 2: Problem Background
A. Biomanufacturing
Biomanufacturing utilizes biological systems to produce therapeutically-important biomolecules, including monoclonal antibodies, peptides, and Car T cells. The biomanufacturing process is divided into upstream and downstream processes (Figure 2-1). During upstream processing, the cell line is grown to high densities in shake flasks and bioreactors of increasing volume to generate enough cell mass to inoculate the production bioreactor. Within the production bioreactor, cells are grown to even higher densities, after which the desired protein is harvested from the cell culture for downstream processing. During downstream processing, the therapeutic protein is purified (e.g., to remove cell debris, host-cell proteins, viruses, and non-native proteins) and the final product is formulated. The upstream and downstream processes are reviewed in further detail below.
Figure 2-1. Biomanufacturing Process. The schematic illustrates the biomanufacturing process. The
upstream process includes the first step through harvest, while the downstream process includes all purification steps [9].
i. Cell Line Development (Pre-Manufacturing)
Chinese Hamster Ovary (CHO) cell lines are the preferred expression platform for therapeutic proteins for several reasons. 1) CHO cells readily grow in suspension culture in serum-free media [10]. 2) They produce proteins similar to those produced in humans – i.e., complex proteins with post-translational modifications, including glycosylation. 3) CHO cells also secrete the final protein, eliminating the need to lyse the cells and subsequently refold the protein [11]. 4) Finally, few human viruses are able to grow within CHO cell culture. Because of their known safety profile, CHO cells require less regulatory effort compared to novel expression platforms.
Before clinical development, the cell line is developed and optimized for the production of the final product. A CHO cell lines is transfected with the genes necessary to produce the desired therapeutic protein. The transfected cells are cloned and expanded, and top clones are selected based on their product quality, yield, growth rate, and viability. The expansion and selection processes are repeated, ultimately narrowing the pool to the optimal cell line. The optimal cell line is cryopreserved in numerous vials or bags for commercial production. The cryopreserved vials/bags are known as the Master Cell Bank (MCB) – the initial therapeutic-producing cell line. From one vial of the MCB, several hundred Working Cell Banks (WCB) are produced. To initiate a manufacturing run, one vial of the WCB is thawed and propagated. The purpose of the MCB and WCB is to prevent genetic variation and potential contamination.
ii. Upstream Process
The upstream process is initiated by thawing one vial/bag from the Working Cell Bank – the vial/bag contains cells optimized to produce the desired therapeutic protein. The cells are propagated in a series of increasingly larger containers (e.g., T-flasks, shake flasks, small scale bioreactors). The purpose of the propagation process, also known as the seed train, is to generate an adequate number of cells for the inoculation of the production bioreactor [12]. After the production bioreactor is inoculated, the cell culture continues to grow, and the cells express the therapeutic protein. Finally, the therapeutic protein is separated from the cell culture using varying harvest technologies (Chapter 2, Section C: Harvest
Technologies). Throughout the upstream process, the extracellular conditions – including pH,
temperature, and nutrients – are regulated to maximize cellular growth and PQ.
iii. Downstream Process
The purpose of the downstream process is to purify the therapeutic protein. The downstream process can be divided into three stages. The capture/recovery stage immediately follows harvest. Though harvest partitions the product from cell culture, the harvest stream is contaminated with cell debris. The purpose of capture/recovery is to remove micron-sized particulate matter – including cell debris, growth media, and proteases – through depth filters or affinity chromatography resins. Post-capture/recovery, the stream is ~95% pure [13]. The intermediate purification stage follows capture/recovery and removes bulk containments, such as CHO proteins and viruses, most commonly using Protein A chromatography. Protein A, derived from Staphylococcus auereus, contains several domains that bind strongly with IgG and thus serve as highly-specific resins for IgG purification. Lastly, the polishing stage(s) removes any remaining impurities, including non-native forms of the protein. Common methods of capture,
purification, and polishing are reviewed in Table 2-1 (from [13]). After downstream processing, the purified drug product is sterilely formulated, filled, and finished. The fill/finish process is essential to maintain product safety and stability (i.e., prevent protein denaturation).
Step Method Attributes Benefits Limitations
Capture Chromatography Protein A Affinity High throughput
High purity High material cost
Capture Chromatography Other affinity ligands
(e.g., Protein G) High throughput Purity Regulatory acceptance Capture Simultaneous clarification
& capture
Cation exchange Low cost media Low throughput
Preconditioning required Capture Simultaneous clarification
& capture Expanded bed adsorption (EBA) Reduces unit operations Sensitive to feed variations & fouling Purification Chromatography Ion exchange Variety of selectivities
High capacity & robust Often flow rate limited Purification Adsorptive membrane Charged membranes High throughput contained,
trace contaminant removal Low capacities Table 2-1. Downstream Methods. Various technologies are used to capture and purify the product,
each with distinct advantages and disadvantages [13].
B. Bioreactor Processes
The biomanufacturing process hinges on productive, high-cell density cell cultures. Cell culture processes have improved in reliability and robustness since the inception of the modern biotechnology industry. Numerous advancements have contributed to the maturity of cell culture processes, including sensors for process control, improved cell line engineering and selection, and optimized culture
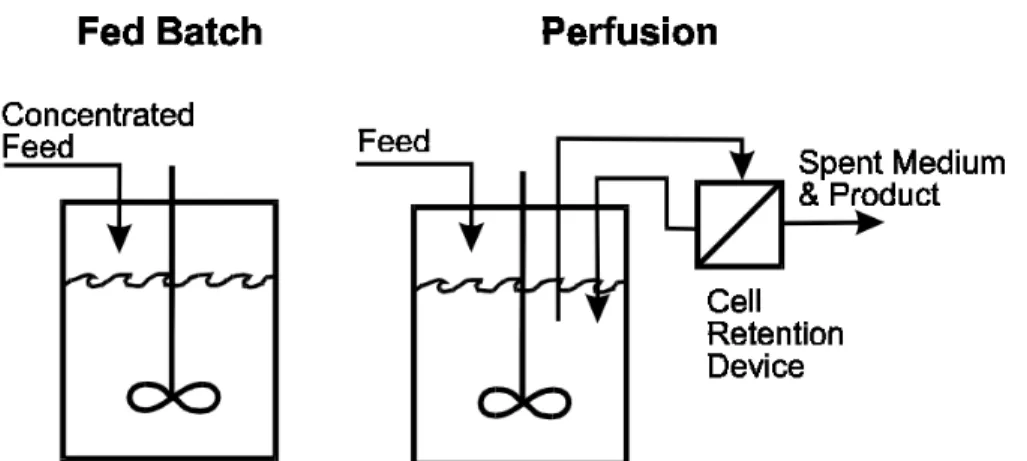
conditions [14]. Culture conditions, specifically the feed strategy within the production bioreactor, influence the harvest method and yield. The two-most dominant feed strategies are fed-batch and perfusion (Figure 2-2), each with notable advantages and disadvantages.
Figure 2-2. Fed-Batch vs. Perfusion Culture. Fed-batch and perfusion are two widely used culture
processes. Fed-batch adds feed in response to the depletion of one or more nutrients. Perfusion continuously replenishes nutrients and removes by-products [15].
i. Fed-Batch
Fed-batch culture adds nutrients in a base medium and replenishes nutrients at discrete points once they are partially depleted (e.g., 50% depletion). The product is subsequently harvested from the culture and purified using one of various harvest technologies (see Section C below). Fed-batch is often used for production of biologics because it is reliable and simple – both in implementation and operation. Pollock et al. used stochastic processes to simulate both fed-batch and perfusion culture [4]. Based on the
simulation results, they rated fed-batch and perfusion from 3 to 9 (3 = best, 9 = worst) on various attributes. Fed-batch received a rating of 3 for “ease of validation”, “ease of development”, and “ease of control/operation”. Perfusion culture received ratings of 8, 7, and 8 for these attributes, respectively. Though fed-batch is simpler, it is not without disadvantages. Fed-batch culture continuously deteriorates because by-products are not removed. Thus, fed-batch culture cannot grow to the densities achieved using perfusion processes and is not suitable for unstable products.
In perfusion culture, fresh media is continuously supplied, and by-products are continuously removed. Thus, perfusion is preferred for the production of proteins that are unstable in the presence of toxic by-products. Moreover, with perfusion, higher cell densities are achieved compared to fed-batch – 30-100 x 106 cells/mL versus 5-25 x 106 cells/mL [16].As a result, perfusion increases the overall yield, thereby
addressing capacity constraints. Finally, because of the increased productivity, a smaller manufacturing footprint is needed to produce large amounts of product. Thus, the capital costs to set-up a new line or plant are reduced, which allows for more flexibility in the manufacturing network.
Perfusion is operationally more complex than fed-batch because it necessitates a cell-retention device – a device that enables the exchange of metabolites without damaging the cells. Common cell-retention devices are crossflow membrane filters, spin-filters, inclined settlers, continuous centrifuges, and ultrasonic separators [15]. The reliability of the cell-retention device has historically been an obstacle to the adoption of perfusion processes. Common issues with cell-retention devices include:
• Non-alternating hollow-fiber crossflow filtration (i.e., tangential flow filtration, or TFF) clog at high-flux and cell density [15].
• Spin filters are also susceptible to clogging and are difficult to replace because the filter screen lies within the bioreactor [17].
• Inclined settlers are prone to cell adhesion, while vertical settlers are difficult to scale because the required area is proportional to the bioreactor volume [17].
• Centrifuges inflict significant shear stresses, which damage cells and lower overall viability [17]. • Ultrasonic separators are primarily used in small-scale operations and have yet to be successfully
Despite the notable challenges, the reliability of cell-retention devices has improved through iterations of the traditional designs and modulation of operating conditions. Most notably, alternating tangential flow filtration (ATF) reduces fouling compared to TFF. ATF has emerged as a favored cell-retention device because it possesses the benefits of TFF – scalability, repeatability, robustness – with the additional advantage of reduced fouling.
When comparing the economic feasibility of fed-batch and perfusion, all costs – including development, validation, and operation – need to be considered. Pollock et al. estimated the lifecycle costs of both fed-batch and perfusion [4]. They found that the initial capital expenditure was almost 50% lower for
perfusion compared to fed-batch. Perfusion also had lower cost of goods per gram (COGS) (media, etc.) – $31/gram compared to $39/gram for fed-batch. The lower COGS was attributed to the
“self-conditioning ability of cells and less bioreactor turnover” [17]. The self-“self-conditioning ability of cells leads to increased secretion of growth factors at higher cell densities, which allows for a lower
concentration of expensive media components [17]. However, fed-batch required less time and money in development and validation. Fed-batch was also superior when considering ease of control/operation and batch-to-batch variability [4]. Summing all costs, Pollock et al. calculated a 20% reduction in costs using perfusion compared to fed-batch. Their results are consistent with other studies – Shevitz et al. estimated a 45% to 20% reduction in costs using perfusion compared to batch and concentrated fed-batch, respectively.
C. Harvest Technologies
Numerous methods are utilized to harvest the product from cell culture, including membrane processes, gravity processes, adsorptive processes, and phase-separation processes (Table 2-2).
Membrane Processes Gravity Processes Adsorptive Processes Phase-Separation Processes
Crossflow Microfiltration
- ATF-XMF
- TFF-XMF
Depth Microfiltration
Disposable Rotary Drum Filter
Centrifugation Inclined Settler Hydro-Cyclone
Expanded Bed Chromatography
Magnetic Beads Oil-Bodies Magnetite
Aqueous Two-Phase Extraction
Table 2-2. Harvest Technologies. A variety of technologies are utilized to harvest product from cell
culture, including membrane, gravity, adsorptive, and phase-separation processes.
Figure 2-3. Dead-end vs. Crossflow. In dead-end filtration, the fluid flows directly through the filter. In
crossflow filtration, the filter flows parallel to the filter. Small particles permeate the filter driven by transmembrane pressure.
Membrane processes use filters to separate the product from cell culture based on particle size
exclusion. In depth-filtration, the cell culture flows directly through the filter (Figure 2-3). The product permeates the filter, while cells are excluded based on size. In contrast, in crossflow microfiltration (XMF), the cell culture flows parallel to the filter with micron-sized pores (Figure 2-3). The pressure in the outer lumen is greater than the pressure in the inner lumen, which drives the product through the filter. The cells are too large to permeate the filter and return to the bioreactor (the diameter of CHO cells is ~ 10 µm while the diameter of filter pore sizes is typically 30 kDa – 1 µm). Crossflow microfiltration reduces fouling compared to depth filtration because the parallel flow increases shear
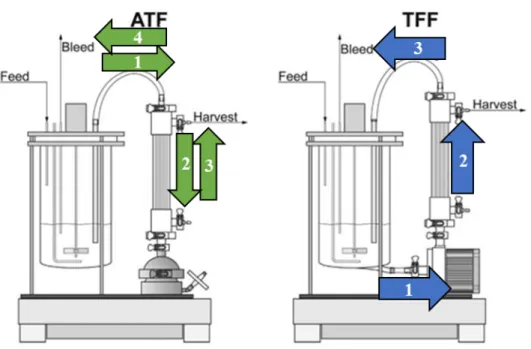
forces at the membrane surface. Consequently, a lower filtration area is needed using crossflow mode compared to dead-end mode. Alternating tangential flow (ATF) and tangential flow filtration (TFF) are two modes of crossflow filtration. In TFF, the feed stream is unidirectional and orthogonal to the filter surface; in ATF, the feed stream alternates direction via a diaphragm pump (pressure, exhaust cycles) (Figure 2-4).
Figure 2-4. ATF and TFF. In ATF, the feed stream alternates direction via a diaphragm pump
(pressure, exhaust cycles), while in TFF the solution flows through the filter in a circular direction [18].
Gravity processes separate based on sedimentation principles, which state that centrifugal acceleration
causes denser particles to move outward compared to less dense particles. In centrifugation, the denser particles (e.g., cells) settle before the less dense particles (e.g., product). Centrifuges perform well with low-density cultures. However, the frequency of discharges (i.e., removal of settled matter) increases with cell density, which impacts yield and stresses the equipment. Continuous discharge alternatives are a promising alternative to alleviate problems with traditional centrifuges. Other methods relying on gravity processes include incline settlers and hydro-cyclones. All gravity processes improve after
chemical modifications – such as acid precipitation and flocculation. In acid precipitation, the pH is lowered to aggregate smaller cell debris to increase their sedimentation rate. Similarly, flocculants cause cell debris for improved separation.
Adsorptive processes rely on different absorption rates to separate product from cell culture. The most
widely used absorptive process is expanded bed chromatography (EBA). The resin bed is first expanded by an upward flow of buffer [19]. The feed solution is then passed upward through the resin. The
product is absorbed by the resin, while the remaining cell culture components are eluted. EBA is appropriate for cell cultures with high viability and low density. At high cell densities, cell debris clogs the resin, causing the expanded bed to collapse. Other adsorptive processes include magnetic beads and oil-bodies.
Lastly, phase separation processes separate the product from the culture after separating the mixture into distinct phases. In aqueous two-phase extraction, two polymers or a polymer and a salt are added to an aqueous solution. One polymer is covalently modified to attach an affinity ligand that binds to the final product [20]. In the aqueous solution, the polymer aggregates due to its hydrophobicity, thereby forming a distinct phase that contains the final product. However, the technology is still immature, and the partitioning is complex and not easily predicted [21].
For the remainder of the thesis, the focus is on ATF and TFF. Both technologies are widely used
across the biotechnology industry because of their reliability and robustness.
Membrane fouling is the accumulation of particles on the membrane surface and/or the retention of particles within the membrane matrix or pores. Foulants are brought to the membrane by convective transport, which is the sum of diffusion, the random motion of individual particles in the fluid, and advection, the transport of matter by the larger-scale motion of currents [22][23]. In microfiltration-based TFF/ATF, particles are transported to the membrane via the orthogonal flow of fluid through the filter, driven by a pump or transmembrane pressure. Thus, the rate of fouling is dependent on permeate velocity.
At the membrane surface, the rejected particles either 1) dissolve and back-diffuse in the bulk fluid, or 2) remain non-dissolved and are absorbed by the membrane. The dissolved particles form a
concentration polarization layer, while the absorbed particles act as foulants. Both concentration polarization and fouling increase resistance to solvent flow through the membrane and thus limit ATF/TFF efficiency [24][25][26].
i. Concentration Polarization
Concentration polarization is depicted in Figure 2-5 [25]. Concentration polarization is a boundary layer containing a higher concentration of particles than the bulk. The layer is formed naturally by the
selectivity of the membrane; as the membrane rejects particles, some particles back-diffuse, forming a region of higher concentration. The concentration polarization layer may cause a decline in permeate flux, even without fouling [25][27].
Although concentration polarization is distinct from fouling, the two phenomena are interrelated. Higher concentrations of particles at the membrane surface increase the probability of foulant adsorption,
thereby transitioning from concentration polarization to fouling [25][27]. By filtering fine silica colloids under controlled conditions, Chen et al. demonstrated that the polarized layer formed a cake structure (a type of fouling) above a critical flux [28]. The cake structure, evident via electron micrographs, caused an increase in TMP and a decrease in permeate flux. Inversely, reducing the concentration polarization layer minimizes the transition to irreversible fouling. Improved mass transfer, such as by increasing the crossflow rate, will reduce surface concentrations and thus fouling [25]. Chen et al. showed that
increasing the crossflow rate effectively increased the critical flux at which the polarization layer transitioned to fouling [28].
Figure 2-5. Concentration Polarization. Concentration polarization is a boundary layer containing a
higher concentration of particles than the bulk. The layer is formed naturally by the selectivity of the membrane; as the membrane rejects particles, some particles back-diffuse, forming a region of higher concentration [25].
ii. Fouling
Fouling is categorized both by its reversibility and mechanism. Reversible fouling can be removed by physical means, such as reversing the flow of the feed-stream, while irreversible fouling can only be removed by chemical means [22]. Broadly, internal and external fouling are the primary fouling
mechanisms. Internal fouling is characterized by the build-up of foulants on pore walls and/or
membrane fibers; external fouling characterized by the growth of a foulant layer on top of the membrane surface [29].
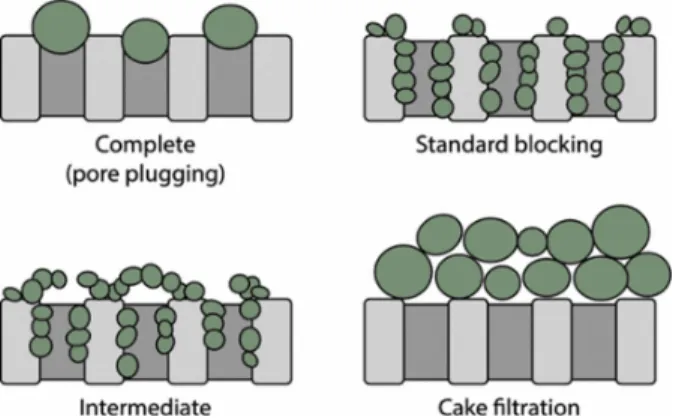
Internal fouling is further divided into different modes. There are three modes of internal fouling in membranes composed of straight, cylindrical pores (i.e., hollow fiber membranes): standard blocking, complete pore blockage, and intermediate pore blockage [30]. In standard blocking (also known as pore constriction), pores evenly decline in radius as foulants accumulate on pore walls [29]. Standard blocking increases resistance to fluid flow due to pore size reduction [25]. In complete and
intermediate blocking, foulants block pore entrances completely and partially, respectively [29]. Both
complete and intermediate blocking reduce the available filtration area. External fouling is synonymous with cake fouling or gel formation: all terms represent the deposition of particles on top of the
membrane, essentially a secondary membrane. The fouling modes are depicted in Figure 2-6.
Figure 2-6. Fouling Modes. There are four types of fouling – complete, standard blocking,
intermediate, and caking. Complete and intermediate block the pore heads completely and partially, respectively. Standard blocking narrows the pores. Caking is the accumulation of particles on the membrane surface [31].
All fouling mechanisms increase membrane resistance, i.e., the resistance to solvent flow through the membrane. Membrane resistance is calculated using Darcy’s Law (Eq. 2-1):
𝐽 = 𝑇𝑀𝑃
𝜇(𝑅)+ 𝑅++ 𝑅,)
, where 𝐽 is permeate flux ./
01, TMP is transmembrane pressure . 23 /∙051, µ is filtrate viscosity . 23 /∙01, RM(𝑚 78)
is intrinsic membrane resistance, RR(𝑚78) is added resistance due to reversible fouling, and RI(𝑚78) is
added resistance due to irreversible fouling [24]. Without fouling, the sole resistance is intrinsic (RM)
and permeate flux increases linearly with TMP. The flux-TMP curve begins to deviate from linearity with the onset of fouling. As shown by Darcy’s Law fouling is detected by either an increase in TMP under constant flux operation or a decrease in permeate flux under constant pressure operation.
Fouling reduces harvest efficiency, increases production costs, and places an unnecessary burden on operators. Lower permeate flux due to fouling decreases product sieving for a given harvest cycle time. Reduced pore radius, specifically due to standard blocking, may also decrease sieving if the product can no longer permeate the pores. Harvest inefficiencies limit overall yield and production capacity – the product retained in the bioreactor (i.e., not harvested) cannot be recovered. Moreover, increased TMP due to fouling may surpass operational limits, halting the harvest process until the fouled filter is replaced. Filter change-out not only increases COGS but also increases the workload of operators.
E. Fouling Models
Hermia developed an equation that relates flux decline to fouling mode (Eq. 2-2):
𝑑:𝑡 𝑑𝑉:= 𝑘 >
𝑑𝑡 𝑑𝑉?
, where 𝑡 is the filtration time, 𝑉 is the volume filtered per unit area, and 𝑛 is an index dependent on fouling mode [32]. A synonymous form of the equation calculates flux decline rather than the decline in volume filtered per unit time (Eq. 2-3):
BC
BD = −𝑘𝐽F7@ [25].
In the second form of the equation, the impact of index 𝑛 is apparent: the smaller the value of 𝑛, the greater the decline in permeate flux. The value of 𝑛 depends on the fouling mode. 𝑛 is equal to 0, 1, 1.5, and 2 for cake fouling, intermediate blocking, standard blocking, and complete blocking. Thus, cake fouling induces the steepest decrease in permeate flux under constant pressure.
Hernia’s equation, though useful, was developed for dead-end filtration and is only valid for initial periods of crossflow filtration [25]. Hence, the equation is modified to include the effects of crossflow (Eq. 2-4):
𝑑𝐽
𝑑𝑡= −𝑘(𝐽 − 𝐽00)𝐽:7@
, where 𝐽00 is the steady-state flux [25]. Crossflow mediates fouling by shearing foulants from the
membrane surface. The deposition of foulants via convection and the removal of foulants via crossflow eventually equalize, resulting in a non-zero steady-state flux [25].
F. Fouling Factors
Numerous factors influence fouling, from cell debris to filter porosity. The factors are often interrelated, making it difficult to distinguish individual effects. Fouling factors, and occasionally their interrelation, have been investigated extensively. The research is reviewed below, with factors organized into three categories: feed inputs (factors related to the feed stream), operational inputs (factors related to harvest
design and operation), raw material inputs (factors related to filter characteristics). Table 2-3 summarizes the individual effects on fouling.
Table 2-3. Fouling Factors. The table summarizes the relationship between various filtration inputs and
fouling.
i. Feed Inputs
Feed inputs are factors related to cell culture within the production bioreactor. Given that there are 40 to 100 media components, cell culture is immensely variable in its formulation. Varying cell culture formulations result in different cell densities and viabilities, which impact downstream harvest.
Cell culture density is correlated with membrane fouling, with higher cell densities associated with
rapid fouling of microfilters in both ATF and TFF mode. Researchers from Villanova University and Janssen Pharmaceuticals filtered mammalian cell culture with low and high densities (28*10^5 cells/mL
and 37*10^6 cells/mL, both with 91% cell viability) using ATF [5]. The high-density solution showed fouling within 320 minutes, while the low-density solution showed fouling within 430 minutes.
Similarly, Karst et al. filtered CHO cell culture of increasing densities (20, 40, and 60*10^6 cells/mL) using both ATF and TFF [18]. Instead of measuring direct indicators of fouling (i.e., membrane resistance, TMP, permeate flow), the authors measured a consequence of fouling – harvest yield. Interestingly, high yield (90%) was observed using ATF at all cell densities. High yield was also measured using TFF with low cell densities, but low yield (50%) was seen using TFF at high cell
densities. The authors attribute that the difference in results is due to hydrodynamic differences between ATF and TFF: bidirectional flow in ATF causes back-washing, removing foulants (i.e., the Starling Effect).
While both studies suggest that higher cell densities are correlated with fouling, the ATF results
illustrate the complexity of studying fouling. At approximately 40*10^6 cells/mL, Zhang et al. observed fouling while Karst et al. observed no sieving decline (suggesting minimal fouling). Variation in
operating conditions between the two studies (i.e., crossflow rate, permeate flow rate, and filter length) could have contributed to observed differences, further illustrating the interdependency of fouling factors.
Cell viability, the percentage of live cells within the feed stream, has been shown to be negatively
correlated within fouling. Cell death pathways include apoptosis and necrosis. Apoptosis is programmed cell death – it is a physiological process by which unwanted or useless cells are eliminated during the development and other normal biological processes. In contrast, necrosis is a pathological process that
occurs when cells are exposed to external triggers. In harvest, apoptotic triggers are dependent on bioreactor and ATF/TFF design. Media lot hold time and feed strategy affect nutrient availability, and ATF hold-up and poor mixing cause oxygen depletion.
Zhang et al. filtered solutions varying in cell viability using ATF and examined the membrane post-filtration using a scanning-electron microscope (SEM) [5]. The SEM analysis of the fouled membranes showed a cake layer containing cells. They found that low viability solutions led to greater “sticking” (i.e., cake layer formation). Lower viability cells not only attached more readily during the exhaust phase but also detached less readily during the pressure phase. The authors suggested that DNA, released during cell lysis, promoted cell adhesion to the membrane surface. Internal research also demonstrated that lower viability solutions resulted in a faster sieving decline, reaching the steady-state value within minutes.
The association of lower viability solutions with fouling brings about the following question: is cell debris contributing to fouling because of its size, chemistry, and/or shape? Work by Lin et al. supports further investigation into particle size [6]. They filtered three samples: material in the permeate stream (<10 nm), cell culture supernatant (<10 nm to >1 um), and cell pellet resuspended (> 1 um). Cell culture supernatant resulted in low sieving, while the other samples maintained high pass-through. Their work demonstrates that supernatant contributes to fouling, independent of cell suspension.
Previous work demonstrates that particle size is, at a minimum, a contributing factor to supernatant fouling. Duclos-Orsello et al. showed that particle size influences fouling mode [30]. They filtered three different solutions through 0.22 µm filters: 0.25 µm polystyrene microspheres, BSA solution, and a
pre-filtered BSA solution. The microspheres caused cake fouling because the microspheres were larger than the pores. The BSA solution caused pore blocking followed by caking; in contrast, the pre-filtered BSA solution caused minimal pore blocked and greater pore constriction because protein aggregates were removed.
Finally, the concentrations of cell additives, such as antifoam, are also correlated with fouling.
Antifoam is added to cell culture to control foam and bubble formation. Zhang et al. demonstrated that antifoam adheres to membranes and causes fouling [5]. When filtering only media and antifoam (no cells), the membrane fouled within 12 minutes with an antifoam concentration of 4,500 ppm and within 8 minutes with an antifoam concentration of 6,000 ppm [5]. SEM images of membranes post-filtration indicated that antifoam micelles were deposited on the membrane (25 to 40 µm “hills” deposited on the membrane).
ii. Operational Inputs
Operational inputs are factors under-control by the process designer and harvest operator. Key
operational inputs associated with fouling include mode (TFF, ATF), crossflow rate, permeate flux, and TMP.
TFF and ATF are both modes of crossflow filtration. ATF is theorized to out-perform TFF because of the Starling Effect. The Starling Effect is back-flux created by pressure gradients within the membrane. Throughout TFF and during the pressure cycle of ATF, the inner lumen (IL) pressure exceeds the permeate pressure, driving solute flow from the inner lumen to the outer shell. The pressure gradient is greatest at the inlet but gradually decreases along the fiber length. Close to the outlet (depending on fiber
length), the pressure gradient flips, and the permeate pressure exceeds the inner lumen pressure. This reverses the flow of fluid, creating a back-flux that cleans the membrane. In TFF, the back-flux only occurs at the far-end of the filter. However, because ATF alternates the direction of feed flow, the back-flux also alternates between the proximal and distal sections of the filter. Thus, a greater proportion of the membrane is cleaned in ATF.
Numerous studies cite the Starling Effect when explaining the performance differences between ATF and TFF. At high cell densities, Karst et al. measured high product yields (90%) using ATF but low product yields (50%) using TFF [18]. The authors attribute that the difference in results is due to hydrodynamic differences between ATF and TFF: bidirectional flow in ATF causes back-washing, removing foulants (i.e., the Starling Effect). Moreover, ATF resulted in lower hydrodynamic stress values than TFF with short, long, and no fibers [18]. The hydrodynamic stress is likely higher in TFF due to the larger effective cross-sectional area of the TFF pump compared to the ATF pump. In TFF, the hydrodynamic stress values readily exceed 32 Pa, the maximum stress tolerable by cells. Thus, the TFF pump may lower cell viability, which has been shown to contribute to fouling.
Karst et al. used a bearing-less centrifugal TFF pump in the previous study. Interestingly, when using the same pump, Coffman et al. found the performance comparable to ATF in both cell viability and product sieving [6]. They also compared the performance of TFF using a peristaltic pump. The
peristaltic pump resulted in greater cell lysis, lower cell viability, and lower product sieving compared to the centrifugal pump. The results, specifically the lower cell viability, demonstrate the peristaltic pump is a major source of shear within the TFF system.
ATF is not without limitations. ATF has narrower operating ranges, given that it requires both vacuum and exhaust. Molleryd et al. compared cell culture densities used ATF and TFF; ATF and TFF were used to remove by-products of cell culture, not harvest product [33]. With ATF, the cell density peaked at 1.32*10^8 cells/mL. The cell density was limited by the vacuum capacity failing to pull the highly viscous cell broth. With TFF, the cell culture grew to higher densities (2.14*10^9 cells/mL), illustrating the potential of wider operating ranges.
Permeate flux is the volume flowing through the membrane per unit area per unit time (m3/m2/s).
Permeate flux is typically controlled via a pump on the permeate line. Flux is linearly related to TMP through Darcy’s Law (Eq. 2-5):
𝐽 =I(+ G)H
JK+LK+M).
Because TMP drives particles to the membrane surface, higher flux increases the likelihood of fouling. The positive relationship between flux and fouling has been demonstrated repeatedly in literature. Internal research demonstrated that long-fibers exhibit minimal fouling at low fluxes, but rapid fouling at higher fluxes. The concept of “critical flux” has also been theorized – the hypothesis is that on start-up, there exists a flux below which minimal fouling occurs and above which fouling occurs. The critical flux depends on a variety of factors, including particle size. Gupta et al. estimated the critical flux values for particles ~0.1 µm to be 1-10 µm/s and particles ~ 1 µm to be 10 µm/s [8].
Crossflow is the flow rate of the feed solution through the filter (m/s). Generally, crossflow is thought to
reduce fouling because it increases the shear forces at the membrane surface. However, the experimental results have not been conclusive. Bardliving et al. measured the membrane resistance after conducting filtration experiments using various crossflow rates. They found that both reversible and irreversible
membrane resistance was the highest for the membrane exposed to 0.70 m/s crossflow, followed by 0.22 m/s and 0.11 m/s [24]. In contrast, Lifia et al. found that raising the crossflow rate from 4 to 100 mm/s reduced the TMP from 59 to 24 kPa (suggesting a reduction in fouling) [34]. Together, the results suggest that increasing crossflow rates reduce fouling, but only below a certain threshold.
iii. Raw Material Inputs
In harvest, the primary raw material is the single-use filter. Filter attributes significantly impact fouling; key attributes include filter geometry (i.e., length, thickness), filter material, filter porosity (i.e., pore size, pore density), and filter quality.
Filter geometry, specifically shorter filters, is correlated with fouling. The Darcy-Weisbach equation
(Eq. 2-6) describes the pressure drop across a pipe:
∆𝑝 =𝑓𝐿𝜌𝑣 : 2𝐷
, where f is the friction factor, L is the pipe length, 𝜌 fluid density, 𝑣 is the fluid velocity, and 𝐷 is the
diameter. From Eq. 2-6, as the filter increases in length, the pressure drop increases proportionally. Thus, sufficiently long filters may have negative pressure toward the retentate end, meaning the pressure within the filter is less than the permeate pressure. The negative pressure causes the permeate to reverse direction (i.e., back-flushing), which cleans the membrane and reduces fouling.
Filter porosity encompasses numerous aspects, including pore size and pore density. Filters are rated on
their ability to remove particles of a specific size through two methods: nominal and absolute rating [7]. The nominal rating indicates a filter’s ability to reject a minimum percentage of particles greater than a
given micron size – e.g., 90% of 10 µm particles are rejected. Absolute rating, in contrast, indicates the diameter of the largest spherical particle that will pass through the filter in laboratory conditions – e.g., 10 um. The absolute rating is often considered unrealistic – operating pressure gradients are often higher than laboratory conditions; particles are often not spherical, etc.
Research related to pore size has yielded varying results. Stressmann et al. feed CHO cells through a TFF system under varying shear rates, controlled via feed pump speed [35]. Filters with small pores (0.2 µm) were associated with greater reversible and irreversible fouling at both low and high shear rates compared to filters with large pores (0.45 µm). Coffman et al. also demonstrated the benefit of larger pore sizes [36]. CHO cells were filtered using TFF with hollow fiber membranes of varying sizes and materials: 0.2 µm PES, 0.2 µm alpha-alumina, 5 µm alpha-alumina, and 2-10 µm PE (hollow fiber depth filter). The larger filters offered almost 100% product passage throughout the harvest cycle, while the 0.2 µm filters fouled within two days. No downstream impacts of the larger pore sizes were identified. Internal research, however, suggests that either small or large pore filters can be optimal depending on the accompanying set of conditions.
Filter quality also has an immense impact on fouling and product yield. A recent vendor change has
Chapter 3: Materials and Methods
A. Experiment Overview
We hypothesized that: 1) the mode of fouling is dependent on particle size, and 2) for a given particle size fraction, the extent of fouling is impacted by pore size and/or flux. We tested our hypothesizes empirically. First, CHO cell culture supernatant, obtained via standard Amgen perfusion processes, was fractionated by size using dead-end and crossflow filtration. Second, each supernatant fraction was filtered using tangential flow filtration (TFF) under varying operating conditions (Table 3-1). The resulting pressures and sieving were measured to quantify fouling and its consequences. Third, polystyrene microspheres were filtered using TFF under a subset of the conditions. The microspheres were of similar diameter to the particles within the supernatant fractions. Comparing TMP and sieving curves of supernatant and microspheres revealed the relative impact of particle size versus chemistry. Note that all equipment used throughout the protocol is regularly maintained and calibrated by Amgen.
Particle Sizes (µm) <0.1 0.1 – 0.22 0.22 – 0.45 0.45 – 0.65 0.65 – 1 0.65 – 5 Op era tin g C on di tio ns High Flux, Large Pore Size
X X X X
High Flux, Medium Pore Size
X X X X
High Flux, Small Pore Size
X X X X
Moderate Flux, Large Pore Size
X X X
Moderate Flux, Medium Pore Size
X X X X X X
Moderate Flux, Small Pore Size
X X X X
Low Flux, Large Pore Size
X X X X
Low Flux, Medium Pore Size
X X X X
Low Flux,
Table 3-1. Operating Conditions. Each particle size fraction was filtered under varying operating
conditions – specifically, flux and filter pore size. The levels of each factor were as follows: particle size fraction – 6 levels; flux – 3 levels; and pore size – 3 levels. A fractional factorial design was conducted, with the runs selected designated by X. A subset of the selected runs was also replicated.
B. Step 1: Separation of Cell Culture Supernatant by Size
To separate cell culture by particle size, whole cells were removed from cell culture to obtain
supernatant (i.e., media and particulate matter) (Centrifuge Cell Culture). The supernatant was then fractionated by particle size using a combination of dead-end and crossflow filtration (Fractionate
Supernatant). Finally, the size and concentration of the particles within each fraction were verified
using dynamic light spectroscopy (DLS) (Verify Particle Size Fractions).
i. Centrifuge Cells
Two liters of CHO cell culture, grown via perfusion processes, were obtained from Amgen’s Pilot Plant immediately following the production bioreactor step. Intact cells were removed via centrifugation (30 minutes at 3000 RPM), leaving only cell culture supernatant. The CHO cell culture was grown via standard Amgen protocol, so the particulate content in the supernatant was assumed to be representative of average batches. Thus, the study results are translatable to Amgen’s production processes.
ii. Fractionate Supernatant
The cell culture supernatant was separated by particle size to generate six distinct bands: 1) 5-0.65 µm, 2) 1-0.65 µm, 3) 0.65-0.45 µm, 4) 0.45-0.22 µm, 5) 0.22-0.1 µm, and 6) <0.1 µm. To fractionate the supernatant, a combination of dead-end and crossflow filtration was utilized. Membrane filtration was
selected over centrifugation and chromatography because of equipment availability and volume constraints, respectively. Unlike the available centrifuge and resins, membrane filtration supported the large volume of supernatant, high particulate density, and micron and sub-micron particle sizes.
As illustrated in Figure 3-1A and 3-1B, the fractionation process involved two distinct filtration sequences: the first sequence generated Fraction 5-0.65 µm, while the second sequence generated the remaining fractions. Both sequences began with 1 L of supernatant with all particle sizes. The particles were then extracted from the supernatant bulk from largest to smallest using a series of filters with progressively smaller pore sizes. The filter separated the particles based on particle size, with particles less than the pore size flowing into the permeate and particles greater than the pore size flowing into the retentate. Thus, the permeate became the feed mixture for the next step while the retentate, bounded in size by the filters of the previous and current step, became Fraction n.
Figure 3-1A. Fractionation Line 1. The 0.65-5 µm fraction was extracted using a dead-end filter with 5
µm pores and a crossflow filter with 0.65 µm pores. 1 L of the full supernatant was filtered using the dead-end filter, and the permeate was subsequently filtered using the crossflow filter. The resulting retentate contained particles bounded in size by both filters (i.e., 5-0.65 µm particles).
Figure 3-1B. Fractionation Line 2. The second filtration sequence generated Fractions 2 through 6.
The particles were then extracted from the supernatant bulk from largest to smallest using a series of filters with progressively smaller pore sizes.
Dead-end Filter Procedure: The dead-end filters, manufactured by Whatman, were ordered in two pore sizes: 1 µm and 5 µm. Both dead-end filters encompassed a filtration area of 400 cm2. The dead-end
filter set-up is illustrated in Figure 3-2. The peristaltic pump drove the supernatant through the dead-end filter at 20 mL/min. A pressure sensor was placed after the peristaltic pump to ensure that the pressure remained below 15 psi, the maximum pressure tolerated by the tubing junctions. Particles smaller than the filter pore size permeated the membrane, while particles larger than the pore size returned to the main container. The permeate became the feed solution for the following crossflow filtration steps (see
Figure 3-2. Dead-end Filter Set-up. The schematic illustrates the dead-end filter set-up. The feed
solution was pumped through the dead-end filter via a peristaltic pump. Particles smaller than the filter pore size flowed into the permeate, while the remaining particles returned to the main container.
Crossflow Filter Procedure: The microfiltration cassettes, manufactured by Pellicon, were ordered in all available pore sizes: 30 kDa, 0.1 µm, 0.22 µm, 0.45 µm, and 0.65 µm. The filtration area for all
cassettes was 0.1 m2. The large filtration area was necessary to separate the supernatant effectively and
efficiently. Fractionation was initially attempted with a smaller filtration area (50 cm2). However, the
filters readily fouled with the smaller filtration area, which restricted particle passage and increased the separation time.
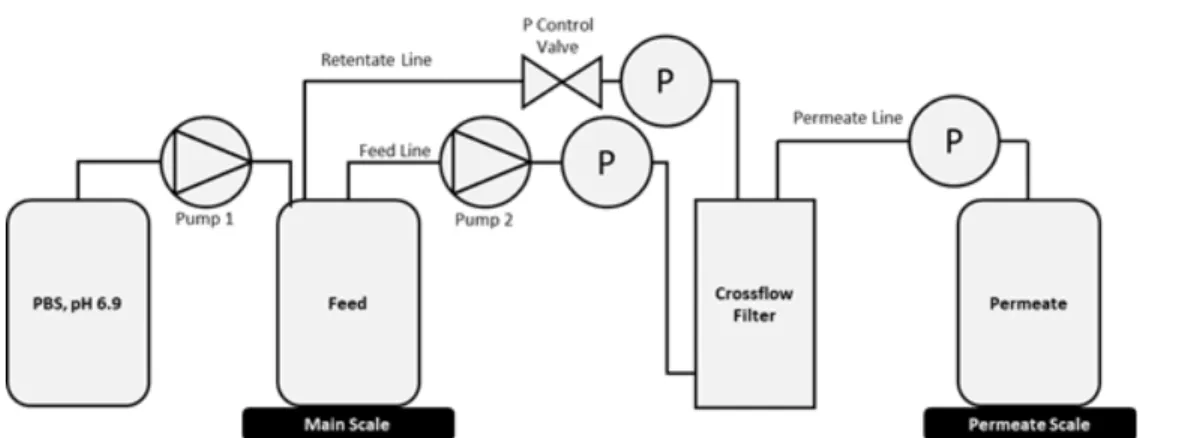
The crossflow filter set-up is illustrated in Figure 3-3. The set-up relied on the PendoTech TFF Process Control System, which automatically controlled the feed flow rate and transmembrane pressure (TMP) based on pre-programmed values. The control system operated in three modes: concentration,
diafiltration, and recovery. In concentration mode, the volume in the main container (i.e., feed solution) was reduced from its initial concentration to 0.5 L. The concentration step was necessary to minimize diafiltration time, which is a function of the main container volume. In diafiltration mode, particles were filtered by size – particles greater than the filter pore size returned to the main container, while particles less than the filter size entered the permeate. Finally, in recovery mode, PBS was added to the retentate
to recover the initial concentration and obtain Fraction n. For illustration, the extraction of the 1-0.65 µm fraction is described below:
Figure 3-3. Crossflow Filter Set-up. The schematic illustrates the crossflow filter set-up. The
crossflow filter runs automatically via values pre-programmed into the PendoTech TFF Process Control System.
• Concentration Mode:
1. The feed solution was added to the main container. The feed solution was generated by the previous dead-end filtration step, which removed all particles greater than 1 µm. Thus, the main container contained 1 L of solution with particles < 1 µm.
2. The following values were pre-programmed into the PendoTech TFF Process Control System: the circulation pump flow rate (20 ml/min), main scale end weight (500 mg), and TMP (15 psi).
3. The system ran automatically based on the pre-programmed values. The circulation pump pumped the feed solution through the system at 20 mL/min, while the control valve regulated the retentate line pressure. Because of the control valve, the retentate line pressure was greater than the permeate line pressure (TMP = 15 psi). Thus, a portion of the feed solution flowed through the filter and entered the permeate.
![Table 2-1. Downstream Methods. Various technologies are used to capture and purify the product, each with distinct advantages and disadvantages [13]](https://thumb-eu.123doks.com/thumbv2/123doknet/14726049.571796/23.918.92.813.272.504/downstream-methods-various-technologies-capture-distinct-advantages-disadvantages.webp)