HAL Id: hal-00299465
https://hal.archives-ouvertes.fr/hal-00299465
Submitted on 13 Nov 2007
HAL is a multi-disciplinary open access
archive for the deposit and dissemination of
sci-entific research documents, whether they are
pub-lished or not. The documents may come from
teaching and research institutions in France or
abroad, or from public or private research centers.
L’archive ouverte pluridisciplinaire HAL, est
destinée au dépôt et à la diffusion de documents
scientifiques de niveau recherche, publiés ou non,
émanant des établissements d’enseignement et de
recherche français ou étrangers, des laboratoires
publics ou privés.
methodological approach
S. Sterlacchini, S. Frigerio, P. Giacomelli, M. Brambilla
To cite this version:
S. Sterlacchini, S. Frigerio, P. Giacomelli, M. Brambilla. Landslide risk analysis: a multi-disciplinary
methodological approach. Natural Hazards and Earth System Science, Copernicus Publications on
behalf of the European Geosciences Union, 2007, 7 (6), pp.657-675. �hal-00299465�
www.nat-hazards-earth-syst-sci.net/7/657/2007/ © Author(s) 2007. This work is licensed under a Creative Commons License.
and Earth
System Sciences
Landslide risk analysis: a multi-disciplinary methodological
approach
S. Sterlacchini1, S. Frigerio1,2, P. Giacomelli3, and M. Brambilla3
1Institute for the Dynamic of Environmental Processes, National Research Council (CNR-IDPA), Piazza della Scienza 1, 20126 Milan, Italy
2Department of Environmental Sciences, University of Milan-Bicocca, Piazza della Scienza 1, 20126 Milan, Italy 3Department of Agricultural, Agro-Food And Environmental Economics and Policy, University of Milan, Via Celoria 2, 20133 Milan, Italy
Received: 5 April 2007 – Revised: 23 October 2007 – Accepted: 25 October 2007 – Published: 13 November 2007
Abstract. This study describes an analysis carried out within the European community project “ALARM” (Assessment of Landslide Risk and Mitigation in Mountain Areas, 2004) on landslide risk assessment in the municipality of Corvara in Badia, Italy. This mountainous area, located in the central Dolomites (Italian Alps), poses a significant landslide hazard to several man-made and natural objects. Three parameters for determining risk were analysed as an aid to preparedness and mitigation planning: event occurrence probability, ele-ments at risk, and the vulnerability of these eleele-ments. Ini-tially, a landslide hazard scenario was defined; this step was followed by the identification of the potential vulnerable el-ements, by the estimation of the expected physical effects, due to the occurrence of a damaging phenomenon, and by the analysis of social and economic features of the area. Fi-nally, a potential risk scenario was defined, where the rela-tionships between the event, its physical effects, and its eco-nomic consequences were investigated. People and public administrators with training and experience in local lands-liding and slope processes were involved in each step of the analysis.
A “cause-effect” correlation was applied, derived from the “dose-response” equation initially used in the biological sci-ences and then adapted by economists for the assessment of environmental risks. The relationship was analysed from a physical point of view and the cause (the natural event) was correlated to the physical effects, i.e. the aesthetic, func-tional, and structural damage. An economic evaluation of direct and indirect damage was carried out considering the assets in the affected area (i.e., tourist flows, goods, transport and the effect on other social and economic activities). This study shows the importance of indirect damage, which is as significant as direct damage. The total amount of direct dam-age was estimated in 8 913 000 C; on the contrary, indirect
Correspondence to: S. Sterlacchini
damage ranged considerably from 2 840 000 to 9 350 000 C, depending on the selected temporal scenario and the ex-pected closing time of the potentially affected structures.
The multi-disciplinary approach discussed in this study may assist local decision makers in determining the nature and magnitude of the expected losses due to a dangerous event, which can be anticipated in a given study area, during a specified time period. Besides, a preventive knowledge of the prospective physical effects and economic consequences may help local decision makers to choose the best preven-tion and mitigapreven-tion oppreven-tions and to decide how to allocate re-sources properly, so that potential benefits are maximised at an acceptable cost.
1 Introduction
Landslides cause enormous casualties and severe economic losses in mountainous regions worldwide (Schuster, 1996). Preventing or reducing mass movements always involves systematic and rigorous processes to stabilize or “manage” slopes (Fell and Hartford, 1997). Since this is seldom suffi-ciently recognized (Guzzetti, 2000), new and more effective methodologies need to be developed to increase the under-standing of landslide risk and to enable rational decisions to be made on the allocation of funds for landslide risk manage-ment.
This study is framed within “ALARM” (Assessment of Landslide Risk and Mitigation in Mountain Areas, 2004), a European Community project that aims to improve exist-ing tools and methods for estimatexist-ing landslide risk in in-habited areas, and to test their applicability with institu-tional users and the general public. Several local munic-ipalities were directly involved in the project as potential final users. Corvara in Badia (Autonomous Province of Bolzano, Italy) was chosen as a representative mountain test-site (Figs. 1a, 1b). Within this area, the estimate of the
Corvara
Fig. 1a. Geographical location of the study area (Cartographic
web-site of Italian Environmental Ministry www.pcn.minambiente.it).
prospective physical effects and economic consequences due to a landsliding event was of interest for several potential lo-cal end users, such as:
– Public administrators responsible for facilities planning and management;
– Economic planners;
– Managers owning or dealing with buildings or other vulnerable facilities and the insurance companies which guarantee those facilities;
– Lawmakers drafting building regulations or codes of practise for construction, whose task is to ensure that adequate protection is provided at minimum cost; – People responsible for civil protections, relief and
emer-gency services, whose job is to prepare continemer-gency plans.
The significance of various losses may depend on the time interval considered: in the short term, casualties, homeless-ness and damage to buildings, infrastructure and equipment may be the primary concern. In the long term, economic loss and social disruption may be of greater importance.
Mitigation measures for future landslide events are be-coming increasingly common in municipal planning devel-opment, especially where there have been disasters in the past. Preparedness planning focuses on contingency mea-sures during an emergency whereas mitigation planning in-volves long term control of land use, building quality and
Fig. 1b. 3-D representation of the study area (royalties on Digital
Elevation Model and Digital Orthophoto: Autonomous Province of Bolzano-Autonome Provinz Bozen-Sudtirol).
other measures to reduce the impact of a dangerous event. A preventive risk analysis is fundamental for these planning processes. In achieving these aims, the degree of risk, deriv-ing from the expected magnitude of an event and its probable consequences, should be mapped and evaluated as quantita-tively as possible.
2 Landslide risk analysis: state-of-the-art
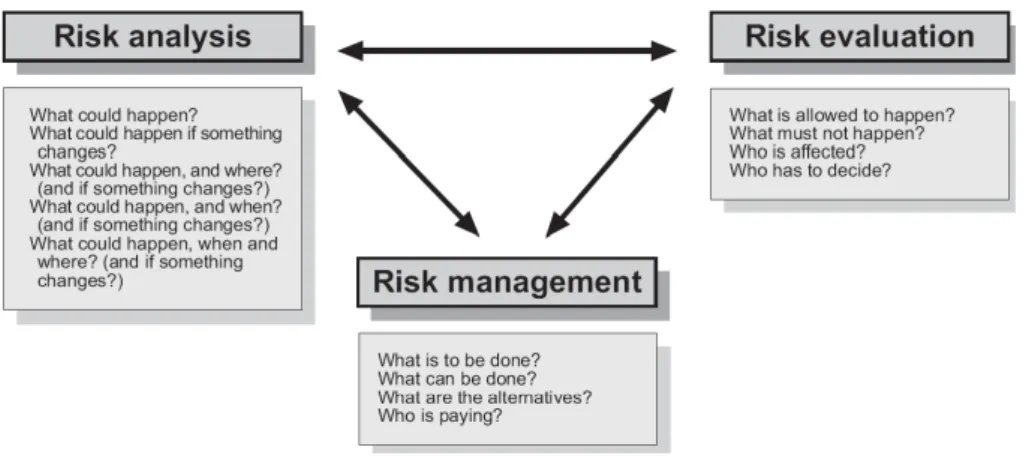
An entire risk assessment procedure comprises three essen-tial components (Fig. 2): risk analysis, risk evaluation and risk management (Bell and Glade, 2004a). Risk analysis aims to estimate and display “what could happen” in terms of physical effects and socio-economic consequences in a given environmental setting; risk evaluation is intended to identify risk perception and acceptance of the involved people; risk management combines the results of risk analysis and risk evaluation to find the “best” solution.
Following the definitions developed by the Office of the United Nations Disaster Relief Coordinator (UNDRO, 1979) and the Australian Geomechanics Society (AGS, Sub-Committee on Landslide Risk Management, 2000), a quanti-tative risk analysis, based on the frequency analysis and the probable consequences, may be calculated using the follow-ing parameters:
1. Spatial and temporal occurrence probability of a dan-gerous event;
2. Spatial and temporal impact probability of the event; 3. Value or net present value of the elements at risk; 4. Vulnerability of the elements at risk.
Fig. 2. The holistic concept of risk assessment (Bell and Glade, 2004a).
Many authors have stressed the gap between the theoretical definition of risk and its practical assessment (Carrara et al., 1991; Carrara et al., 1992, 1995; DMTP, 1994; Fell, 1994; Wu et al., 1996; Leroi, 1996; Leone et al., 1996; IUGS, 1997; AGS, 2000; Michael-Leiba et al., 2000; Cardinali et al., 2002; Liu et al., 2002; Bonnard, 2004; Hollenstein, 2005). Difficulties arise in the definition of the parameters mentioned above, which are characterised by several factors that need to be evaluated. Besides, it is important to highlight some aspects:
1. Event occurrence/impact probability is an intrinsically complex parameter (AGS, 2000);
2. Standardised procedures for hazard assessment are still lacking (Carrara et al., 1995);
3. Appropriate data is often difficult to acquire (Carrara et al., 1995);
4. Vulnerability assessment is a somewhat subjective pro-cedure, largely based on historical records (Dai et al., 2002) and expert judgements.
The topics mentioned above help to understand the real value of expert knowledge and professional judgments that are nearly always deeply involved in risk assessment. Each mathematical model used to represent complex natural mechanisms is often integrated with guidelines intended to synthesize human behaviour, choices and actions (Barneich et al., 1996; Ashby, 2002).
Different methods were developed and are nowadays com-monly used to estimate the potential physical effects and the economic consequences due to a dangerous event (DMTP, 1994), including:
1. Scenario Mapping, where potential losses (the number of people killed and injured and the damage to build-ings and infrastructure) are estimated within pre-defined
hazard and vulnerability scenarios. This method is of-ten applied to evaluate the resources needed in case of an emergency.
2. Potential Loss Studies, where the effects of the ex-pected occurrence are mapped, and the locations of communities likely to suffer heavy losses are shown. The “communities most at risk”, should be prioritised for loss-reduction programs and strategies, and will need more aid or rescue assistance in case of a major disaster.
3. Annualised Risk Mapping, where the probability of each damaging event over a period of time is combined with the consequences of that event to generate prospec-tive losses within that time. Summing up the losses for all occurrences gives the total losses expected for the period.
Generally, several types of losses can be considered, and this is a topic of increasing discussion. In landslide risk analysis, risk can be quantified in terms of loss of life and it is gener-ally accepted that saving life is the highest priority of disaster mitigation and preparedness programmes. However, many other consequences may be considered: the most common is economic cost. Cost is a widely accepted parameter because many types of loss can be converted into economic cost; it is a currency for considering a wide range of effects. Phys-ical effects evaluated in terms of economic cost are known as tangible losses and can be classified into direct and indi-rect. However there are many other consequences, which are equally or more important, even if they cannot be converted into a monetary equivalent, and these are referred to as in-tangible losses: social and psychological consequences on the community resulting from disasters. The occurrence of a calamity may generate changes in human behaviour and ac-tions: people may avoid affected areas on the basis of internal rules that judge the events to be more frequent and dramatic than they actually are (Starmer, 1996). Moreover, the same
Conceptual Model Define scope and methodology
Hazard Scenario Vulnerability Scenario Risk Scenario Vulnerability Scenario 4 - Physical Effects Past events Past physical damages Prospective physical damages
3 - Elements at Risk
Inventory the assets
Structures Activities Goods
Study the social and economic features of the area
6 - Prospective Economic Losses
Economic consequences
Direct damages Indirect damages
Hazard Scenario Statistical Models Susceptible areas (1:50.000 å 1:25.000) Critical zones (1:25.000 å 1:10.000) Hazardous area (1:10.000 å 1:5.000)
1 - Identify dangerous event 2 - Profile the event
to define
to obtain
where to delimit
5 – Risk Scenario
Hazard levels Physical effects
Level of risk to assets
Fig. 3. Scheme of the procedure described in the text. Numbers
(from 1 to 6) refer to the six-step process explained in paragraph 3.
risk may be perceived differently by individuals and groups. The differences between tangible and intangible losses make their aggregation into a single indicator of disaster impact impossible.
Direct losses can be considered as the “most visible” eco-nomic consequences; they may be quantified in terms of cost
of recovering and/or restoring the original conditions (for aesthetic and/or functional damage) or in terms of cost of partial or complete reconstruction (for structural damage). Indirect losses are generally related to the loss of revenue, increases in unemployment, and other economic aspects re-lated to the interruption or the reduction of economic activity. These economic considerations may affect the elements di-rectly involved and all the elements that use the destroyed structure for their economic activities. These issues can be explained considering, for example, the partial destruction of a road: this situation generates indirect losses for those elements which use that specific road for their economic ac-tivities, even if they are not directly involved in the event. For this reason, the economic analysis has to be related to elements affected both directly and indirectly. To do that, the social and economic context has to be characterized (Bl¨ochl and Braun, 2005): the results of economic and social anal-ysis may be considered as the key to estimating prospective losses (Kienholz, 1994) and to reducing private and public losses, carrying out the best prevention and mitigation op-tions. Evaluating prospective consequences requires “read-ing” potential damage from a physical, social and economic point of view (Giacomelli, 2005). It is important to predict how the territory might “react” after the impact, consider-ing the physical and environmental features and human be-haviour.
3 A multi-disciplinary methodological approach
Considering the aim of this study, the extent of the study area and data availability, we carried out only the risk analysis on a local scale (1:5000). A multi-disciplinary approach was defined and applied based on a “cause-effect” correlation, on the “scenario mapping” method, and on rules and assump-tions derived from social and environmental economics.
The “cause-effect” correlation is a quantitative relation-ship derived from the “dose-response” equation frequently used in the biological sciences (Purchase, 2000) for inves-tigating the relationship between a safe dose and the likely harmful effects that may occur if that dose is exceeded. Bio-logical sciences deal with risk as the characterization of the potential adverse effects of human exposure to environmental sources of danger. Economists have adapted this correlation and applied it to the economic assessment of environmental risks (Pearce, 1998; Starmer, 1998; Polelli, 2000).
In this study, the relationship was analysed from a phys-ical point of view, correlating the cause to the prospective physical effects. The “cause” refers to the potentially de-structive natural event (with its physical and geometric char-acteristics), while the physical effects are the aesthetic, func-tional, and structural damage suffered by the exposed ele-ments (Cardinali et al., 2002) .
In our approach, the prospective physical effects due to the impact of a damaging event correspond to vulnerability
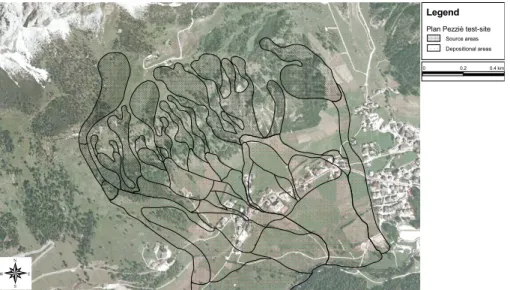
Legend
Plan Pezziè test-site
Depositional areas Source areas 0 0.2 0.4 km N E W S
Fig. 4. Plan Pezzi`e test-site. Source and depositional areas of earth-debris flows are represented. Debris cones are mapped as indicators of
high landsliding activity over long periods (royalties on Digital Orthophoto: Autonomous Province of Bolzano-Autonome Provinz Bozen-Sudtirol).
while the prospective social and economic consequences cor-respond to “consequences”, as described in AGS (2000), Glade (2003), and Bell and Glade (2004b).
In this study (Fig. 3), the landslide risk analysis was based on a six-step process (partially modified after Kien-holz, 1994; FEMA, 2001):
1. Identify a landslide event which could affect the munic-ipality and its community;
2. Profile the potentially destructive event;
3. Inventory the assets and study the social and economic features of the area;
4. Estimate the physical effects due to the impact; 5. Define an indicative risk scenario;
6. Estimate the prospective social and economic conse-quences.
People and public administrators with training and experi-ence in local landsliding and slope processes were involved in each step of the analysis to reduce an under/over estima-tion of the outcomes.
In the first step, a landslide hazard scenario was defined to map and characterise areas prone to slope failures. The entire municipality of Corvara in Badia was classified into homogeneous zones or domains, according to their degree of actual or potential landslide proneness. That was per-formed by analysing existing susceptibility maps, available in the ALARM project database, and achieved by the ap-plication of a statistical methodology (Weights of Evidence
modeling technique, Bonham-Carter et al., 1988; Agterberg et al., 1989).
The resulting map was used to identify “critical zones”: areas classified as highly susceptible with the presence of vulnerable elements. Among “critical zones”, Plan Pezzi`e area was chosen as a test-site; it is affected by dormant low thickness earth-debris flows with source areas of 248 428 m2 and depositional areas of 1 278 927 m2. The large number of debris cones mapped in the area was a clear indicator of an important gravitational activity over long periods (Fig. 4).
The analysis of available data led to the subdivision of the entire Plan Pezzi`e area into three zones: the westernmost, the central, and the easternmost sector. The geomorphological setting, the landsliding history, and the spatial distribution of past damage and disruption suggested the central sector as the most hazardous and subject to significant prospective physical effects and social and economic consequences (Plan Pezzi`e scenario). For this reason, it was analysed in more detail in this study. The central sector has a source area of about 107 496 m2and a very large depositional area of about 618 349 m2.
In this step, we identified and described a possible land-slide event that could occur within the scenario, whose mag-nitude and return period were inferred by analysing available data related to the landsliding history of the study area and its neighbourhood. This analysis took into account morphologic and climatic conditions, landslide types, materials involved, volumes, velocities, degrees of activity, and return periods. We did not choose for this study the largest or the most dam-aging landslides faced by the area and its community, since they relate to past climatic conditions, or are characterised by very low probabilities of occurrence.
Table 1. Historical records on landslide events and damage related to the study area and its neighbourhood (up to 25 km far from study area).
Records marked by asterisks are related to events occurred within the study area. Data source: AVI catalogue (Italian Vulnerable Areas) and Local and National chronicles from SICI dataset (Hydrogeological Disaster Information System, available at http://sici.irpi.cnr.it/index. htm); Technical Reports from event documentation of Autonomous Province of Bolzano. (http://www.provinz.bz.it/opere%2Didrauliche/ attivita1 i.htm).
Source Event type Date Municipality Location Damage
of event
Dam of Gader river. The collapse of the dam (for fast AVI catalogue Debris flow 19 Jun 1821 Badia Larzonei snow melting) destroyed a
lot of buildings in the area AVI catalogue Earth-debris 24 Mar 1951 Santa Cristina Val Santa Cristina Damage to bridges and
flow Gardena Val Gardena buildings
AVI catalogue Debris flow 4 Jun 1962 Badia Badia Damage to local roads Technical Earth-debris Nov 1966 Corvara in Badia Col Alto Minor damage
report (*) flow
Damage to local roads. AVI catalogue Earth-debris 4 Nov 1966 San Martino in Piccolino Val Badia Minor damage to national
flow Badia road
AVI catalogue Debris flow 3 Aug 1972 Ponte Gardena Ponte Gardena Minor damage AVI catalogue Debris flow 13 Nov 1975 Corvara in Badia Pralongi`a Minor damage (*)
AVI catalogue Debris flow Oct 1976 Ponte Gardena Pontives Minor damage to roads AVI catalogue Earth-debris 31 Jul 1977 San Martino in Piccolino Val Damage to buildings
flow Badia Badia
AVI catalogue Debris flow 23 Jul 1978 Corvara in Badia Colfosco One person killed and 200
(*) homelessness
Minor damage to national AVI catalogue Debris flow 9 Aug 1979 Laion Chiusa-Ponte road. Functional damage to
Gardena railway AVI catalogue Debris flow 19 Jul 1981 Ponte Gardena Ponte Gardena Minor damage AVI catalogue Debris flow 2 Sep 1982 San Lorenzo di Sares-Longega Minor damage to national
Sebato road
National chronicle Debris flow 28 Jun 1997 Marebbe Longega Functional damage to local road
Functional damage National/Local chronicle Debris flow 28 Jul 1997 Funes Albes to national road SS12 AVI catalogue Earth-debris 7 Aug 1997 Selva di Val Selva di Val Functional damage to local
flow Gardena Gardena road
Damage to houses and cars. Local chronicle Debris 29 Apr 1998 Selva di Val Dantercepies 30 people evacuated
flow/rock falls Gardena (instability was expected to occur) Damage to buildings.
Local chronicle Debris flow 12 Jun 1998 Selva di Val Colma-Ponte Functional damage to Gardena Gardena national road SS12 Local chronicle Earth-debris 26 Jul 1998 Marebbe San Vigilio di Functional damage to local
flow Marebbe road
AVI catalogue Debris flow 15 Aug 1998 Selva di Val Miramonti Functional damage
Gardena to SS243
Functional damage to Local chronicle Debris flow 7 Oct 1998 Badia Pedraces national road SS244 Local chronicle Earth-debris 7 Oct 1998 San Lorenzo Montana- Partial functional damage to
di Sebato Longega local road, alternate
flow one-way
Local Debris flow 8 Oct 1998 Badia La Villa- Functional damage to local
chronicle S.Cassiano road
Partial functional damage to Local chronicle Earth-debris 8 Oct 1998 San Martino in Pederoa- local road, alternate
one-flow Badia Piccolino way
Local chronicle Earth-debris 7 Nov 2000 Selva di Val Selva di Val Functional damage to
flow Gardena Gardena national road SS243
Technical report Earth-debris recurrent Selva di Val Passo Gardena Frequent and continuous
flow and Gardena damage to SS243
with local knowledge and expert opinion were used to pro-file a possible damaging event. It is important to stress that historical data concerned mainly damaging events: this tends to underestimate event occurrence probability but provides useful information on physical effects, in terms of damage and disruption.
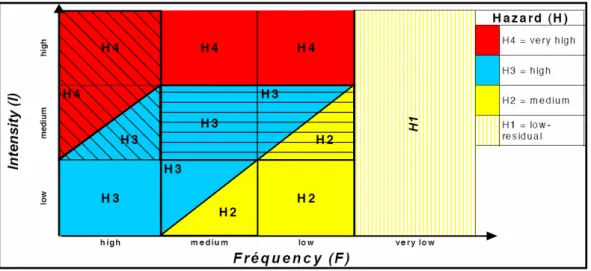
The Swiss Method (Heinimann et al., 1998; Raetzo et al., 2002) was then applied to better characterize Plan Pezzi`e scenario, to identify the hazard levels, and to map their spa-tial distribution on a more detailed scale, according to land-slide magnitude and frequency. The Geological, Hydrologi-cal and Torrent Control Offices of the Autonomous Province of Bolzano (where the study area is located) drafted guide-lines for hazard assessment derived from rules adopted in Switzerland in the last decade for the definition of hydro-geological hazards in Swiss cantonal master plans.
Starting from available information (cartographic data, aerial photographs, historical data, existing database, etc.), and according to the Swiss Method (Fig. 5), landslide hazard levels were derived for Plan Pezzi`e scenario, using a matrix that combines the following parameters:
1. Intensity. This parameter is computed by estimating the geometric severity and the expected velocity of the landslide. The geometric severity is strongly controlled by the thickness of the involved material and can be expressed by three classes: low (<2 m); medium (2– 10 m); high (>10 m). The velocity can be subdivided in three classes using the Cruden and Varnes classification (1996): from extremely slow to slow (<13 m/month); from moderate to rapid (13 m/month–1.8 m/h); from very rapid to extremely rapid (>3 m/min).
2. Frequency. This factor can be classified into four classes: high (<30 years); medium (30–100 years); low (100–300 years); very low (>300 years).
Combining intensity and frequency classes, hazard levels were obtained.
This step is followed by detailed analysis focused to spa-tially identify and to characterise vulnerable elements in the study area, and to provide an understanding of the possible physical effects on exposed elements caused by the impact of a potentially destructive event. It was achieved by analysing both aerial photographs (at a 1:10 000 scale) and other avail-able technical maps; the geometric features (shapes, perime-ters, areas and, eventually, volumes) and the relevant de-scriptive attributes (as occupancy rates of buildings, traffic flows, etc.) were collected and stored by analysing cadas-tral maps and other technical documents; systematic in-situ surveys and measures were also performed. A considerable amount of data was provided by the Autonomous Province of Bolzano and ASTAT (Provincial Statistic Institute). The following elements were identified and inventoried:
1. Infrastructure: roads, gas pipelines, power lines, water lines, penstocks, sewers, and ski facilities. Types,
struc-tural characteristics, reparation cost, and cost to get tem-porary structures ready were derived for each infrastruc-ture and stored in the database;
2. Buildings: use (residential, commercial, tourist, etc.), structural characteristics, number of floors, areas, vol-umes, number of residents, and occupancy rates. The number of residents and the occupancy rates are useful to approximately define the casualties, if the buildings collapse, and to define homelessness if they become un-inhabitable. Market values, insured values, and con-struction cost were also obtained.
Within engineering and natural science, vulnerability is tra-ditionally defined as the degree of loss to a given asset (or set of assets) at risk from a damaging event. People’s life and health, buildings, infrastructure, and activities are at risk when submitted to a destructive event. In this study, vulner-ability describes in qualitative terms the expected physical effects: the aesthetic, functional, and structural damage (Car-dinali et al., 2002) suffered by the exposed elements. For aes-thetic damage, it is assumed that the functionality of build-ings and infrastructures is not compromised, and the dam-age can be repaired rapidly and at low cost; for functional damage, the functionality of the exposed elements is com-promised, and the damage may take time and resources to be fixed; for structural damage, the elements are severely or completely damaged: time and large resources are required to carry out demolition and reconstruction work.
Data derived from written reports and literature about his-torical damage and disruption suffered by population, build-ings, infrastructure, and economic activities, during past “similar” landslide events, and the geometric and structural characteristics of the elements potentially affected was cru-cial for the definition of Plan Pezzi`e vulnerability scenario. At the same time, the local experience together with inter-views of the people affected by past disasters were used to understand past physical effects.
Finally, an indicative level of risk to assets was defined (Plan Pezzi`e risk scenario) combining the hazard level and the expected degree of physical effects. Five classes of risk were defined (from “very low” to “very high”), each of them is associated with some general examples of possible impli-cations.
In the last step, an estimate of the prospective social and economic consequences was performed within the profiled risk scenario, analysing the relationships between the event, its physical effects (damage and disruption) and its economic consequences (direct and indirect losses). Although it should include all the types of losses, the risk analysis proposed in the study will consider only tangible losses, related to physi-cal damage to assets, because of the real difficulty to quantify the intangible losses.
In achieving this aim, the social and economic characteris-tics and trends of the study area were analysed. Social anal-ysis characterised the human presence and its evolution over
time (inhabitants, distribution of age, “rate of activity”, com-muting, etc.). Economic analysis evaluated the assets in the exposed area, the activities carried out there (firms, jobs and sectors of local economy), and the flow of goods and com-modities. In this study, the potential losses will be described in terms of “direct losses”, if damage is directly connected to the assets affected by the phenomenon, and “indirect losses”, if damage is related to the interruption or to the reduction of economic activity (i.e. loss of production, revenues, etc.).
Direct losses were evaluated within each area at risk (as suggested by AGS, 2000), in relation to the spatial distri-bution of the vulnerable assets, and to a thickness of the piled-up debris varying from 1.0 m up to 2.0 m. The esti-mate of the direct losses was followed by evaluation of the indirect damage. Because this is a highly tourist area, indi-rect losses may include a reduction in hotel revenues, due to a decrease in the tourist flow, both for hotels directly involved and hotels not damaged but potentially affected by closure of the national road. The evaluation of indirect losses was performed analysing available data related to previous sum-mer/winter seasons to statistically obtain the potential num-ber of tourists, an average value of consumer expenditures, and the occupancy rates of hotels, for each week included in temporal scenarios. Effects on the transport of goods and commodities were also analysed.
4 Study area: the municipality of Corvara in Badia, Italy
The municipality of Corvara in Badia (Figs. 1a, 1b) is located in the central Dolomites (south-eastern Italian Alps), within the Autonomous Province of Bolzano (Italy). This moun-tainous area is characterised by high altitude differences, due to dolomitic massifs higher than 3000 m and valley floors at about 1500 m.
This sector of the Dolomites has been investigated in the framework of several European Projects for many years (EPOCH, 1994; NEWTECH, 1998; GETS, 2001; ALARM, 2004). The available data, collected through field surveys, measuring instruments and monitoring systems, represent this area as widely affected by gravitational phenomena. Some mass movements occurred in the last early post-glacial period, following the retreat of the W¨urmian glaciers. Many of them were reactivated in the Holocene, during periods of intense climatic variations (Corsini et al., 2001; Soldati et al., 2004).
The geomorphologic features of the area are highly re-lated to the different physical and mechanical properties of the outcropping geological units, to the tectonic structures (related to intense and different tectonic phases), to the mod-elling activity of the Pleistocene glaciers (with frost shatter-ing, rill-wash erosion, etc.), and to the gravitational slope processes (Corsini et al., 1998). Clear geomorphological ev-idence of mass movements can be found within the
munici-pality of Corvara in Badia and its surroundings, where land-slides, characterised by different types, materials involved, volumes, velocities, degrees of activity, and return periods are widely distributed (Panizza et al., 2002). Some of them are of considerable dimensions and still active.
Because of the scenic beauty and skiing terrain, the area has undergone an intense tourist development. Indeed, Cor-vara in Badia is one of the best-known sites in the Alps for skiing and hiking. The urban settlement has progressively increased since the late 1960s, and a dense network of facil-ities now serves most of the slopes. This development has significantly increased both the wealth of the area and risk to slope failures.
Within the municipality of Corvara in Badia, Plan Pezzi`e area (an administrative division of the municipality) was cho-sen as a test-site. It was affected by dormant low thickness earth-debris flows, usually following periods of heavy and/or prolonged rainfalls, that have posed threats to the commu-nity, buildings, infrastructure and environment in the past years. As aforementioned, the central sector of Plan Pezzi`e area was chosen to be analysed in more detail in this study. 4.1 Plan Pezzi`e database
The physical structure of the spatial database was designed by a research team from the University of Milano-Bicocca and National Research Council of Italy (research partners in “ALARM”) to exploit the data processing capabilities of Geographic Information Systems (GIS) and the potentialities of the Relational Database Management Systems (RDBMS). A multi-scale database was determined to be the most func-tional tool for managing geometric, descriptive and topolog-ical information, originally gathered at different scales (from 1: 50 000 up to 1:5000).
The spatial database was populated by the scientists from the University of Modena (a research partner in “ALARM”). The aim was to collect, integrate, manage and analyse all ex-isting data related to the study area and derived from different sources, characterized by different degrees of accuracy.
All georeferenced information stored in the database as maps (both in vector and raster format) and related tables was completely available on demand and usable for each phase of the study, justifying the great efforts involved in database creation, maintenance and updating.
To perform the risk analysis, the following data was col-lected, critically reviewed, and stored in the database:
1. Geological maps (1:50 000 to 1:10 000) portraying in-formation about the main geological units. The different rock compositions and textures affect slope instability, influencing strength, permeability, and susceptibility to chemical and physical weathering of the rock masses (source: Modena research partner);
2. Structural maps (1:50 000 to 1:10 000), representing the structural setting of the study area. Features such
as sequence and type of layering, lithologic changes, planes, joints, faults and folds are accountable for slope instability (source: Modena research partner);
3. Land use maps (1:25 000 to 1:10 000) indicating land use units. These may affect hydrological conditions and soil strength (source: Modena research partner);
4. Maps of superficial deposits (1:25 000 to 1:10 000), de-scribing the types and the physical and mechanical char-acteristics of unconsolidated deposits (source: Modena research partner);
5. A Digital Elevation Model (20×20 m), provided by the Autonomous Province of Bolzano. Raster datasets (20×20 m) on morphometric features (altitude, internal relief, slope angle, aspect, longitudinal and transverse slope curvature and slope roughness) and on hydrologic parameters (watershed area, drainage density, drainage network order, channel length, etc.) were automatically extracted from the DEM by the Milano research partner;
6. A detailed landslide inventory map (1:10 000), show-ing the geographical distribution of mass movements. Landslides were classified in terms of types, materials involved, estimated volumes and velocities, degrees of activity, and return periods; distinctions were made be-tween source and depositional areas (source: Modena research partner);
7. Susceptibility and hazard maps (1:25 000 to 1:5000), obtained by statistical modeling (Weights of Evidence Modeling Technique) and by the rules adopted in Switzerland for the definition of hydrogeological haz-ard in cantonal master plans by the Federal Office for Water and Geology (Swiss Method); these maps were obtained by a joint collaboration between the Modena and Milano research partners;
8. Maps of vulnerable elements (1:10 000 to 1:5000), con-taining information on the spatial distribution and at-tributes of public and private buildings, network facil-ities, and economic activities in the area. Documen-tation of injuries, property damage, economic disrup-tion, relief and repair cost, and environmental conse-quences concerning past events was also collected and stored as key requirements in the process of understand-ing prospective losses, if similar events occur again in the future (source: Milano research partner).
9. Social and economic characteristics and trends of the study area: a systematic survey enabled the creation of a social, demographic and economic profile of the com-munity at risk (source: Milano research partner).
5 Results
5.1 Plan Pezzi`e hazard scenario
Within the municipality of Corvara in Badia several natural processes act on the landscape and threaten the community, buildings, infrastructure and environment. Landslide suscep-tibility maps together with maps of vulnerable elements de-scribed Plan Pezzi`e area as a “critical zone”: an area clas-sified as highly susceptible with the presence of elements at risk. In effect, many debris flows have affected in the past years (and could affect in the future) the territory and its com-munity. In particular, historical records (Table 1), local news, and interviews of local people suggested the central sector of this area as a potential source of danger. We decided to choose it as a suitable test-site (Plan Pezzi`e hazard scenario) for an initial application of the methodology proposed in this study.
On a more detailed scale, all available information was used to better characterise the hazard scenario, obtaining a spatial distribution of areas of different hazard levels based on landslide magnitude and frequency.
According to the Swiss rules (Fig. 5), a medium to high value of intensity was defined for the source area (107 496 m2), considering a low geometric severity (related to a low thickness of the involved materials), and velocity rates from very to extremely rapid. Available data and ex-pert opinion suggested indicative return periods lower than 30 years. A level of hazard equal to H4 was derived. The de-positional area (618 349 m2) was characterised by a moderate intensity value in relation to a moderate to rapid velocity rate and a moderate geometric severity. Two different indicative return periods were defined: the former was between 30 and 100 years: a hazard level equal to H3 was derived. The lat-ter was between 100 and 300 years and it was related to an area partially sheltered from debris flows by means of an-thropic mitigation/protection structures (drainpipes and de-fensive containment works): H2 was considered as the ap-propriate hazard level (Fig. 6).
5.2 Plan Pezzi`e vulnerability scenario
In this study, vulnerability was expressed using a heuristic (qualitative) scale considering the physical effects on built-up areas and infrastructure. Hotels, public and private build-ings, national and local roads, water lines and penstocks were considered vulnerable by the profiled fast-moving earth-debris flow. Damage to the vulnerable assets was inferred within each hazardous area, considering an estimated thick-ness of the piled-up debris varying from 1.0 m up to 2.0 m (the lower thickness was used in areas sheltered by protec-tion structures). Moreover, damage was defined indepen-dently for each different type of elements at risk and both the time required to recover and/or restore the damage and
Fig. 5. Swiss Method matrix (source: Heinimann et al., 1998; Raetzo et al., 2002) for the definition of hazard levels (intensity vs frequency).
Diagonal and horizontal crossed lines represent hazard levels assigned to the source and to the depositional areas within Plan Pezzi`e scenario, respectively.
Table 2. Prospective physical effects due to the occurrence of the profiled event. Vulnerability of built-up areas and infrastructure is
heuristically described in terms of aesthetical (minor), functional, and structural damage.
Hotels, private and National and local Water lines and
public buildings roads penstocks
Damage to road signs and
Aesthetic or Damage to outer walls guardrails Covering by debris material
minor damage
Damage to pipes and pipe
Functional Damage to inner walls Covering by debris material fittings
damage
Ground floor filling up Damage to furniture Damage to electric plants Damage to doors and windows
Structural No No No
damage
the importance of the elements at risk to the potential users were considered.
In Plan Pezzi`e scenario, no elements at risk are located in the source area (H4) where structural damage would be expected. Given the physical characteristics of the poten-tial event, a rapid destruction of buildings and infrastructure would be quite possible and people are at risk of injury both inside and outside buildings: an area where development should be strongly prohibited. In the upper part of the de-positional area (H3), functional damage to buildings should be expected, but not destructions as long as the construction
type was adapted to the present conditions; people are at risk of injury outside buildings. Land use planning and appropri-ate protective measures were put into practice to decrease the hazard level. In the lower part of the depositional area (H2), functional/aesthetic damage to buildings is possible and peo-ple are at a low risk of injury outside buildings. This area is mainly an alerting domain, where people should be notified of the possible risks.
Specifically, in regard to the hotels, private and public buildings, it was assumed that the earth-debris flow may fill up the ground floors (1.0 to 2.0 m, in relation to position of
9 9 9 9 9 99 9 9 9 99 9 99 8 8 8 u u 8 9 9 9 # # # # # # # # # # # # # # # # # # # # # # # # # # # # # # # # H4 H3 H2 N E W S Legend Y Public Building Buildings at risk 9 Hotel 8 Private Building Hazard levels H4 H3 H2 Roads National road (SS243) Local roads Mitigation works Drainpipes and containment works
Cableways and ski lifts
Sky facilities
# Pilons
0 0.2 0.4 km
Fig. 6. Plan Pezzi`e hazard scenario. Crossed lines represent the spatial distribution of hazard levels assigned to the source and to the
depositional areas (royalties on Digital Orthophoto: Autonomous Province of Bolzano-Autonome Provinz Bozen-Sudtirol).
the affected elements), causing damage to furniture, electric plants, and door and windows frames. Both inside and out-side walls are affected, requiring cleaning up, waterproofing, whitewashing/plastering and painting operations. Damage to transportation network was also considered. For national and local roads no destruction was expected and, considering the event characteristics, the traffic could be interrupted for a short period (2 to 3 days), determining a longer travel time. Both water lines and penstocks could be affected, loosing their function for a short time interval (Table 2).
5.3 Plan Pezzi`e risk scenario
Finally, an indicative level of risk to assets was defined (Plan Pezzi`e risk scenario), combining the hazard level and the de-gree of physical effects due to the expected damaging event (Table 3). The former ranges from H2 (for the depositional area) to H4 (for the source area). The latter varies from “aesthetic” to “functional”, in relation to the type and to the spatial location of the vulnerable elements, moving from the lower part of the depositional area up to the built-up sectors. The resulting level of risk may be qualitatively estimated as follow (Figs. 7, 8):
– Very low: this level of risk was selected for all sectors without elements at risk, apart from the hazard level. – Low: this level of risk was assigned to the lower part
of the depositional area (H2) where local roads and ski
Table 3. Qualitative estimation of the risk level in the study area
based on hazard levels and physical effects. Hazard level H2 in-volves two different risk levels on the base of the type of the ele-ments at risk and of their spatial location in relation to the source of danger.
Hazard level Physical effects Risk level
H1 Aesthetic damage Very Low Risk
H2 Aesthetic damage Low Risk
H2 Functional damage Moderate Risk
H3 Functional damage High Risk
H4 Structural damage Very High Risk
facilities were located. Engineers, architects and land surveyors suggested a low level of risk: the spatial loca-tion of the elements at risk made them not accountable for severe physical effects.
– Moderate: this level of risk was assigned to the areas characterised by a hazard level equal to H2 and by the presence of many elements at risk directly related to the social and economic activities. In this area func-tional/aesthetic damage would be expected.
Table 4. Values ( C/m2and C/m3) used in economic analysis to quantify direct damage affecting hotels, private houses and public buildings.
Operations and cost Hotels Private Public
houses buildings Reco v ery Operations Demolition of walls ( C/m2) 87 87 87 Reconstruction of walls ( C/m2) 67 67 67 Debris excavation ( C/m3) 52 52 52 Debris removal ( C/m3) 25.5 25.5 25.5
Transportation and storage ( C/m3) 26 26 26
Restoration Operations
Inner walls cleaning up, waterproofing, 7 7 7
whitewashing/plastering and painting ( C/m2)
Outer walls cleaning up, waterproofing 10 10 10
and quartz painting ( C/m2)
Restore electric plants ( C/m3) 25 22 22
Restore and replace furniture and door 400–600 300–400 400–600
and window frames ( C/m2)
# # # # # # # # # # # # # # # # # # # # # # # # # # # # # # # # 9 9 9 9 9 99 9 9 9 99 9 99 8 8 8 u u 8 9 9 9 N E W S Legend Y Public Building Buildings at risk 9 Hotel 8 Private Building Risk levels Low Risk Moderate Risk High Risk Very Low Risk
Roads National road (SS243) Local roads Mitigation works Drainpipes and containment works
Cableways and ski lifts
Sky facilities
# Pilons
0 0.2 0.4km
Fig. 7. Plan Pezzi`e risk scenario. Crossed lines represent the spatial distribution of risk levels (royalties on Digital Orthophoto: Autonomous
Province of Bolzano-Autonome Provinz Bozen-Sudtirol).
sector of the scenario (H3). In spite of the presence of mitigation/protection structures, local experts did not consider this area as safe as the one aforementioned. In our scenario there are no areas characterised by a very high level of risk.
5.4 Economic consequence analysis
In the last step, an estimate of the prospective economic con-sequences was performed. Available historical data does not account for structural damage requiring the partial or com-plete destruction/reconstruction of the elements at risk, given
Legend Mitigation works Drainpipes and containment works 0 0.2 0.4 km N E W S VLR VLR VLR VLR VLR VLR MR = Moderate Risk Risk levels Low Risk Moderate Risk High Risk LR = MR = HR = VLR = Very Low Risk
Fig. 8. 3-D representation of the spatial distribution of risk levels. Dark and light sectors symbolize the source and the depositional areas
of the earth-debris flow, respectively (royalties on Digital Elevation Model and Digital Orthophoto: Autonomous Province of Bolzano-Autonome Provinz Bozen-Sudtirol).
the physical characteristics of the damaging phenomenon and the presence of protection structures. For this reason, only functional and/or aesthetic damage, that requires recov-ery and restoration operations, was considered. Recovrecov-ery op-erations involve debris removal, transportation to and accu-mulation in waste disposal areas; restoration operations are different in relation to the affected elements (as listed in Ta-bles 4 and 5).
Market values, insured values, construction and repair cost, and available indexes (expressed in /m, /m2, /m3, or in %, and derived from empirical estimates made by engi-neers, architects, land surveyors, and from interviews of local building companies), were applied to the vulnerable assets (Tables 4, 5) to obtain an expected monetary equivalent.
As listed in Tables 6, 7 and 8, the total amount of estimated direct damage may be quantified in 8 913 000 . Power lines, gas pipelines, and sewers were excluded from the assets at risk because they are buried and not subject to damage. The position of ski facilities in the outermost part of the depo-sitional area makes them probably safe from risk (they are about 370 m away from the nearest buildings).
The estimate of direct losses was followed by an economic evaluation of indirect damage. Two different temporal sce-narios were considered; the first is during the autumn sea-son, positing a damaging event between October and the end of November. Historical data report landslide events at this time. Autumn is not a tourist season but considering an expected closing time of 60 to 120 days for eighteen af-fected hotels, consequences could be extended into the win-ter tourist season. The expected closing time was based on the potential number of affected structures, on the adverse
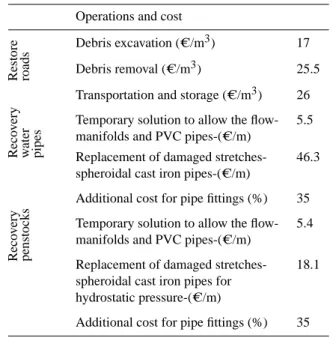
Table 5. Values ( C/m, C/m3and %) used in economic analysis to quantify direct damage affecting roads, water pipes and penstocks.
Operations and cost
Restore roads
Debris excavation ( C/m3) 17
Debris removal ( C/m3) 25.5
Transportation and storage ( C/m3) 26
Reco v ery w ater pipes
Temporary solution to allow the flow- 5.5
manifolds and PVC pipes-( C/m)
Replacement of damaged stretches- 46.3
spheroidal cast iron pipes-( C/m)
Additional cost for pipe fittings (%) 35
Reco
v
ery
penstocks
Temporary solution to allow the flow- 5.4
manifolds and PVC pipes-( C/m)
Replacement of damaged stretches- 18.1
spheroidal cast iron pipes for hydrostatic pressure-( C/m)
Additional cost for pipe fittings (%) 35
weather conditions during the winter season, and on the num-ber of local building companies able to recover/restore build-ings according to local rules and codes. Considering this temporal scenario and estimating 2 to 3 days as the time nec-essary for restoring the national road, the hotels not directly involved would not suffer a significant reduction in revenues.
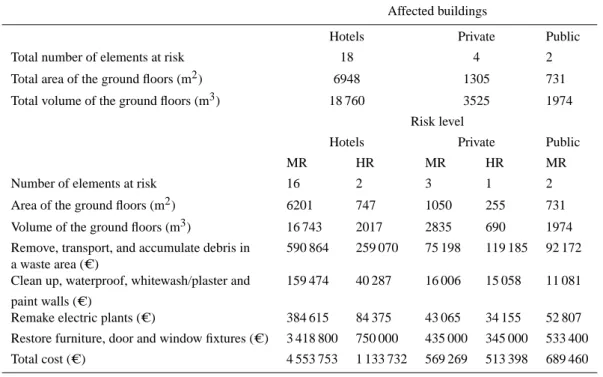
Table 6. Estimated total direct cost for hotels, private houses and public buildings in areas affected by different risk levels (MR = Moderate
Risk; HR = High Risk)
Affected buildings
Hotels Private Public
Total number of elements at risk 18 4 2
Total area of the ground floors (m2) 6948 1305 731
Total volume of the ground floors (m3) 18 760 3525 1974
Risk level
Hotels Private Public
MR HR MR HR MR
Number of elements at risk 16 2 3 1 2
Area of the ground floors (m2) 6201 747 1050 255 731
Volume of the ground floors (m3) 16 743 2017 2835 690 1974
Remove, transport, and accumulate debris in 590 864 259 070 75 198 119 185 92 172
a waste area ( C)
Clean up, waterproof, whitewash/plaster and 159 474 40 287 16 006 15 058 11 081
paint walls ( C)
Remake electric plants ( C) 384 615 84 375 43 065 34 155 52 807
Restore furniture, door and window fixtures ( C) 3 418 800 750 000 435 000 345 000 533 400
Total cost ( C) 4 553 753 1 133 732 569 269 513 398 689 460
Table 7. Estimated total direct cost for roads crossing areas affected by different risk levels (LR = Low Risk; MR = Moderate Risk; HR =
High Risk).
Affected roads
National road Local roads
Total length (m) 522 1848
Risk level
National road Local roads
MR HR LR MR HR
Length (m) 485 37 713 959 176
Recover the structure 282 220 21 530 414 890 558 033 102 413
and restore the original practicability conditions ( C)
Total cost ( C) 282 220 21 530 414 890 558 033 102 413
In the autumn scenario, indirect damage related to the clos-ing period of the hotels directly involved may be quantified at 4 675 000 (if a 60 days interruption of activity is consid-ered) or 9 350 000 (if a 120 days interruption of the activities is assumed).
As for private buildings, indirect cost is related to the re-allocation of the families living in the four involved houses. At this time, it is difficult to evaluate the amount of indi-rect cost, due to a lack of information. More data should be collected through interviews of the families potentially
in-volved. In this way it would be possible to verify if they own other houses in the neighbourhood of Corvara, or if they are obliged to choose a temporary accommodation during the disaster management period.
Indirect consequences should be quantified for public buildings (a bank office and the Town Hall). Both these services could be considered not essential in the aftermath of disaster, and the interruption of their activities probably should not cause serious consequences in terms of indirect cost. If the Town Hall is declared inaccessible for a short
time, its facilities can be moved to other buildings not di-rectly affected by the event. Similar considerations may be done for the bank office; other offices of the same banking company, located within few kilometres, may accomplish loan and credit operations.
The interruption of the national road (SS 243) may cause an increase in transportation cost of goods and commodities equal to 34.5 for a longer travel space of about 24 km (own elaboration from Gamba, 2002): in effects, vehicles coming from the Gardena Pass have to choose alternative routes to Corvara. Considering an interruption of 2 to 3 days and an average traffic flow of about 73 trucks and vans per-day, it is possible to estimate an increase in transportation cost of about 15 000 .
Considering the time required to perform recov-ery/restoration operations, indirect damage are mainly caused by the decreased number of tourists in hotels directly involved. This outcome may be explained considering the temporal scenario: autumn is not a tourist season and the occurrence of a landslide should not determine severe consequences for the hotels that do not suffer physical damage. In this scenario, direct damage is comparable to the indirect one (especially if a recovery time of 120 days is considered).
Damage to the local ski facilities were not considered. But if they are affected by severe damage that cause a delay in the opening date of the winter ski season, indirect damage will be higher than the direct ones. In effect, socio-economic anal-ysis showed that most of the winter tourists are involved in skiing activities. The consequence of the decrease in tourist flow may affect the entire ski-district, given the strategic im-portance of these ski facilities. They are part of the ski-tour of the four Dolomite Passes which joins four Ladin valleys: Gardena, Badia, Fassa, and Arabba, covering a total length of 40 km.
The second temporal scenario is during the summer sea-son, from July to August. Historical records report debris flows triggered by rainfall of short duration and high inten-sity. Because this is a period of high tourist flow, severe eco-nomic consequences would immediately affect hotels both directly and indirectly.
For hotels directly involved, we considered between 60 to 90 days to perform recovery/restoration operations; for a 60 day-scenario, the outcome of the analysis lead to an in-direct cost of about 2 840 000 ; this result grows up to more than 4 260 000 if a 90 day-scenario is considered. 90 days was preferred to 120 days (autumnal scenario) considering that good weather conditions should reduce the number of recovery days.
For hotels indirectly involved, damage is caused by the reduction of the tourist flow, due to the interruption of the national road (SS243). Statistical data (analysed by the local tourist agency), highlighted:
1. 95% of the summer tourists would stay in Corvara one
Table 8. Estimated total direct cost for water lines and penstocks in
areas affected by different risk levels (MR = Moderate Risk; HR = High Risk).
Affected structures Water lines Penstocks
Total length (m) 945 256
Risk level Water lines Penstocks
MR HR
Temporary solution to keep the flow 7080 1866 (manifolds and PVC pipe fittings)( C)
Replacement of damaged stretches 59 118 6248 (spheroidal cast iron pipe) ( C)
Total cost ( C) 66 198 8114
week. It is reasonable that they will choose to reach Corvara even if they have to increase their travelling time and cost.
2. 5% of the summer tourists would spend only a weekend in Corvara. It is reasonable to assume that about 20% of the tourists will not reach Corvara changing their hol-iday destination (according to their behavioural prefer-ence, Machina, 1982). This figure cannot be considered as a critical situation able to affect indirect losses. The increase in cost for goods and commodities transport may be similar to the autumnal scenario, considering a com-parable average traffic flow. Similar considerations can be done for private and public buildings.
Finally, it is possible to highlight that also during a sum-mer event, indirect damage mainly derives from a decrease in the tourist flow to hotels directly involved.
6 Uncertainties
Many input parameters used in this study are characterised by an inherent degree of variability and uncertainty and this has always to be considered when discussing risk analysis results. End users have to clearly understand the degree of uncertainty related to each parameter, the origin and the sig-nificance of this uncertainty, and the implication that it has on final results. In this study we inferred landslide magni-tude and frequency from historical records, local interviews, and expert knowledge, experience, and judgement; and that certainly produced a medium to high level of uncertainty on final results.
Uncertainty also arises in the definition of vulnerability, which is characterised by several factors that need to be eval-uated, many of these may not be readily quantifiable. So, if
they are to be included in risk analysis, the role of knowl-edge and judgement may play a crucial role, as in this study, and vulnerability assessment becomes a somewhat subjective procedure.
A low level of uncertainty is related to economic anal-ysis in terms of economic assessment of assets and trends in the study area. On the contrary, a high degree of uncer-tainty is related to the results of economic analysis (prospec-tive consequences): in effect, they were derived consider-ing pre-defined hazard and vulnerability scenarios, each of which characterised by many assumptions and estimates.
More detailed data is necessary to reduce the degree of uncertainty to an acceptable level; but, if that is impossible, sensitivity analyses should be performed to evaluate the ef-fect of changing assumptions or estimates in each scenario; and this is the aim of future studies. Moreover, the develop-ing of an advanced understanddevelop-ing of how mountain hydro-geomorphologic processes behave and the application of this understanding for long-term living with risk are among the topics of a new European Project (Mountain Risks: from prediction to management, 2007) in which the authors are involved together with eleven European teams.
Finally, as recommended by IUGS Working Group on Landslides–Committee on Risk Assessment (1997), Heini-mann (1999), and Bell and Glade (2004a), the final results of a risk analysis should be treated as relative and not as abso-lute values.
7 Conclusions
The multi-disciplinary methodological approach proposed in this study is based on a “cause-effect” correlation, on the “scenario mapping” method, and on rules and assumptions derived from social and environmental economics useful to get an economic analysis of the prospective consequences. The “cause-effect” correlation was firstly analysed from a physical point of view. The cause, the natural event, was cor-related to the effects, i.e. the aesthetic, functional, and struc-tural damage to the exposed elements. Then, an understand-ing of the possible physical effects due to the occurrence of a damaging event allowed us to evaluate economic conse-quences in terms of direct and indirect losses. To achieve this aim we studied and analysed the assets allocated in the exposed area, the tourist flows, the transport of goods and commodities and the social and economic trends acting in the area. The study shows the importance of indirect losses, which are as significant in magnitude as direct losses.
The study was performed at a very local scale (1:5000– 1:10 000) but the proposed methodology could be applied also to a cluster of neighbouring municipalities or to a wider administrative entity. This analysis was carried out through documentations of past events and their consequences in terms of property damage, economic disruption, relief and repair cost, and environmental consequences. This type of
data was collected in municipal, provincial, regional, and na-tional archives, often in digital format.
We pursued the following steps to achieve this aim: 1. The definition of a specific hazard scenario, with its own
physical and geometric characteristics;
2. The inventory of the elements at risk and the study of the social and economic trends acting in the area; 3. The description and the analysis of the physical effects
(vulnerability scenario), derived from the occurrence of a potentially damaging phenomenon;
4. The definition of an indicative risk scenario;
5. The estimate of the prospective social and economic consequences (direct and indirect damage), within the profiled risk scenario: the cost for recovery/restoration operations of assets involved, the reduction of revenues and the increase in cost were analysed.
The loss assessment performed in the study was not only a simple accounting of direct damage but also a more detailed loss analysis, focused to consider and quantify also the in-direct economic consequences due to the event. In effect, the analysis shows the importance of indirect damage that is comparable to direct damage (Fig. 9). It is important to underline that, while direct damage is strictly related to the physical characteristics of the assets involved, indirect dam-age mainly depends on the role and importance of the assets in the local economy. Moreover, indirect damage affects a wider area than that directly involved in the landslide, and for a longer period of time.
Finally, in Plan Pezzi`e scenario a high correlation was found between direct and indirect losses and the frequency and the period of the year affected by the damaging event. As aforementioned, the frequency may be of great relevance in determining direct damage while the period of the year mostly affects indirect damage.
A risk analysis for this failure-prone area was considered an important process for:
1. Establishing a sound rationale for risk reduction pro-grams based on historical economic and social impacts; 2. Evaluating the cost-effect ratio of proposed mitigation
actions for this landslide-prone area;
3. Creating mechanisms for risk sharing involving the pub-lic and private sectors through insurance, special assess-ment districts, or other financial risk pooling;
4. Sharing responsibility for landslide-related cleanup, re-pair, and rehabilitation cost;
5. Understanding the non-economic consequences of a landslide event (environmental and psychological con-sequences).
Fig. 9. Direct and indirect damage for different scenarios. Values were estimated by economic analysis (E) or by interpolation (I).
A comprehension of the social and economic losses in Plan Pezzi`e scenario can be considered as crucial for future deci-sions on landslide risks. As articulated in the National Re-search Council “red book” (NRC, 1983), risk analysis is the first step to making decisions for managing a particular risk. As emphasized in a more recent NRC report (1996), risk analysis can be an important process (and not just a techni-cal undertaking) to inform stakeholders about potential con-sequences and to gain consensus about appropriate steps to address potential harms. Moreover, it is our opinion that all the citizens should understand the risks they are faced with and actively take part in the definition of mitigation and pre-vention measures. Understanding the risk posed by poten-tial landslides is a key point for determining appropriate risk management strategies. This aim can be achieved by assess-ing the cost of managassess-ing risk and the direct and indirect ben-efits and by optimising the allocations of available resources. For this reason the results of a risk analysis are among the most valuable information for risk evaluators (dealing with risk perception and acceptance of the involved people) and risk managers (combining the results of risk analysis and risk evaluation to find the most appropriate solutions). In effect, the management of risk (planning, prevention, and mitiga-tion measures) looks for the best trade-off between poten-tial benefits (lack of loss) and cost for risk control and dam-age reduction. Coupling the earth scientists overview with the necessities of public administrators and decision makers, passing through economic theory (Varian, 1990), the man-agement of risk is a function of balancing between the cost for risk control, its reduction to an acceptable level, and the potential benefits.
Despite all possible improvements, a certain degree of un-certainty will always remain in hazard and risk analysis, be-cause of the uncertainties of each input factor. For this rea-son, the final results have to be treated as relative and not as absolute.
Acknowledgements. This paper is part of the European
Com-mission Project “Assessment of Landslide Risk and Mitigation
in Mountain Areas, ALARM” (contract EVG1–CT–2001–
00038), Fifth Framework Programme. The authors are grateful to O. Maquaire and J.-P. Malet (University of Caen, Basse-Normandie), G. L. Raines (USGS, Nevada), and T. Glade (University of Wien, Austria) whose pertinent comments and suggestions have improved the quality of this paper. Our special thanks belong to P. Reichenbach (CNR-IRPI, Italy) and to another anonymous reviewer for the helpful comments and suggestions on the manuscript. Finally, the study benefited greatly through the contributions of A. Corsini, M. Panizza and M. Soldati (Geological Department of the University of Modena, Italy).
Edited by: T. Glade
Reviewed by: P. Reichenbach and another anonymous referee
References
AGS: Australian Geomechanics Society Subcommittee on land-slide Risk Management: Landland-slide Risk Management: Concepts and Guidelines, Australian Geomechanics Journal, 35, 1, 49–92, 2000.
Agterberg, F. P., Bonham-Carter, G. F., and Wright, D. F.: Weights of Evidence modelling: a new approach to mapping mineral po-tential, in: Statistical Applications in the Earth Sciences, edited