33. Katan MB, Deslypere JP, van Birgelen AP et al. Kinetics of the incorporation of dietary fatty acids into serum cholesteryl esters, erythrocyte membranes, and adipose tissue: an 18-month con-trolled study. J Lipid Res 1997; 38: 2012–2022
34. Pawlosky RJ, Hibbeln JR, Novotny JA et al. Physiological com-partmental analysis of alpha-linolenic acid metabolism in adult humans. J Lipid Res 2001; 42: 1257–1265
35. Emken EA, Adlof RO, Gulley RM. Dietary linoleic acid influences desaturation and acylation of deuterium-labeled linoleic and lino-lenic acids in young adult males. Biochim Biophys Acta 1994; 1213: 277–288
36. Leaf DA, Connor WE, Barstad L et al. Incorporation of dietary n-3 fatty acids into the fatty acids of human adipose tissue and plasma lipid classes. Am J Clin Nutr 1995; 62: 68–73
37. Montoya MT, Porres A, Serrano S et al. Fatty acid saturation of the diet and plasma lipid concentrations, lipoprotein particle concentrations, and cholesterol efflux capacity. Am J Clin Nutr 2002; 75: 484–491
38. Iggman D, Gustafsson IB, Berglund L et al. Replacing dairy fat with rapeseed oil causes rapid improvement of hyperlipidaemia: a randomized controlled study. J Intern Med 2011; 270: 356–364 39. Bjermo H, Iggman D, Kullberg J et al. Effects of n-6 PUFAs
com-pared with SFAs on liver fat, lipoproteins, and inflammation in abdominal obesity: a randomized controlled trial. Am J Clin Nutr 2012; 95: 1003–1012
40. Sun Q, Ma J, Campos H et al. Comparison between plasma and erythrocyte fatty acid content as biomarkers of fatty acid intake in US women. Am J Clin Nutr 2007; 86: 74–81
41. Ratnayake WM, Galli C. Fat and fatty acid terminology, methods of analysis and fat digestion and metabolism: a background review paper. Ann Nutr Metab 2009; 55: 8–43
42. Bjermo H, Riserus U. Role of hepatic desaturases in obesity-related metabolic disorders. Curr Opin Clin Nutr Metab Care 2010; 13: 703–708
Received for publication: 16.7.2012; Accepted in revised form: 8.9.2012
Nephrol Dial Transplant (2014) 29: 136–145 doi: 10.1093/ndt/gft345
Advance Access publication 3 October 2013
Determination of uromodulin in human urine: in
fluence of
storage and processing
Sonia Youhanna
1,*,
Julien Weber
1,*,
Viviane Beaujean
2,
Bob Glaudemans
1,
Jens Sobek
3and Olivier Devuyst
1,21Institute of Physiology, Zurich Center for Integrative Human Physiology, University of Zurich, Zurich, Switzerland,
2Division of Nephrology, Université catholique de Louvain Medical School, Brussels, Belgium and
3Functional Genomics Center Zurich, Zurich, Switzerland
Correspondence and offprint requests to: Olivier Devuyst; E-mail: [email protected]
*S.Y. and J.W. contributed equally to this study.
Keywords: biomarker, ELISA, Tamm–Horsfall protein, uro-modulin-associated kidney disease
A B S T R AC T
Background. Uromodulin (Tamm–Horsfall protein) is the most abundant protein excreted in the urine under physiological conditions. It is exclusively produced in the kidney and secreted into the urine via proteolytic cleavage. The involvement of UMOD, the gene that encodes uromodulin, in rare autosomal
dominant diseases, and its robust genome-wide association with the risk of chronic kidney disease suggest that the level of uro-modulin in urine could represent a critical biomarker for kidney function. The structure of uromodulin is complex, with multiple disulfide bonds and typical domains of extracellular proteins. Methods. Thus far, the conditions influencing stability and measurement of uromodulin in human urine have not been
ORIGINAL
systematically investigated, giving inconsistent results. In this study, we used a robust, in-house ELISA to characterize the conditions of sampling and storage necessary to provide a faithful dosage of uromodulin in the urine.
Results. The levels of uromodulin in human urine were sig-nificantly affected by centrifugation and vortexing, as well as by the conditions and duration of storage.
Conclusions. These results validate a simple, low-cost ELISA and document the optimal conditions of processing and storage for measuring uromodulin in human urine.
IN TRO DU CT IO N
Urinary biomarkers constitute an essential tool for the diagno-sis, classification and prognosis of kidney diseases [1]. Recent evidence pointed at uromodulin (Tamm–Horsfall protein) as a potential urinary biomarker relevant for renal function, chronic kidney disease (CKD) and hypertension [2,3]. Uromo-dulin is a 105 kDa glycoprotein with seven N-glycosylation sites and a high-mannose chain. The protein contains 616 amino acids including 48 cysteine residues that are all engaged in the formation of disulphide bonds. Uromodulin contains three epi-dermal growth factor-like domains and a zona pellucida domain found in many extracellular proteins, as well as a glyco-sylphosphatidylinositol-anchoring site [3]. Uromodulin is a kidney-specific protein that is exclusively synthesized in the epi-thelial cells lining the thick ascending limb (TAL) of Henle’s loop [4]. After proper trafficking and maturation in TAL-lining cells, uromodulin reaches the apical plasma membrane, to be cleaved and assembled in the urine as polymers forming a gel-like structure [5].
Uromodulin is produced at a very high rate in the TAL, and is by far the most abundant protein in normal urine (excretion: 50–100 mg/day) [6]. Functions attributed to uromodulin include protection against urinary tract infections; prevention of renal calculi formation by reducing aggregation of calcium crystals and influencing transport processes by regulating the activity of the sodium-potassium-chloride co-transporter (NKCC2) and/or the potassium channel ROMK [7, 8]. Interest for uromodulin was re-ignited when it was discovered that mutations in the UMOD gene that codes for uromodulin are responsible for a series of monogenic disorders (familial juvenile hyperuricaemia nephropathy, medullary cystic kidney disease type 2 or glomeru-locystic kidney disease) all known as uromodulin-associated kidney diseases (UAKD) [3]. These disorders are characterized by severe tubulointerstitial damage, defective urinary concen-tration, hyperuricaemia and gout, and progressive renal failure [9]. The mutations often affect cysteine residues, resulting in con-formational changes and intracellular aggregates of uromodulin. In turn, the secretion of the protein by the TAL cells is altered, re-sulting in a strong decrease in the urinary excretion of uromodu-lin [10–12]. Recently, a number of genome-wide association studies revealed that variants in the UMOD gene are associated with markers of renal function and risk of developing hyperten-sion and CKD in the general population [13–15]. The association of uromodulin with both monogenic diseases and complex dis-orders such as CKD and hypertension provides a strong rationale
for evaluating its urinary concentration as a biomarker for renal function and CKD.
The determination of uromodulin in the urine is hampered by its capacity to aggregate and the potential instability of such a complex protein. Documentation of sampling, processing and storage conditions is thus crucial for accurate uromodulin quantification. Despite the early characterization of antibodies specific for human uromodulin [16], the few reports on uro-modulin dosage yielded conflicting results in terms of stability, storage conditions and processing of human urine [17–20]. Important points such as the potential influence of urine cen-trifugation or vortexing, acidification or alkalinization, treat-ment with protease inhibitors, or normalization for urinary creatinine remain unsolved. Furthermore, earlier immunoas-says were often based on poorly documented anti-uromodulin antibodies. Considering the increasing interest for a determi-nation of uromodulin in the urine, the need for a high-throughput assay, and the limited and contradictory infor-mation available, we developed and characterized a enzyme-linked immunosorbent assay (ELISA) for uromodulin and used this assay to investigate the stability of uromodulin under different treatment and storage conditions of human urine.
M AT E R I A L S A N D M E T H O D S
Urine sample collection, storage and handling
Analyses were performed on second morning urine samples collected (mid-stream) in a sterile container from healthy volunteers aged 18–50 years, and processed within 2 h. This protocol was approved by the Ethical Committee of the Univer-sité Catholique de Louvain.
The influence of human urine sample processing on the determination of uromodulin (Figure1) was tested after vor-texing the sample for 10 s (Vortex-Genie 2; FAUST, Schaff-hausen, Switzerland); centrifugation for 10 min at 3600 r.p.m. (Eppendorf Centrifuge 5430, Hamburg, Germany) at room temperature (i.e. standard protocol for urine processing and removing cells and debris [21]); treatment with protease inhibitors (Leupeptin 1 µmol/L; Sigma-Aldrich, St. Gallen, Switzerland; sodium azide 10 mmol/L); pH adjustment per-formed by drop titration with 1 N HCl (to pH 2.0) or with 1 N NaOH (to pH 8.0) using a Hanna HI 2211 pH meter; dilution using ultrapure deionized water (Destamat Bi 18E; QCS, Maintal, Germany) versus triton-EDTA (TEA) buffer (0.5% Triton X-100, 20 mM ethylenediaminetetraacetic acid (EDTA), pH 7.5). The effect of storage conditions was tested by comparing baseline levels with 1-week and 5-month storage at room temperature, +4°C and −20°C; 4- and 8-month storage at −80°C; five cycles of freezing–thawing (sample kept at−80°C for 48 h followed by thawing on ice). Different sample sets were used to evaluate the influence of the various processing conditions as described.
Uromodulin ELISA
The in-house ELISA for uromodulin is a colorimetric based sandwich immunoassay using a sheep anti-human uromodulin antibody (Meridian Life Science, Memphis, TN, USA;
ORIGINAL
K90071C) as the capture antibody. This antibody gives a single arc when tested by immuno-electrophoresis against fresh urine. The primary antibody was a monoclonal anti-human uromo-dulin antibody (Cedarlane Laboratories, Burlington, NC, USA; CL 1032A) raised in mouse and validated in solid phase radio-immunoassay. The secondary antibody was a goat anti-mouse IgG (H + L) horseradish peroxidase conjugated (Bio-Rad, Cres-sier, Switzerland; 172.1011). The substrate was O-Phenylenedia-mine dihydrochloride (OPD) (10 mg/tablet) (Sigma-Aldrich). The OPD substrate solution was freshly prepared by dissolving a tablet in 25 mL of phosphate-citrate buffer [0.1 M citric acid monohydrate, 0.2 M Na2HPO4], pH 5.5. A volume of 5 µL 30% H2O2 was added to 25 mL of substrate solution. Human uro-modulin (Millipore, Billerica, MA, USA) was used to establish the standard curve, with freshly prepared serial dilutions from the standard stock solution (100 µg/mL). Both the standard curve and a standard sample (uromodulin concentration 25 µg/ mL) were systematically used for quality control (QC).
The determination of urinary uromodulin by ELISA was carried out as follows: a 96-well microtitre plate (NUNC Maxi-Sorp™; eBioscience, Vienna, Austria) was coated with 100 µL of 5 µg/mL capture antibody in coating buffer [500 mM H3BO3, 500 mM KCl, 345 mM NaOH, pH 9.0]. The plate covered with adhesive seal was incubated at 4°C overnight then washed three times with freshly prepared washing buffer [0.1% Tween 20 in 10 mM phosphate buffer saline (PBS) pH 7.2 (PBS–Tween 0.1%)] using ImmunoWash 1575 Microplate Washer (Bio-Rad). Unoccupied sites on the plate were blocked with 100 µL blocking buffer [0.5% bovine serum albumin (BSA) in 10 mM PBS, pH 7.2] and incubated at 37°C for 1 h (rotation, 100 r.p.m.). The plate was then washed three times with washing buffer and placed upside-down on absorbent paper to remove residual buffer. One hundred microlitres of PBS–Tween 0.1% was dispensed in all wells. Urine samples were stabilized at room temperature then diluted 1:50 in ultra-pure deionized water, as preliminary testing revealed no sig-nificant difference versus dilution with TEA buffer (data not
shown). A volume of 100 µL per well was distributed into the coated wells after vortexing. Standards and QC sample were run in duplicate, whereas each urine sample was tested in three different dilutions. Deionized water was used as blank. After 1 h incubation at 37°C, the plate was washed three times and placed on absorbent paper. One hundred microlitres of primary antibody diluted in PBS–Tween 0.1% (1 µg/mL) was dispensed in each well; the plate was incubated at 37°C for 1 h (rotation, 100 r.p.m.) then washed three times. The secondary antibody diluted 1:2000 in PBS–Tween 0.1% was added to the wells for 45 min at 37°C and the plate washed three times. Colour was developed by adding 100 µL of OPD substrate sol-ution. The plate was incubated at room temperature in the dark for 1 min, and the reaction stopped by adding 50 µL of 2 M H2SO4 to each well. Optical density (Infinite M200Pro; Tecan, Grödig, Austria) was read at 492 nm and urinary uro-modulin concentration was determined by referring to the standard curve. Uromodulin levels obtained using the in-house ELISA were compared with the commercial ELISA from MD Bioproduct (St. Paul, MN, USA; M036020), following the protocol given by the manufacturer. This test has been used in several studies [13,22]. Urinary creatinine levels (normaliza-tion) were measured using the Synchron
®
System Creatinine Assay (Unicell DxC Synchron®
; Beckman Coulter, Brea, CA, USA), following the manufacturer’s instructions.Immunoblotting
Kidneys from Umod mice [23] were grounded in liquid ni-trogen and homogenized as described previously [12]. The homogenate was centrifuged at 1000 g for 15 min at 4°C and the resulting supernatant at 100 000 g for 120 min at 4°C. The pellet was suspended in homogenization buffer before deter-mination of protein concentration (Pierce BCA protein assay kit; Thermo Fischer Scientific, Rockford, IL, USA). Sodium dodecyl sulphate (SDS)–polyacrylamide gel electrophoresis for mouse and human samples was performed under reducing conditions. Samples (20 µg of mouse and human kidney
F I G U R E 1 :Processing of urine samples for uromodulin determination. Theflow chart describes how urine samples were collected and treated to validate the protocol of uromodulin determination. Grey boxes represent the standard treatment to measure uromodulin in the urine.
ORIGINAL
extract; 2 µL of urine) were loaded after being mixed with Laemmli sample buffer and heated for 5 min at 95°C (kidney samples). Proteins were separated on 10% SDS gel and trans-ferred to nitrocellulose membrane for western blotting. Mem-branes were blocked with 5% milk blot for 30 min at room temperature then incubated overnight at 4°C with either sheep or mouse anti-uromodulin antibodies (1:400 in 0.5% BSA blocking buffer). Secondary antibodies were goat anti-mouse horseradish peroxidase (HRP) conjugated (1:10 000) or poly-clonal rabbit anti-sheep HRP conjugated (1:1000), for 1 h at room temperature. Antigen-antibody reaction was detected by using enhanced chemiluminescence (Immun-Star HRP, Bio-Rad) and light-sensitive film (GE Healthcare, Glattbrugg, Switzerland). The molecular weight was estimated by running the Precision Plus Protein™ All Blue standard (Bio-Rad).
Deglycosylation and desialylation of uromodulin
Deglycosylation of uromodulin from human urine was carried out using peptide -N-Glycosidase F (PNGase F) (PNGase F P0704S; New England Biolabs, Ipswich, MA, USA) following the manufacturer’s protocol, whereas desialylation was performed according the protocol described by Parsons et al. [24]. Briefly, uromodulin was precipitated from pooled human urine (1.5 L) following the protocol of Tamm and Horsfall [2], dialysed overnight at 4°C and then lyophilized (Virtis, Kloten, Switzerland). Dry uromodulin was solubilized in 2.5 M acetic acid (10 mg/mL), heated for 3 h at 82°C, then washed three times with 15 mL PBS ( pH 7.2) on Centricon (MWCO 30000) cartridge (Millipore). Of note, 1.5 µL of de-glycosylated urine and 0.1 µL of desialylated uromodulin (versus 0.5 µL of untreated urine) were loaded on 10% acryl-amide gel and analysed as described above.
Immunohistochemistry
Colocalization of uromodulin with NKCC2 was carried out in cryosections of human and mouse kidney samples as pre-viously described [10, 12]. Briefly, 5-µm-thick cryosections were blocked with 1% BSA/0.02% sodium azide-PBS for 30 min at room temperature, incubated for 2 h at room temp-erature with the sheep (1:400) or mouse (1:200) antibodies against human uromodulin, followed by washing and incu-bation with AlexaFluor633-conjugated donkey anti-sheep or goat anti-mouse (1:200) for 90 min at room temperature. Uro-modulin-stained sections were then incubated with a polyclo-nal rabbit anti-NKCC2 antibody (Millipore; AB3562P; 1:100) for 3 h at room temperature, followed by washing and incu-bation with Alexafluor488-conjugated goat rabbit anti-bodies (1:200). Sections were viewed on a Leica SP5 confocal microscope.
Surface plasmon resonance: Biacore
The interaction between uromodulin and the capture anti-body was analysed by surface plasmon resonance, using a Biacore T100 system (GE Healthcare, Uppsala, Sweden). Chemicals were from Sigma unless otherwise noted. Binding experiments were performed in PBS buffer pH 7.4 containing 0.2% of Tween 20 at aflow rate of 30 µL/min at 25°C. Ultrapure and filtered water (‘MilliQ’; Millipore) was used for preparing
all solutions. The carboxymethyl dextran chip (CMD500L; XanTec bioanalytics, Düsseldorf, Germany) surface (1.2 mm2 area) was cleaned before use by injecting seven times a 50 mM NaOH solution containing 1 M NaCl for 30 s at aflow rate of 5 µL/min. Surface binding is expressed in terms of changes in response units (RU) with 1 RU being∼1 pg/mm2. Sheep poly-clonal anti-uromodulin antibody (300 nM) in PBS–Tween was immobilized by amine coupling to the chip surface activated with aqueous solutions of 0.4 M 1-(3-dimethylaminopropyl)-3-ethylcarbodiimide and 0.1 M N-hydroxysuccinimide for 300 s at 5 µL/min flow rate. For the determination of kinetic con-stants, a dilution series of four concentrations (19, 39, 78 and 156 nM) of uromodulin was injected using the T100 in multi-channel mode. The reference multi-channel used in parallel did not contain immobilized antibody, in order to detect background response and unspecific binding of analyte to the surface. Between two measurements, the surface was regenerated by in-jecting twice 10 mM glycine at pH 2 for 30 s, which completely removed uromodulin from the antibody. For data evaluation, the measured sensorgrams were referenced twice, first by subtracting the signal from the reference channel, and second by subtracting the signal obtained from injected pure buffer solution. Kinetic curves were evaluated using Biacore T100 Evaluation Software (v. 2.0.2). A globalfit was performed using the entire concentration series. Rate constants for association and dissociation were calculated by taking a 1:1 binding model as a basis.
Data analysis
Data were analysed using Statistical Package for Social Sciences (SPSS) version 19 (IBM Corp., Armonk, NY, USA). The Pearson correlation coefficient was used for correlation analysis, whereas analysis of variance (ANOVA) and paired t-test were used for comparisons between the groups. A Bland–Altman plot was used to evaluate agreement between uromodulin levels measured with the in-house ELISA and commercial kit. The level of significance was set to P < 0.05.
R E S U LTS
Characterization of the antibodies against human uromodulin
The antibodies used for the in-house ELISA were character-ized by immunoblotting and immunostaining (Figure 2). Immunoblot analysis of human urine and kidney samples in parallel with mouse kidney samples using the sheep polyclonal antibodies detected the uromodulin band at ∼100 kDa in all samples except the Umod knock-out (KO) kidney sample. The uromodulin band was also detected in human urine and kidney samples using the mouse monoclonal antibody (Figure2A, top panel). Both the polyclonal and monoclonal antibodies also appropriately identified the deglycosylated and desialylated forms of uromodulin (Figure2A, lower panels).
Staining of human and mouse kidney tissue samples with the mouse monoclonal or the sheep polyclonal antibodies detected uromodulin in the TAL, where it colocalized with NKCC2 at the apical surface area (Figure 2B). Surface
ORIGINAL
F I G U R E 2 :Characterization of anti-human uromodulin antibodies. (A) Western blot analysis (10% acrylamide gel) of human urine (2 µL), human kidney tissue (20 µg) and Umod knock-out (KO) and wild-type (WT) mouse kidney tissue (20 µg) using the sheep polyclonal or the mouse monoclonal antibodies against human uromodulin. A single band at∼100 kDa is detected with both antibodies, and absent in the Umod KO mouse kidney (top panel). The changes in molecular mass resulting from deglycosylation (lower left panel) and desialylation (lower right panel) of uromodulin are evidenced by using both the polyclonal and monoclonal anti-uromodulin antibodies. Of note, 1.5 µL of deglycosylated urine and 0.1 µL of desialylated uromodulin (versus 0.5 µL of untreated urine) were loaded the gel. (B) Immunostaining of human cortical
ORIGINAL
plasmon resonance [25] was further used to characterize the uromodulin—antibody interaction (Figure 2C). As the isoelectric point of uromodulin ( pI = 3.2) is too low for its immobilization to a carboxymethyl dextran surface, the capture sheep anti-uromodulin antibodies were immobilized at the surface of a sensor chip, and a dilution series of uromo-dulin was injected. For the interaction of immobilized sheep anti-uromodulin antibody with uromodulin, rate constants for association (kon) and dissociation (koff) of 4 × 10⁴M−1s−1and 4 × 10⁻⁴s−1, respectively, were determined, giving a dis-sociation constant KD(=koff/kon) of 10 nM. We also measured a strong binding response for the interaction of mouse anti-human uromodulin antibody to the sheep anti-uromodulin antibody—uromodulin complex. This situation is comparable with the conditions in ELISA (see below). Regeneration of the surface with 10 mM glycine at pH 2.0 removed both the antibody and uromodulin.
Characteristics of the ELISA for uromodulin
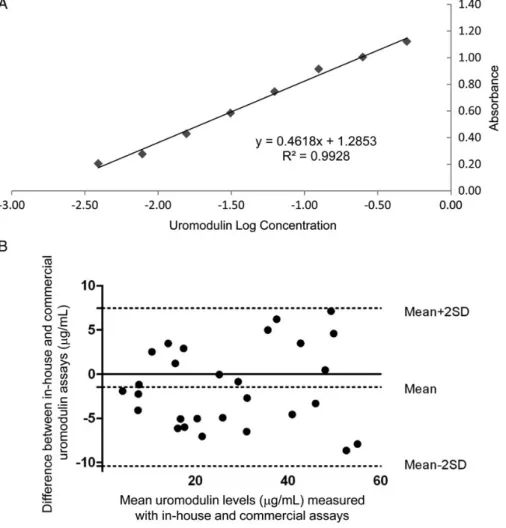
When tested against purified human uromodulin, the in-house ELISA for human uromodulin showed a sensitivity (minimum amount of analyte which can be accurately de-tected) of 2.8 ng/mL and a linearity (correlation between concentration and optical density) of 1.0 (Figure 3A). The inter- and intra-assay variabilities were determined at 3.28 and 5.46%, respectively. The assay had a detection range between 3.9 and 500 ng/mL. When compared with other assays, the in-house ELISA showed a wider range of measurement and lower intra- and inter-assay variability than commercially available routine kits (Table1). There was a robust correlation (r = 0.905, P < 0.001) when comparing the in-house ELISA with the MD Bioproduct kit. The Bland–Altman plot showed that the mean difference between both methods was−1.47 µg/mL (95% CI,−3.21 to 0.27 µg/mL) (Figure3B).
Influence of processing of urine samples
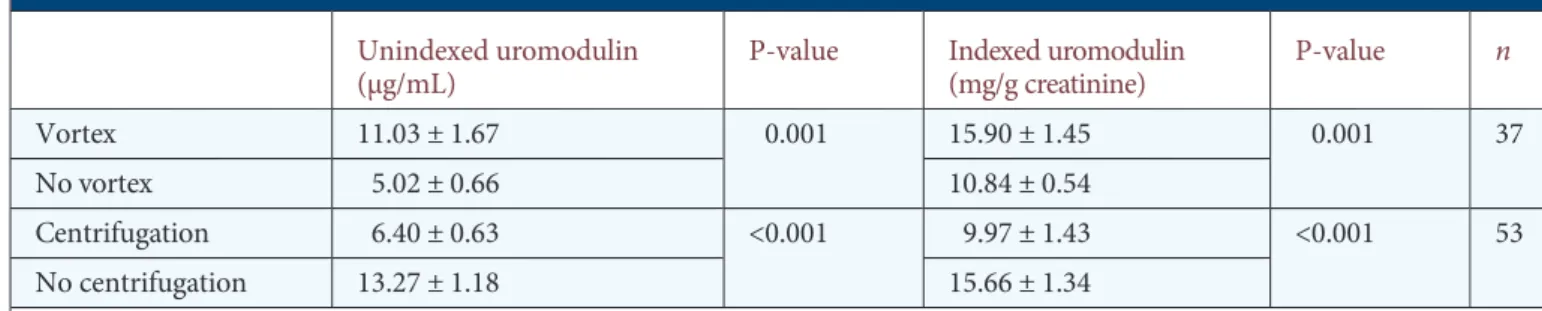
Since uromodulin has a tendency to aggregate, wefirst inves-tigated the potential influence of vortexing and centrifugation on the determination of uromodulin levels in human urine (Table 2). Comparison of fresh samples assayed before and after vortexing revealed a >50% increase in uromodulin levels (unindexed uromodulin: 5.02 ± 0.66 versus 11.03 ± 1.67 µg/mL, respectively, P = 0.001; indexed uromodulin: 10.84 ± 0.54 versus 15.90 ± 1.45 mg/g creatinine, respectively, P = 0.001, n = 37). Treating the urine samples with a usual centrifugation protocol (10 min, 3600 r.p.m.) also showed a significant decrease in un-indexed (6.40 ± 0.63 versus 13.27 ± 1.18 µg/mL, respectively, P < 0.001) and indexed (9.97 ± 1.43 versus 15.66 ± 1.34 mg/g
creatinine, respectively, P < 0.001, n = 53) uromodulin levels. Immunoblotting analyses (Figure4) revealed that centrifugation induced the precipitation of uromodulin in the pellet of cell debris. In comparison with the uromodulin band detected in fresh, non-centrifuged urine samples, the signal was strongly at-tenuated in the centrifuged urine sample while becoming apparent in the resulting pellet.
Alkalinization of fresh urine sample to pH 8.0 did not influence the determination of urinary uromodulin, when compared with untreated (mean pH 5.68 ± 0.19) samples (un-indexed uromodulin: 19.25 ± 4.14 versus 20.60 ± 5.24 µg/mL, respectively, P = 0.179; indexed uromodulin: 17.56 ± 2.28 versus 18.34 ± 2.67 mg/g creatinine, respectively, P = 0.260, n = 14). Likewise, acidification of urine samples to pH 2.0 did not result in a significant difference between values from un-treated (mean pH 6.15 ± 0.59) samples (unindexed uromodu-lin: 10.01 ± 2.25 versus 9.73 ± 2.07μg/mL, respectively, P = 0.621; indexed uromodulin: 18.86 ± 8.26 versus 19.10 ± 8.55 mg/g creatinine, respectively, P = 0.782, n = 8).
Influence of storage conditions
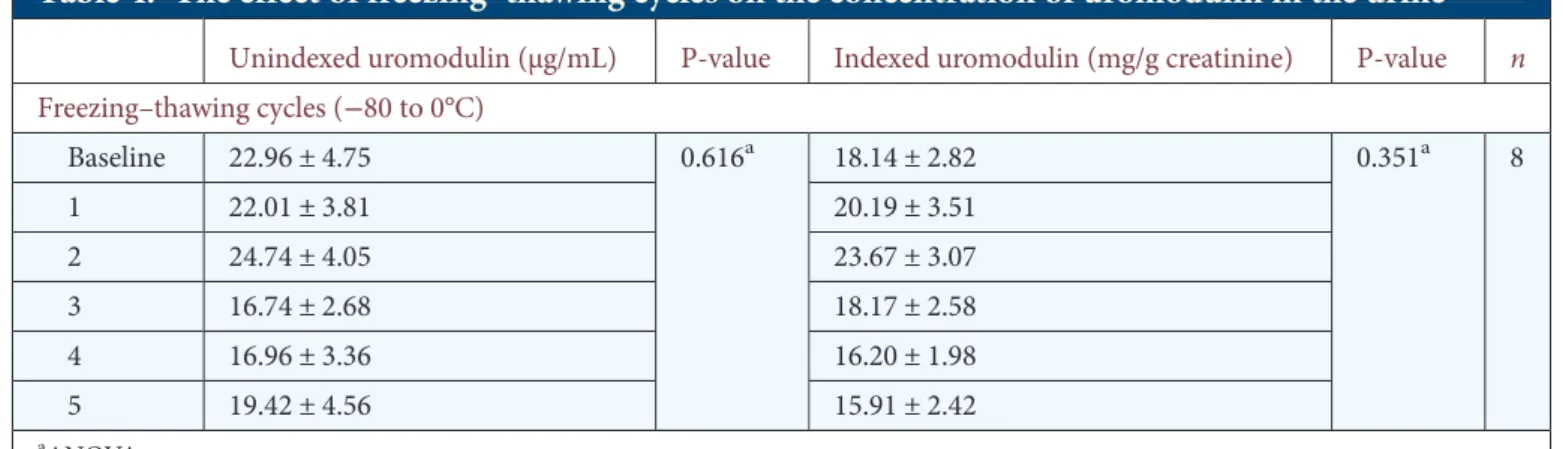
In order to cast light on the influence of storage conditions on the stability of uromodulin, we compared values obtained in samples analysed at baseline and after 1-week or 5-month storage at room temperature, +4°C and −20°C. When com-pared with baseline, storage at either room temperature or 4°C or even −20°C was associated with decreased levels of both unindexed and indexed uromodulin (Table 3). Addition of protease inhibitors at the time of collection had some effect on the degradation of the samples conserved at−20°C, but not on those kept at +4°C. In any case, the addition of protease inhibitors was insufficient to prevent a significant decrease in the uromodulin levels when compared with baseline values. In contrast, 4-month storage at−80°C was not associated with significant changes in uromodulin levels in untreated samples. Further analyses revealed a slight but significant de-crease after 8-month storage at−80°C (baseline uromodulin: 23.73 ± 1.57 µg/mL versus 8 months: 20.13 ± 1.17 µg/mL, P = 0.023, n = 142). Freezing–thawing cycles (from −80 to 0°C) showed no significant changes in the levels of urinary uromodulin when compared with baseline (Table4).
D I S C U S S I O N
Increasing evidence suggests that the level of uromodulin in urine could represent a useful biomarker for kidney function [3, 26]. In this study, we validated an efficient and
cost-effective immunoassay and characterized the conditions of
kidney sections (top row) using polyclonal sheep antibodies against human uromodulin (red), evidencing the apical staining in TAL profiles that are also positive for NKCC2 (green). A similar co-distribution between uromodulin (red) and NKCC2 (green) is observed in mouse kidney, using the polyclonal (middle row) or monoclonal (bottom row) anti-uromodulin antibodies. Scale bar: 10 µm, inset: 2× zoom. (C) Sensorgrams for the interaction of purified human uromodulin (19–156 nM) with the immobilized sheep anti-uromodulin antibody by surface plasmon res-onance technique using the Biacore system. Uromodulin was injected at 0 for 300 s. Red lines are the result of a globalfit. The constant of dis-sociation (KD) was determined after evaluating the asdis-sociation (kon) and disdis-sociation (koff) rate constants simultaneously using 1:1 kinetic binding model.
ORIGINAL
sampling and storage necessary to provide a faithful dosage of uromodulin in human urine. The urinary uromodulin levels were significantly affected by centrifugation and vortexing, as well as by the conditions and duration of storage.
To develop the in-house ELISA, we used commercially available anti-uromodulin antibodies and validated their specificity in human and mouse kidney and urine samples. Both antibodies evidenced the∼100 kDa band corresponding
to uromodulin on immunoblot, either in native or deglycosy-lated/desialylated state. They also showed the typical distri-bution along with NKCC2 in the apical membrane of the TAL. We used plasmon surface resonance to determine the binding constant for interaction of the immobilized sheep anti-uromodulin antibody to uromodulin to 10 nM which is in the expected range for an antibody-protein interaction. The immunoassay standard curve showed linearity over a broad
F I G U R E 3 :Characterization of the in-house ELISA for uromodulin. (A) Standard curve of absorbance for a dilution series (500, 250, 125, 68, 34, 17, 8.5 and 3.9 ng/mL) of purified human uromodulin. (B) Bland–Altman plot: difference between uromodulin levels measured with in-house ELISA and the commercial kit plotted against mean uromodulin levels measured with both methods (n = 28). Horizontal lines represent the mean difference for the whole group (−1.47 µg/mL) and the 95% limits of agreement (−10.40 – 7.45 µg/mL).
Table 1. Comparison of the characteristics of the in-house ELISA for uromodulin and the
commercially available ELISA kits
Kit Detection range (standard curve)
(ng/mL) Inter-assay variability (%) Intra-assay variability (%) In-house 3.9–500 3.28 5.46 MD Bioproduct (Cat. M036020) 2.34–150 11.63 8.36 BioVendor (Cat. RD191163200R) 0.5–32 6.4 2
USCN Life Science, Inc.
(Cat. E96918 Hu) 3.13–200
<12 <10
ORIGINAL
range of values, allowing the detection of uromodulin with high sensitivity and very low inter- and intra-assay variability. It must be noted that, in contrast with previous results based on immunoblotting [20], dilution of the samples with deionized water yielded similar results than with TEA buffer. All these features, combined with an excellent correlation with the most used commercial ELISA, substantiate the interest of our immunoassay with the advantage of low cost, wide range of detection and low variability.
Our analyses revealed a striking effect of vortexing and cen-trifugation on the determination of uromodulin in the urine. These two procedures yielded variations reaching 50% of the levels obtained on control, unprocessed samples (Table2). These findings are clinically relevant, because low levels of urinary uro-modulin have been suggested to be of diagnostic value in UAKD [3,9–11]. The effect of vortexing confirms the importance of the
aggregation of uromodulin molecules in the normal urine. Uro-modulin is also known to cofractionate with exosomes [27], the recovery of which is increased by vortexing [28]. Uto et al. [18] previously suggested that uromodulin may be trapped in cell debris or aggregated with crystals after centrifugation protocols that are usual to remove contamination due to lysis or suspended cells [29]. Our data confirm these findings and show that
cen-trifugation of urine may decrease the level of uromodulin by ∼30%. Thawed urine samples should thus be vortexed but not centrifuged before assaying uromodulin.
The stability of uromodulin during different storage proto-cols is critical for analysing large, multicentric cohorts.
Previous studies based on small sample size yielded inconsist-ent conclusions about the influence of storage duration and temperature [17–20]. Furthermore, these studies did not take into account normalization for urinary creatinine, which is usual for kidney biomarkers [29,30]. Our results, obtained on a large number of samples, reveal that short (1 week) and longer (5 months) storage at room temperature, 4 or−20°C causes a significant decrease in indexed urinary uromodulin levels, largely due to decreased uromodulin. In contrast, a 4-month storage at−80°C is associated with marginal, non-sig-nificant decrease in the unindexed and indexed values. Of note, the decrease in unindexed uromodulin levels becomes significant after an 8-month storage at −80°C. The fact that storage of untreated urine samples at room temperature, 4°C or−20°C significantly decreases the level of uromodulin sub-stantiates the observations of Kobayashi and Fukuoka [20]. This effect is only partially attenuated with protease inhibitors, which show some effect for samples kept at−20°C—but insuf-ficient to prevent a significant degradation. Taken together, these data confirm the fact that urine samples should be stored at −80°C and analysed within 3 months to give the most reliable measurements. Of note, up to five freezing–thawing cycles on ice did not affect the stability of uromodulin stored at−80°C.
Previous studies also reported inconsistent results in terms of treatments (detergents or TEA buffer, alkalinization) supposed to solubilize aggregates of uromodulin in urine [17–20, 31]. Some of these treatments may interfere with the binding of uromodulin to the ELISA capture antibody [18]. We verified
here that dilution with deionized water gave similar results than with TEA, and that urine alkalinization (or acidification) had no effect on the determination of uromodulin. These data support the conclusion that dilution of the sample with water before the assay, combined with vortexing, is an efficient way of disaggregation [31].
In summary, these data indicate that reliable uromodulin measurements can be obtained from untreated urine samples, provided they are immediately stored at −80°C and assayed within 3 months, with vortexing and dilution with water to prevent aggregation. This methodology will be useful for high-throughput analyses of uromodulin and its validation as a biomarker for renal function and risk of CKD.
Table 2. The effect of sample processing (vortex and centrifugation) on the concentration of
uromodulin in the urine
Unindexed uromodulin (µg/mL)
P-value Indexed uromodulin (mg/g creatinine) P-value n Vortex 11.03 ± 1.67 0.001 15.90 ± 1.45 0.001 37 No vortex 5.02 ± 0.66 10.84 ± 0.54 Centrifugation 6.40 ± 0.63 <0.001 9.97 ± 1.43 <0.001 53 No centrifugation 13.27 ± 1.18 15.66 ± 1.34
Urine samples were vortexed for 10 s. Centrifugation was performed for 10 min at 3600 r.p.m. at room temperature. Two different sets of samples were used to test the influence of vortexing (n = 37) and centrifugation (n = 53).
F I G U R E 4 .Effect of urine centrifugation on the detection of uro-modulin. Western blot analysis (10% acrylamide gel) of two human urine samples (S1 and S2) using the polyclonal sheep anti-uromodu-lin antibody: the signal obtained in baseanti-uromodu-line urine is lost when analys-ing the supernatant followanalys-ing centrifugation, whereas a clear signal appears in the pellet. Similar volumes (2 µL) of untreated urine, supernatant and resuspended pellet were loaded.
ORIGINAL
AC K N OW L E D G E M E N T S
These studies were supported in part by an Action de Recherche Concertée (ARC, Communauté Française de Belgique); the FNRS and FRSM; the Inter-University Attrac-tion Pole (IUAP, Belgium Federal Government); the NCCR Kidney. CH program (Swiss National Science Foundation); the European Community’s Seventh Framework Programme
(FP7/2007-2013) under grant agreement no 246539 (Marie Curie) and grant no 305608 (EURenOmics) and the Gebert Rüf Stiftung (Project GRS-038/12). The expert assistance of N. Amraoui, H. Debaix, S. Druart, Z. Guo and S. Terryn is appreciated. We thank Dr L. Rampoldi for providing the kidney extract obtained from the Umod KO mouse developed by Professor X.-R. Wu [21], and Dr S. Schauer for helpful discussions about the Biacore experiments.
Table 3. The effect of storage conditions (duration, temperature and protease inhibitors) on the
concentration of uromodulin in the urine
Unindexed uromodulin (µg/mL) P-value Indexed uromodulin (mg/g creatinine) P-value n 1-week storage Baseline 12.39 ± 2.41 0.078a 22.70 ± 3.35 0.014a 13 RT 6.14 ± 1.34* 13.00 ± 2.34* +4°C 7.22 ± 1.60* 11.49 ± 1.50* −20°C 9.98 ± 1.96* 18.69 ± 3.18* 4-month storage Baseline 36.37 ± 2.62 0.354 24.05 ± 1.26 0.412 61 −80°C 35.47 ± 2.32 23.30 ± 1.25 5-month storage Baseline 28.50 ± 6.76 26.48 ± 3.45 10 +4°C 10.17 ± 3.96* 0.068a 10.27 ± 2.35* 0.001a −20°C 16.52 ± 5.08* 15.78 ± 2.73* +4°C and PI 11.04 ± 4.69* 0.111a 10.80 ± 2.32* 0.003a −20°C and PI 20.23 ± 5.27*,** 18.71 ± 2.69*,**
PI, treatment with protease inhibitors (Leupeptin and sodium azide). Three different sets of urine samples were used to assess influence of storage after 1 week (n = 13), 4 months (n = 61) and 5 months (n = 10) versus baseline levels.
aANOVA.
*P < 0.05 storage condition versus baseline.
**P < 0.05 no versus protease inhibitors, paired t tests.
Table 4. The effect of freezing–thawing cycles on the concentration of uromodulin in the urine
Unindexed uromodulin (µg/mL) P-value Indexed uromodulin (mg/g creatinine) P-value n Freezing–thawing cycles (−80 to 0°C) Baseline 22.96 ± 4.75 0.616a 18.14 ± 2.82 0.351a 8 1 22.01 ± 3.81 20.19 ± 3.51 2 24.74 ± 4.05 23.67 ± 3.07 3 16.74 ± 2.68 18.17 ± 2.58 4 16.96 ± 3.36 16.20 ± 1.98 5 19.42 ± 4.56 15.91 ± 2.42 aANOVA. ORIGINAL ARTICLE
CON F L I C T O F I N T E R E S T S TATE M E N T
None declared.
R E F E R E N C E S
1. Koyner JL, Vaidya VS, Bennett MR et al. Urinary biomarkers in the clinical prognosis and early detection of acute kidney injury. Clin J Am Soc Nephrol 2010; 5: 2154–2165
2. Tamm I, Hosfall FL. Characterization and separation of an inhibitor of viral haemagglutination present in urine. Proc Soc Exp Biol Med 1950; 74: 108–114
3. Rampoldi L, Scolari F, Amoroso A et al. The rediscovery of uromodulin (Tamm–Horsfall protein): from tubulointerstitial nephropathy to chronic kidney disease. Kidney Int 2011; 80: 338–347
4. Chabardès-Garonne D, Mejéan A, Aude JC et al. A panoramic view of gene expression in the human kidney. Proc Natl Acad Sci USA 2003; 100: 13710–13715
5. Wiggins RC. Uromucoid (Tamm–Horsfall glycoprotein) forms different polymeric arrangements on afilter surface under different physicochemical conditions. Clin Chim Acta 1987; 162: 329–340 6. Serafini-Cessi F, Malagolini N, Cavallone D. Tamm–Horsfall
glycoprotein: biology and clinical relevance. Am J Kidney Dis 2003; 42: 658–676
7. Renigunta A, Renigunta V, Saritas T et al. Tamm–Horsfall glycoprotein interacts with renal outer medullary potassium channel ROMK2 and regulates its function. J Biol Chem 2011; 286: 2224–2235
8. Mutig K, Kahl T, Saritas T et al. Activation of the bumetanide-sensitive Na+,K+,2Cl− cotransporter (NKCC2) is facilitated by Tamm–Horsfall protein in a chloride-sensitive manner. J Biol Chem 2011; 286: 30200–30210
9. Bollée G, Dahan K, Flamant M et al. Phenotype and outcome in hereditary tubulointerstitial nephritis secondary to UMOD mutations. Clin J Am Soc Nephrol 2011; 6: 2429–2438
10. Dahan K, Devuyst O, Smaers M et al. A cluster of mutations in the UMOD gene causes familial juvenile hyperuricemic nephropathy with abnormal expression of uromodulin. J Am Soc Nephrol 2003; 14: 2883–2893
11. Bleyer AJ, Hart TC, Shihabi Z et al. Mutations in the uromodulin gene decrease urinary excretion of Tamm–Horsfall protein. Kidney Int 2004; 66: 974–977
12. Bernascone I, Janas S, Ikehata M et al. A transgenic mouse model for uromodulin-associated kidney diseases shows specific tubulo-interstitial damage, urinary concentrating defect and renal failure. Hum Mol Genet 2010; 19: 2998–3010
13. Padmanabhan S, Melander O, Johnson T et al. Genome-wide association study of blood pressure extremes identifies variant near UMOD associated with hypertension. PLoS Genet 2010; 6: e1001177
14. Köttgen A, Glazer NL, Dehghan A et al. Multiple loci associated with indices of renal function and chronic kidney disease. Nat Genet 2009; 41: 712–717
15. Chambers JC, Zhang W, Lord GM et al. Genetic loci influencing kidney function and chronic kidney disease. Nat Genet 2010; 42: 373–375
16. Brunisholz M, Geniteau-Legendre M, Ronco PM et al. Character-ization of monoclonal antibodies specific for human Tamm– Horsfall protein. Kidney Int 1986; 29: 971–976
17. Akesson I, Haugen H, Enger E. Quantification of uromucoid: a simplified method. Scand J Clin Lab Invest 1978; 38: 93–95 18. Uto I, Ishimatsu T, Hirayama H et al. Determination of urinary
Tamm–Horsfall protein by ELISA using a maleimide method for enzyme-antibody conjugation. J Immunol Methods 1991; 138: 87–94
19. Torffvit O, Agardh CD, Kjellsson B et al. Tubular secretion of Tamm–Horsfall protein in type I (insulin-dependent) diabetes mellitus using a simplified enzyme linked immunoassay. Clin Chim Acta 1992; 205: 31–41
20. Kobayashi K, Fukuoka S. Conditions for solubilization of Tamm–Horsfall protein/uromodulin in human urine and establishment of a sensitive and accurate enzyme-linked immunosorbent assay (ELISA) method. Arch Biochem Biophys 2001; 388: 113–120
21. Thomas CE, Sexton W, Benson K et al. Urine collection and processing for protein biomarker discovery and quantification. Cancer Epidemiol Biomarkers Prev 2010; 19: 953–959
22. Reznichenko A, van Dijk MC, van der Heide JH et al. Uromodulin in renal transplant recipients: elevated urinary levels and bimodal association with graft failure. Am J Nephrol 2011; 34: 445–451 23. Mo L, Zhu XH, Huang HY et al. Ablation of the Tamm–Horsfall
protein gene increases susceptibility of mice to bladder colonization by type 1-fimbriated Escherichia coli. Am. J Physiol Renal Physiol 2004; 286: 795–802
24. Parsons CL, Rajasekaran M, Arsanjani AH et al. Role of sialic acid in urinary cytoprotective activity of Tamm–Horsfall protein. Urology 2007; 69: 577–581
25. van der Merwe PA. Surface plasmon resonance in protein-ligand interactions: hydrodynamics and calorimetry. In: Harding S, Chowdhry PZ (eds). Practical Approach Series. Oxford Univer-sity Press, Oxford, 2001, pp.137–170
26. Köttgen A, Hwang SJ, Larson MG et al. Uromodulin levels associate with a common UMOD variant and risk for incident CKD. J Am Soc Nephrol 2010; 21: 337–344
27. Hiemstra TF, Charles PD, Hester SS et al. Uromodulin exclusion list improves urinary exosomal protein identification. J Biomol Tech 2011; 22: 136–145
28. Zhou H, Yuen PS, Pisitkun T et al. Collection, storage, preser-vation, and normalization of human urinary exosomes for bio-marker discovery. Kidney Int 2006; 69: 1471–1476
29. Waikar SS, Sabbisetti VS, Bonventre JV. Normalization of urinary biomarkers to creatinine during changes in glomerular filtration rate. Kidney Int 2010; 78: 486–494
30. Ortiz A, Sanchez-Nino MD, Sanz AB. The meaning of urinary creatinine concentration. Kidney Int 2011; 79: 791
31. Dawney AB, Thornley C, Cattell WR. An improved radio-immunoassay for urinary Tamm–Horsfall glycoprotein. Biochem J 1982; 206: 461–465
Received for publication: 23.2.2013; Accepted in revised form: 4.7.2013
ORIGINAL