Ion production by lasers using high-power
densities in a near infrared region
By K. R O H L E N A , * B. KRALIKOVA,* J. KRASA,*
L. LASKA,* K. MASEK,* M. PFEIFER,* J. SKALA,*
P. PARYS,t J. WOLOWSKI.t E. WORYNA.f
J. F A R N Y ,
1W. M R 6 Z , § I. ROUDSKOYJI
O. SHAMAEV, II B. SHARKOV,II A . SHUMSHUROV, II
B . A . BRYUNETKIN,1 H. H A S E R O T H , # J. COLLIER,#
A. KUTTENBEGER,# K. LANGBEIN,#
AND H. KUGLER#
•Institute of Physics, Academy of Science, Czech Republic, Prague, Czech Republic tlnstitute of Plasma Physics and Laser Microfusion, Warsaw, Poland §Institute of Optoelectronics, Military University of Technology, Warsaw, Poland
IIInstitute of Theoretical and Experimental Physics, Moscow, Russia 1M1SDC, State Research Center of Russia, NPO VNIIFTRI, 141570,
Mendeleevo, Moscow Region, Russia #PS-Division, CERN, Geneva, Switzerland (Received 2 April 1996; accepted 17 April 1996)
Results are presented of experiments on ion production from Ta targets using a short pulse (350-600 ps in focus) illumination with focal power densities exceeding 1014 Wcm~2 at the wavelength of an iodine photodissociation laser (1.315 nm) and its harmonics. Strong evidence of the existence of tantalum ions with the charge state +45 near the target sur-face was obtained by X-ray spectroscopy methods. The particle diagnostics point to the existence of frozen high charge states (<53+) of Ta ions in the far expansion zone at about 2 m from the target. The measured charge state-ion energy distribution indicates the high-est energy (>4 MeV) for the highhigh-est observed charge states. A tentative theoretical expla-nation of the observed anomalous charge state freezing phenomenon in the expanding
plasma produced by a subnanosecond laser pulse is given.
1. Introduction
The ion diagnostics of expanding plasma corona is no longer the prime task of large laser-plasma experiments aimed at creating conditions in the compressed target approaching those of energetic breakeven or of a thermonuclear ignition in direct-drive configurations. More relevant is information carried from the compressed target core either by X-ray or some kind of particles, mostly neutrons. Nonetheless, the ions produced by the expanding corona of a plane target using a single beam illumination found other applications rather than being just a diagnostic tool of plasma periphery. At a far distance from the target, the ion cur-rent at the aperture of a suitable element of electrostatic optics can reach milliamps in micro-second pulses. This is the property that places the ion sources based on expanding laser plasma far ahead of other types of conventional sources, which usually are based on some type of discharge. The ion accelerator projects, which rely on a high yield of the source, by their very existence thus have a tendency to fall back to the laser source for the ion injec-tion. A survey of the fundamental aspects of ion emission physics as well as hints about
'Permanent address: 95445 Bayreuth, Meranierring 28/7, Germany. © 1996 Cambridge University Press 0263-0346/96 $11.00 + .10
nonfusion applications of the phenomenon are to be found in Hora et al. (1992); see also further references therein. Practical reasons, like an easy commercial availability, high rep-etition rate, and robust construction, dictated the use of the CO2 laser as the first choice
for a driver. A complementary region of high-power densities and shorter wavelengths, although perhaps at present less practical than that dominated by the CO2 lasers, thus is
worth exploring from the purely physical point of view.
2. Experimental
For switching to the near infrared and visible heating beam, an iodine photodissociation laser was considered to be a suitable tool. The iodine laser facility Perun (Chvojka et al. 1992) at the Institute of Physics in Prague (pulses of 40 J, 350-600 ps in focus, single beam diameter 85 mm, divergence 4 x 10~4 rad, yielding the focal spot 100 pm with aspherical / = 20 cm optics, power density on the target ~1015 W/cm2; frequency conversion to the second and third harmonics with 50% efficiency, possibility of illumination by a double pulse with the prepulse of different color) thus was used as a driver. Tantalum as a model material for high-Z targets minimizes the damage to the focusing optics and renders the ion analysis easier by the predominance of just a single isotope.
The principal diagnostic techniques for studying the Ta laser-produced plasma were based on the time-of-flight method (TOF). Both a cylindrical electrostatic ion energy analyzer (IEA) and an ion collector (IC) were used (Denus et al. 1977); see figure 1. They were posi-tioned at 40° with respect to the incident beam. The IEA had a mean radius of R = 10 cm, the gap between the electrodes of the analyzing system was AR = 1 cm, and the deflection angle \J/ = ir/2. The widths of the input and output slits were 150 mm and 1000 mm, respec-tively. The solid angle of the registration was about 5.8 x 10~7 sr. This diagnostics was used for the determination of plasma composition (charge state distribution) as well as of the total number of ion species at a far distance from the target. A windowless electron
-HV TOP VIEW osc. I E A III EMI 9643/2B -U/2 +U/2 IEA osc. IC
FIGURE 1. Scheme of the experiment: IEA —ion electrostatic analyzer (Thomson spectrograph), IC —ion collector.
multiplier of 9643/2B type from EMI (fitted with CuBe dynodes with an overall gain of about 2 x 10⁷ at 4-kV voltage) was used as a detector after the IEA. The paths of flight of the IEA and the IC were 207.4 cm and 94 cm, respectively. The IC parameters were the following: collector diameter, 1.5 cm; bias voltage, -100 V; grid transparency, 0.58. To minimize the charge exchange effect, both the IEA and the target chamber were evacuated to 6 x 10~7 Torr and 3 x 10~3 Torr, respectively. To register the spectra of light impuri-ties, a Thomson analyzer was used. It consists of three main sections (Wolowski et al. 1982): the aperture system, which forms an ion beam (diameter of the forming diaphragm was about 100 /xm); an analyzing section with parallel magnetic and electric fields; and a 2D converter, in which ions are registered on either an ion-sensitive foil (solid-state nuclear track detector—SSNTD) or a microchannel plate, where the ions are converted to light and re-corded by a CCD camera.
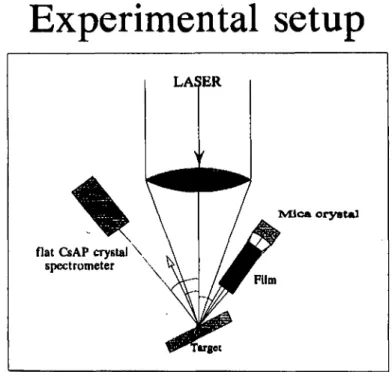
In addition, for an investigation of the hot plasma near the target two kinds of Bragg-crystal X-ray spectrographs were used: The first was based on the flat CsAP Bragg-crystal (2d = 26.1 A) and was used to obtain overview spectra. The second was a high-luminosity and high-resolution spectrograph with spherically bent mica crystal (Bryunetkin et al. 1995). This device was used for detailed investigations of X-ray spectra with resolution X/5X up to 104. The X-ray spectroscopy setup is shown in figure 2.
3. Results
The aim of our experiments was to test the optimum conditions for obtaining a maxi-mum current of highly charged Ta ions as well as to measure their energy distribution; we varied the focus position versus the target surface and the target tilt angle with respect to the laser beam at a fixed laser pulse energy. In our experimental arrangement and for laser
Experimental setup
LASER
Mica orystal
flat CsAP crystal \ spectrometer
Film
argot
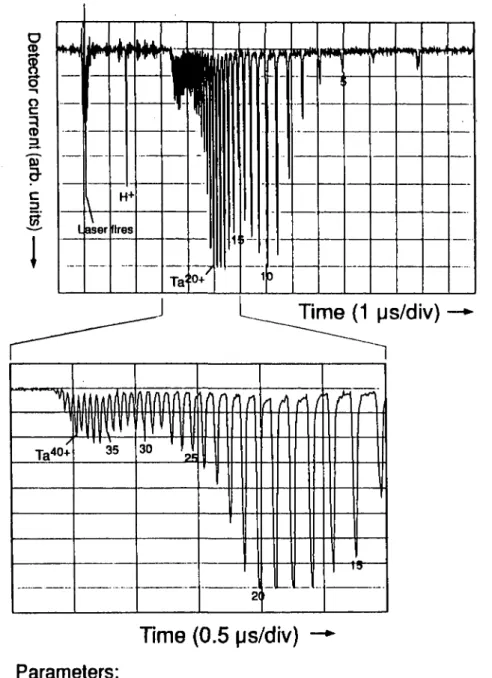
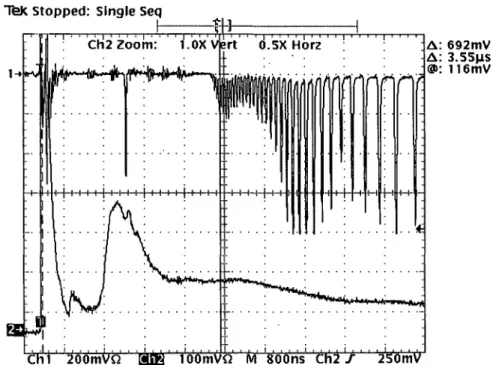
energy up to 32 J, the optimum conditions were as follows: the focus position was 125-250 /xm in front of the target, and the tilt angle of the target was about 30° (the angle between the target normal and the IEA was 10°). As an example, we show the Ta ion spec-trum (figure 3) obtained with the IEA for the ion energy-to-charge state ratio E/z = 8 keV in two different time scales and the ion collector signal obtained in the same laser shot (fig-ure 4—trace 2). In general, the struct(fig-ure of the collector signal points to the existence of
CD
o —
I
s
c
2.
us
Time (1 ps/div)
.
ill™
Ta
4°
+ u '351
|i' Illl
» 'U
I]
f 1 ftf\ (
1
1
V
i
Time (0.5 ps/div)
-*-Parameters:
Laser energy: 13.8 J, Pulse length: ~ 300 ps half width, Laser Power: - 2 0 QW, Spot size on target: -100 pm, Power density: ~2x10¹⁴ W/cm2, data set 27089308
Tfek stopped: Single Seq Ch2Zoom: 1.0X 0.5X Horz : A A n ft f\f\ r*\ f\ (f\ 'f*\ ?-A: 692mV A: 3.55jiS <$>: 116mV
'ioomvci wfoi loomVfl M 'g'o'o'ris' Ch2'j '25'0'mv
FIGURE 4. Top: Time-of-flight spectrum of Ta ions recorded with the electrostatic analyzer. Bottom: Corresponding ion collector signal.
two ion groups (Laska et al. 1994). The faster one, if analyzed by the IEA, is found to be composed of the high charge states of Ta ions and of light contamination ions (H, C, and O). The ion collector signal with the record of TOF ion spectra presented in figure 4 opens the possibility of calculating the total number of highly charged ions with z = 35-44 in the fast group arriving between 1.0 and 2.4 /xs after the laser pulse. The mean current density
for this group of ions is about 6.4 mA/cm2 at a distance of 94 cm from the target. With
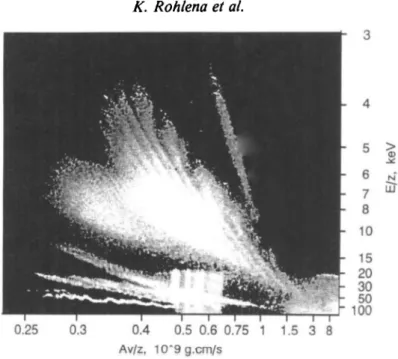
an ion pulse duration of about 1.4 jts, the number of particles arriving at the collector aper-ture of 1.5 cm is TV,- ~ 1.4 x 10⁹. Taking into account the partial representation of ions with fixed charge states in this fast group, one can conclude that the number of ions with charge state 40+ will be ~108 cm"2 per pulse at the collector distance. The peak current density was about 12.8 mA/cm2. The latest experiments confirmed the presence of ions with charge states up to 53+ (Woryna et al. 1994). These highest charge states also were produced using the second or third harmonics of the fundamental iodine laser frequency. The parabolas presented in figure 5 were obtained from Ta plasma created by a fundamen-tal laser frequency pulse with energy E = 25.1 J and a pulse length of about 580 ps. It is seen that the maximum energy-to-charge state ratio of registered ions is about E/z = 100 keV (horizontal straight lines have the same value of the E/z ratio). This value corresponds to the maximal energy of Ta, which is equal to about 4.5 MeV. Our rough estimate of the max-imum ionization state of Ta ions gave the value higher than z = 45. These values are con-sistent with the results of measurements made by the IEA, from which the maximum energy of Ta45+ was about 4 MeV and the maximum ionization states were at least z = 50.
In the process of laser radiation interaction with targets, the electron density, electron temperature, and the interaction times are the parameters that control the ionization state of the plasma. This process is very complicated, but a simple estimate of plasma
param-0.25 0.3 0.4 0.5 0.6 0.75 1 1.5 3 8 Av/z, io*9g.cm/s
FIGURE 5. Thomson parabola traces corresponding to Ta ions of increasing charge number as well as to impurities from the Thomson mass spectrograph recorded with a microchannel plate.
eters will be attempted. Using the relation Zo —f(Te) determined from the mixed model
given by Busquet (1982) and the relation E = 4(|0 + 1)7; from Farny (1985) (where Te and
f0 are the electron temperature and the average charge state of ions in the focal spot,
respectively, and £ is the average ion energy at a large distance from the target), the elec-tron temperature Te — 1.7 keV and the average state z0 ~ 50 were estimated.
An alternative way of checking these figures is to use the formula for the electron tem-perature Te dependence on the laser power P, average charge state z\>, and focal spot
diam-eter D, based on the energy balance of the absorbed laser energy and the electron conductivity flux from the heated plasma zone (Roudskoy 1993):
Te = 100(Pz0/D)2/7 [eV],
combined with a coronal equilibrium for Z:
where lz is the ionization potential of a z-times stripped ion and m is the number of
equivalent electrons of the outer shell. In this case, an electron temperature of about Te == 1.6 keV is obtained with an average charge state z0 = 46 for our experimental
condi-tions, which are in satisfactory agreement with the previous estimates.
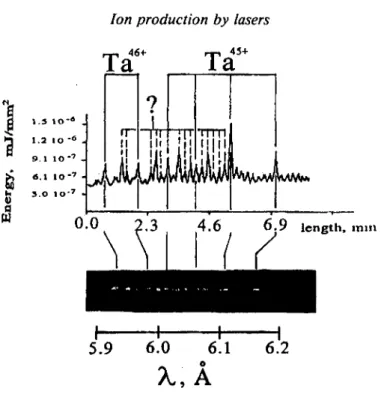
Measurements of the X-ray emission spectra of plasma in the 4-8-A range were performed to obtain independent experimental evidence of high charge state presence in the plasma corona during the heating stage, and to compare the spectroscopically identified charge state data with those obtained with the TOF technique. Moreover, the analysis of X-ray line spec-tra of the plasma opens the possibility of measuring the macroscopic parameters of plasma such as temperature and density.
Spectra of Ta plasmas were obtained by both of the spectrographs mentioned in the previous section and recorded on a film. An overview X-ray spectrum of Ta plasma in the spectral region 4.5-7.5 A is shown in figure 6, and its detailed interpretation is presented
46+ 45+
6.9 length, iniii
I 1 1 1
5.9 6.0 6.1 6.2
A.,
A
FIGURE 6. Overview of Ta ion spectrum and its interpretation.
in table 1. The lines in the Ta spectra were identified using recent experimental and theo-retical data as well as new, specifically provided calculations (Bryunetkin et al. 1995). The results obtained lead to the following conclusions: (1) the spectral lines of the high charge state heavy ions, i.e., Ta45+ and Ta46+, certainly can be observed; and (2) the
collisional-TABLE 2. Spectral lines of ionized Ta
Identification al a2 a3 o9 o4 aS o6 alO a l l al2 a\3 b\ b2 b3 b4 Wavelength (nm) 0.74482 0.73013 0.70508 0.63676 0.61674 0.60864 0.59021 0.55664 0.54400 0.53855 0.48354 0.5790 0.5780 0.5780 0.5764 0.5764 0.5764 0.5751 7a46+ Transition 3d'0 'So — 3d94p(3/2, 1/2), 3d SQ — 3d 4p(5/2, 3/2)i 3d10 'So - 3d94p(3/2, 3/2), 3d'°'So-3p53c/l o4s(3/2, 1/2), 3 d ' ° ' S0- 3 d94 / ( 5 / 2 , 5/2), 3d10 'So — 3d94f(5/2, 7/2), 3 d1 0' So- 3 ^ 4 / ( 3 / 2 , 5/2), 3d'0 'So — 3p53rf104s(l/2, 1/2), 3d10 'So - 3p53d104d(3/2, 3/2), 3d10 'So - 3p53d'°4d(3/2, 5/2), 3rf10 'So - 3/»s3rfI04rf(l/2. 3 / 2 ) , 3d92D5/2 - 3d*4f[(3/2, 5/2)2, 5/2]J / 2 3d92D5/2 - 3dHf [(3/2, 5/2)4, 7/2]5 / 2 3d92Di/2 - 3ds4f[(3/2, 3/2)2, 5/2]3 / 2 3d92D5/2 - 3ds4f 1(3/2, 5/2)4, 5/2]3 / 2 3d92Di/2 - 3d*4f[(3/2, 5/2)4, 5/2] 5 / 2 3d92D3/2 - 3ds4f [(3/2, 5/2)2, 5/2]7 / 2 3d92Di/2 - 3ds4f 1(3/2, 3/2)0, 5/2]5 / 2
radiative kinetic calculations taking into account level-to-level transitions showed that the best fit to the experimental data can be obtained at the electron density ne = 4 x 1020 cm"3,
which is close to the critical plasma density for X = 1.3 jtm, and at an electron temperature not greater than 0.8 keV. The discrepancy with the simple estimate of plasma tempera-ture made above is likely caused by the fact that the plasma temperatempera-ture is not constant during the interaction and increases with time as the power density of the laser pulse rises.
4. Interpretation of results
The charge of escaping ions is determined by the ionization processes near the target surface during the plasma heating and a subsequent three body recombination with the rate proportional to:
~73n T~9/2
during the expansion. In parallel with the experimental work, a series of computational modelings of laser-plasma interactions were performed within the frame of a single-liquid two-temperature hydrodynamics combined with ionization and recombination kinetics, taking into account only the inverse Bremstrahlung absorption. The simulations showed that the plasma temperature increased during the plasma heating, reaching its maximum Te = 1.6 keV at the pulse center duration (700 ps after the start of the pulse, the duration
of which was T = 700 ns FMHW). The average charge state of Ta ions at this moment was about +45. But during the following plasma expansion, the ion charge state dropped dramatically down to +8 in a distance of 1.1 m from the target. The maximum ion kinetic energy was 0.4 MeV in the calculations. These results do not agree with the experiment, where ions with z = 45 and kinetic energy up to 4 MeV were observed.
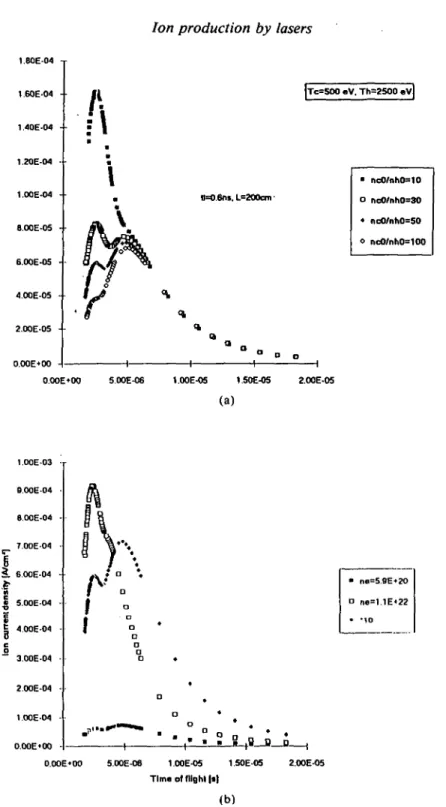
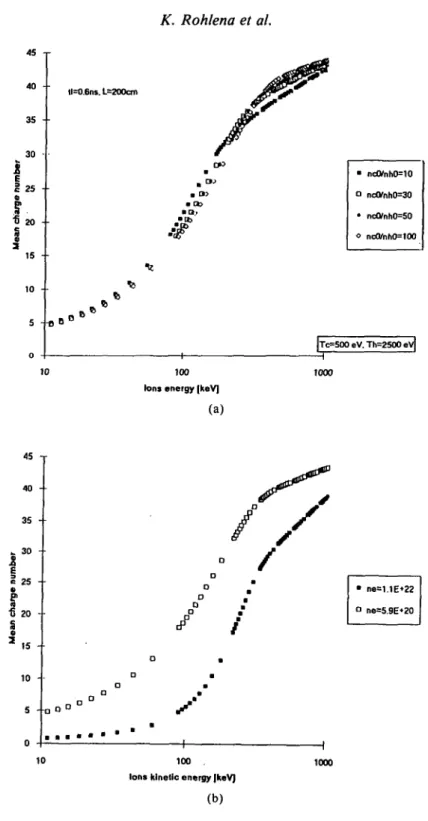
A possible way of explaining the occurrence of the high charge state in the far expan-sion zone is offered by the existence of a fast ion group in the collector signals, which invariably contains the high charge states, especially if the plasma heating occurs on the first harmonics. The presence of the fast group means that the plasma time evolution fol-lows the mechanism of two-temperature isothermal expansions (Wofol-lowski et al. 1995). Pri-marily, a hot electron group is formed near the critical surface with the temperature about ten times higher than that of the thermal group by a collisionless absorption of the laser light. During the expansion phase, first the hot electrons leave the plasma, pulling the ions behind. The thermal electrons follow, guiding the slower thermal ion group. The existence of the fast electrons is thus beneficial, since they open the way for the high charge states to leave the plasma. To support this notion a series of model calculations was performed assuming that the energy deposition process renders a two-temperature electron energy dis-tribution, which, in turn, leads to a two-temperature exponential density profile. This sit-uation can, under simplifying assumptions, be treated analytically to obtain a self-similar solution (Wickens & Allen 1979; Farny 1985). Starting from this solution, the plasma expan-sion can be followed through, applying at the same time a simple ion balancing scheme using the "trip" code, which considers the rate equations for three adjacent ion species at a time, whose migration over the entire ion spectrum is controlled by the temperature. The recom-bination heating is also included. The theory involves as free parameters the temperature of the thermal and the hot electrons, and the ratio between the hot and thermal electron population densities. Simulated collector signals calculated on the basis of this simplified model with the parameter choice indicated are seen in figure 7. The two mentioned elec-tron groups are clearly visible. The charge distribution at 2 m from the target is seen in figure 8. It is seen that the existence of the fast electron group guarantees the occurrence of the high charge states in the far expansion zone to be recorded by the collector.
1.80E-04 1.60E-04 1.00E-04 • 8.O0E0S 6.00EO5 4.00EO5 2.00E05 O.OOE'OO
-A
• | T C = S O O «V. T h = 2 5 O 0 « v | 1)=0.6ru. L=200cm • ncO/nhO=1O o ncO/nhO=30 • nc0/nh0=50 0 ncO/nhO=1OO0.00E»00 5 0OE-O6 1.00E-05 1.50E-05 (a) 2.00E-05 1.00E03 9 00E 04 7.OOEO4 S. 6 00E04 | S.OOE04 -| 4.00E-04 3.0OE04 2.00E-M 1.00E-M O.OOE'OO a ne=1.1E<22 2.00E-05 O.OOE'OO 5.00E-06 VOOE-OS 1.S0E-05
Time ol flight |a)
(b)
FIGURE 7. (a) Ion collector signal calculated from the two-temperature model for the following param-eters: thermal electron temperature, Tc = 500 eV; hot electron temperature, Th = 2500 eV for four
different ratios of the thermal and hot electron populations nc0/nh0 = 10, 30, 50, and 100,
respec-tively, ne = 5.9 x 1020 cm"3. Laser pulse, 600 ps; collector distance from the target, 200 cm. (b) Ion
collector signal calculated from the two-temperature model for the following parameters: thermal electron temperature, Tc = 500 eV; hot electron temperature, Th = 2500 eV for the ratio of the
ther-mal and hot electron populations nc0/nh0 = 50 and two different values of the total (ne = nc0 + nh0)
electron population ne = 5.9x 10²Ocm"3,1.1 x 1022cm~3. Laser pulse, 600 ps; collector distance from
AS -r 40 3 S • • 30 1 25 - •
I...
1 5 • • ll=0.6ns. L=200cm • nc0/nh0=10 • ndVnh0=30 • ncO/nhO=5O « no0/nh0=100 10 |Tc=500 eV. Th=2S00 eV| 100 Ions energy |keV](a) 1000 40 35 30 25 i 20 15 10 -5 • ne=1.1E»22 ° ne=5.9E«20 H-10 H-100 . H-1000 Ions klnellc energy |keV]
(b)
FIGURE 8. (a) Average charge state of ions versus ion energy for four different ratios of the thermal and hot electron populations nc0/nh0 = 10, 30, 50, and 100, respectively, ne = 5.9 X 1020 cm"3.
Ther-mal electron temperature, Tc = 500 eV; hot electron temperature, Th = 2500 eV. Laser wavelength,
1.3 nm; pulse length, 600 ps; collector distance, 200 cm; initial average charge state, zo,m = 45. (b)
Average charge state versus ion energy for the ratio of the thermal and hot electron populations
nco/nho = 50. Thermal electron temperature, Tc = 500 eV; hot electron temperature, Th = 2500 eV;
values of the total (ne = nc0 + nh0) electron population, ne = 5.9 x 1020 cm"3, 1.1 x 1022 cm"3.
Laser wavelength, 1.3 /urn; pulse length, 600 ps; collector distance, 200 cm; initial average charge state,
5. Conclusions
Plasma generated by subnanosecond pulses on a Ta target by near infrared laser emits during its expansion highly ionized (z > 45) Ta ions that can be recorded at large distances from the source. These ions are generally part of a fast ion group arriving at the collec-tors. Consequently, such plasmas can serve as a potential source of ions, e.g., for acceler-ator injection or an ion implantation. The advantage of using a short intense pulse consists in its ability to heat up the plasma to the keV temperatures and at the same time provide enough hot electrons to guide the ions out of the plasma, preventing at the same time the recombination from destroying them. This notion is supported by the results of simple hydrodynamic modeling of expansion of two electron temperature plasmas.
REFERENCES
BRYUNETKIN, V.A. et al. 1995 Kv. Elektronika 24, 205.
BUSQUET, M. 1982 Phys. Rev. A25, 2302.
CHVOJKA, M. et al. 1992 Czech. J. Phys. 42, 899. DENUS, S. et al. 1977 J. Techn. Phys. 18, 15.
FARNY, J. 1985 Ph.D. Thesis, Military Academy of Technology, Warsaw. HORA, H. et al. 1992 Czech. J. Phys. 4,1, 927.
LASKA, L. et al. 1994 Appl. Phys. Lett. 65, 691.
LATYSHEV, S.V. & ROUDSKOY, I. 1985 Fizika Plazmy 11, 1175.
ROUDSKOY, I. 1993 Ph.D. Thesis, ITEP, Moscow.
SOBELMAN, I.I. 1963 Vvedenie v teoriyu atomnykh spektrov (Fizmatgiz, Moscow).
WICKENS, L.M. & ALLEN, J.E. 1979 / . Plasma Phys. 22, 167.
WOLOWSKI, J. et al. 1982 Zh. Techn. Phys. 52, 366.
WotowsKi, J. et al. 1995 In 12th International Conference on Laser Interaction and Related
Phe-nomena, Osaka.
WORYNA, E. et al. 1994 Laser Interaction with Matter, Institute of Physics Conf. 140, S. J. Rose, ed. (Institute of Physics Publishing, Bristol) pp. 293-296.
ZELDOVICH, Y A . B . & REIZER, Y U . P . 1963 Fizika udarnykh voln i vysokotemperaturnykh