The Psychogeriatric Assessment Scales: a
multi-dimensional alternative to categorical diagnoses of
dementia and depression in the elderly
A. F. JORM1, A. J. MACKINNON, A. S. HENDERSON, R. SCOTT, H. CHRISTENSEN,
A. E. KORTEN, J. S. CULLEN AND R. MULLIGAN
From the NH&.MRC Social Psychiatry Research Unit, The Australian National University, Canberra and the Department of Geriatric Medicine, Repatriation General Hospital Concord, Sydney, Australia; and
Institutions Universitaires de Geriatrie de Geneve, Geneva, Switzerland
SYNOPSIS The Psychogeriatric Assessment Scales (PAS) provide an assessment of the clinical changes seen in dementia and depression. Principal components analysis and latent trait analysis were used to develop a set of scales to summarize these clinical changes. There are three scales derived from an interview with the subject (Cognitive Impairment, Depression, Stroke) and three from an interview with an informant (Cognitive Decline, Behaviour Change, Stroke). Results are reported on the reliability and validity of these scales using data from clinical samples in Sydney and Geneva and a population sample from Canberra. The scales were found to have excellent validity when judged against clinical diagnoses of dementia and depression and could distinguish Alzheimer's from vascular dementia. Cut-off points were developed to indicate correspondence between scale scores and clinical diagnoses. Percentile rank norms were developed from the Canberra population sample. The PAS is easy to administer and score and can be used by lay interviewers after training. It is intended for application both in research and in services for the elderly.
INTRODUCTION
In assessing the mental state of elderly persons, the main questions asked by clinicians are whether a person is demented or depressed. These two are the most prominent categories of psychiatric morbidity in the elderly as shown by epidemiological surveys (e.g. Copeland et al. 1987). For both these diagnoses, criteria such as those specified in ICD-10 (World Health Organ-ization, 1993) or DSM-III-R (American Psy-chiatric Association, 1987) are becoming more frequently used. These criteria require an exam-ination by a clinician, or by a lay person administering a standardized instrument with the responses being assembled invariably by an algorithm. While the use of such criteria has improved diagnostic reliability, the issue of
1 Address for correspondence: Dr A. F. Jorm, NH&MRC Social Psychiatry Research Unit, The Australian National University, Canberra, ACT 0200, Australia.
validity has been relatively neglected. Diagnostic syndromes such as dementia and depressive disorder have been defined on the basis of expert consensus rather than derived from research. Another limitation of diagnostic criteria is that they treat syndromes as categorical states, whereas there are good arguments that disorders such as dementia and depression form a con-tinuum in the population (Goldberg & Huxley, 1992; Huppert et al. 1994). For continuous disorders, arbitrary thresholds have to be im-posed to define cases and the decision of where to place the threshold has a major influence on prevalence rates. For example, prevalence rates for ICD-10 depressive disorder are higher than for DSM-III-R because the former criteria require fewer symptoms to be present than the latter (Henderson et al. 1993), while for dementia the DSM-III-R criteria give a higher prevalence rate than the stricter ICD-10 criteria (Henderson et al. 1994).
manner using scales of depressive symptoms such as the Geriatric Depression Scale (Yesavage et al. 1983) and scales of cognitive impairment such as the Mini-Mental State Examination (Folstein et al. 1975). However, these scales generally cover only a single aspect of mental state and rely on only one source of information (e.g. cognitive testing, subject reports or in-formant reports). A multi-dimensional approach has been less widely used. Exceptions are the clinical diagnostic scales developed from the CAMDEX (Roth et al. 1986) and the diagnostic rating scales of Gustafson & Nilsson (1982), neither of which has come into wide use.
It is apparent that a considerable advance would be achieved, both for clinical and research purposes, by having an instrument to assess the clinical domains of both dementia and de-pression, but doing so without prior assumptions about the existence of syndromes. Such an instrument should be based on a wide sampling of symptoms from these domains using various sources of information, so that empirically-derived scales can be constructed. In this way, a parsimonious assessment should be possible, giving a profile of the individual across relevant dimensions.
One approach to the validity of syndromes is provided by an analysis of the correlations among symptoms. Symptoms that belong to the same syndrome should be correlated with each other, but uncorrelated with symptoms belong-ing to other syndromes. Techniques such as principal components analysis and factor analy-sis can be used to investigate the dimensions which underlie a set of symptoms and yield a continuous rather than categorical represen-tation. Jorm et al. (1993) have used this approach to examine the symptoms and signs used in the differential diagnosis of dementing disorders. They carried out a principal components analysis on clinical data from a population survey and found four factors which they labelled: cognitive impairment, depressive symptoms, disturbed behaviour and cerebrovascular disease. The profile of scores on these factors was able to distinguish non-demented, Alzheimer's and vas-cular dementia cases. Alzheimer's cases were found to score highly on cognitive impairment and disturbed behaviour, but low on cerebro-vascular disease and depressive symptoms. By contrast, vascular dementia cases were high on
cognitive impairment and cerebrovascular dis-ease, but low on disturbed behaviour and depressive symptoms. Non-demented subjects were low on all four factors. These findings show that different dementing diseases can be distinguished on the dimensions found in the principal components analysis. However, the authors did not use the data to produce scales that could be used by others.
We report here the development of a set of scales covering the clinical domains of dementia and depression as defined by the ICD-10 and DSM-III-R criteria. The scales are based on the items in the Canberra Interview for the Elderly (CIE), which is a standardized diagnostic in-terview administered by lay inin-terviewers and involves both an examination of the subject and an interview with an informant (Social Psy-chiatry Research Unit, 1992). The items were analysed using principal components analysis to derive a set of independent dimensions under-lying the clinical domains of dementia and depression, and then latent trait analysis (Duncan-Jones et al. 1986) was used to select out a subset of items with the most appropriate psychometric properties from each factor. The purpose of the Psychogeriatric Assessment Scales (PAS) described here is to provide a brief but comprehensive profile of an elderly person's mental state using a straightforward interview which can be quickly administered by lay interviewers.
METHOD
The PAS was developed using CIE data from an epidemiological survey of the elderly in Canberra (Henderson et al. 1993). The validity and reliability of the instrument was further assessed using CIE data from clinical samples in Sydney (Social Psychiatry Research Unit, 1992; Mac-kinnon et al. 1993) and Geneva (Mulligan et al. 1994). The nature of these three samples is described below.
The Canberra sample
The subjects were a sample of elderly persons aged ^ 70, from the Australian city of Canberra and adjacent town of Queanbeyan. There were separate samples taken of the elderly living in the community and those in institutions, with
approximately equal numbers of males and females. The details of the sampling are described in Henderson et al. (1993, 1994). Combining both community and institutional samples gave 1045 subjects, with 759 having both subject and informant interviews.
The subject and informant interviews involved the CIE as well as additional questions to cover social background, physical health, personality, social support, mental activity, self-reported cognitive function and use of services. Besides the CIE, the following additional scales were used in the analyses reported below: the Mini-Mental State Examination (MMSE) (Folstein et al. 1975; Holzer et al. 1984), the National Adult Reading Test (NART) (Nelson & O'Connell, 1978), the Informant Questionnaire on Cognitive Decline in the Elderly (IQCODE) (Jorm & Jacomb, 1989; Jorm et al. 1991), and the Goldberg anxiety and depression scales (Gold-berg et al. 1988; Mackinnon et al. 1994).
In addition to the main interview involving the CIE, a subgroup of subjects was examined in their own homes by a geriatrician. The subjects eligible for this clinical examination were those living in the community who scored < 27 on the MMSE. Of 175 persons eligible, 127 were examined. The examination consisted of a number of components, but the only information collected, which is relevant here, is the clinical diagnosis of dementia and type of dementia by ICD-10 and DSM-HI-R criteria and the Ischaemic Score of Hachinski et al. (1975). The Sydney sample
This consisted of 64 patients recruited from a geriatric clinic and 12 patients recruited from other sources, mainly psychogeriatricians. The mean age of these subjects was 80 years. The subjects participated in a study of the reliability and validity of the CIE (Social Psychiatry Unit, 1992; Mackinnon et al. 1993). Seventy-two respondents nominated informants and both agreed to an initial interview and re-interview. The subjects and informants were interviewed twice with the CIE using a different interviewer on the second occasion. The interval between interviews averaged 2-8 days (range 1-14) for the subjects and 3-2 (range 1-15) for their inform-ants. Clinicians made independent diagnoses of dementia and depression in the subjects using ICD-10 and DSM-III-R criteria.
The Geneva sample
This sample was recruited for a study of the reliability and validity of the French language version of the CIE (Mulligan et al. 1994). The design of the study followed that used in Sydney. Sixty elderly subjects were recruited from the geriatric unit of a hospital. The mean age of the subjects was 78 years. They were examined for dementia and depression by a psychogeriatrician using ICD-10 and DSM-III-R criteria. The subjects and their informants were indepen-dently interviewed by lay interviewers using the CIE. Forty-three subjects and their informants had a second interview with the CIE by a different interviewer. The period between the first and second interviews averaged 2-1 days for the subjects and 2-7 days for the informants. Analysis of data
Items from the CIE used in the diagnosis of dementia or depression were subjected to prin-cipal components analysis using data from the Canberra sample. A scree plot was used to determine the number of factors to be retained for varimax rotation. Items with relatively high loadings on the rotated factors were selected as candidates for inclusion in scales and subjected to a two-parameter latent trait analysis (Duncan-Jones et al. 1986) to select items with good slopes and covering a range of thresholds. Slope is an expression of an item's discriminating power, while its threshold is the place on the latent dimension from normal to severe. The reliability of the resulting scales was assessed using internal consistency (Cronbach's alpha) in all three samples and test-retest in the Sydney and Geneva samples. Correlations with other scales were examined using Pearson coefficients and statistical significance evaluated at the P < 001 level. Validity of the scales was assessed using diagnoses of dementia and depression as the standards. Diagnoses were available in all three samples from both the CIE algorithm and clinicians. Receiver operating characteristics (ROCs) were calculated for each scale against each available diagnosis (Hanley & McNeil, 1982). An ROC consists of a plot of sensitivity against false positive rate (1 - specificity) for all possible cutpoints on a test. Areas under the ROCs were used as an overall index of scale performance, with an area of 1-0 representing
perfect performance and 0-5 chance perform- elusion criteria would not be expected to ance. Areas and their standard errors were correlate with other symptoms of a disorder, calculated according to the non-parametric they were removed from the item pool used in method of Hanley & McNeil (1982). Percentile the principal components analysis,
rank norms for the scales were calculated using The CIE does not attempt to differentiate data from the Canberra sample weighted back Alzheimer's dementia from vascular dementia, to the distribution of the elderly population in so relevant items were not covered by the terms of age, sex and place of residence. selection procedure. However, the CIE does have a number of items relevant to cerebro-RFSIITTS vascular disease and these were included in the
analysis.
Principal components analysis of Canberra CIE A n examination of the endorsement frequency
•*ata of the item pool showed that some were either
The items included in the principal components rarely endorsed or almost universally endorsed analysis were those from the CIE which covered in the Canberra sample. Because they con-ICD-10 Dementia, con-ICD-10 Mild Moderate and tributed little discrimination in the sample, Severe Depressive Episode, DSM-III-R Demen- items with < 1 % or > 99 % endorsement were tia and DSM-III-R Major Depressive Episode, excluded. This procedure left 93 variables for the A number of CIE items covered exclusion criteria analysis.
for these diagnoses. For example, delirium is Of the Canberra sample of 759 with both an exclusion criterion for DSM-III-R Major subject and informant interviews, 423 (56%) Depressive Episode and various psychotic dis- had complete data on all 93 variables. Many orders are exclusion criteria for DSM-III-R subjects had missing data on only a small Major Depressive Episode. Because such ex- number of variables. To increase the size of the
Table 1. Items with highest loadings in the principal components analysis Loading Item content
Factor 1: Cognitive Decline*
0-60-0-69 Memory or intellectual change of at least 6 months duration
0-50-0-59 Disability due to intellectual change; trouble recalling conversations; disability due to memory problems; trouble remembering recent events; trouble concentrating; trouble remembering appointments; trouble finding belongings 0-40-0-49 Difficulty making decisions; social problems due to intellectual change; thoughts mixed up; needs help with money; social
problems due to memory
Factor 2: Cognitive Impairment]
0-60-0-69 Similarities
0-50-0-59 Incidental recognition memory; memory for drawing; vocabulary; copying cube; identifying objects in complex picture; knowledge of famous people
0-40-0-49 Copying pentagons; reading 'cough hard'; recalling name and address; identifying objects at unusual angles; recalling three unrelated items; reading 'close your eyes'; sentence verification
Factor 3: Behaviour Change*
0-50-0-59 More inflexible; more demanding; embarrassing in public
0-40-0-49 More impatient; more cantankerous; more apathetic; less considerate of others' feelings; likes mixing less; sadder mood; less easy to get on with; less initiative
Factor 4: Stroke
0-70-0-79 Stroke (subject report); stroke (informant report) 0-6O-O-69 Sudden difficulty with speaking (subject report)
0-50-0-59 Sudden weakness one side (informant report); sudden difficulty with speaking (informant report) 0-40-0-49 Sudden weakness on one side (subject report)
Factor 5: Depression]
0-60-0-69 Too little energy
0-50-0-59 Trouble concentrating; talked or moved slowly
0-40-0-49 Depressed mood; slowed thinking; difficulty making decisions; thoughts mixed up * Informant items, j Subject items.
sample for the principal components analysis, subjects were included if they had up to four missing variables. Mean scores for the sample were substituted for these missing values. This procedure increased the sample size to 683.
A principal components analysis was carried out on the 93 variables followed by a varimax rotation. The first ten factors accounted for 10-6, 4-2, 3-4, 3-2, 2-7, 2-2, 2-1, 1-9, 1-8 and 1-7% of the variance respectively. Using a scree plot, it was decided to rotate five factors. The variables with loadings of ^ 0-4 on these factors are sum-marized in Table 1. The first factor was labelled 'Cognitive Decline' because the variables with high loadings involved informants' reports of cognitive change. The second factor was labelled 'Cognitive Impairment' because the variables with high loadings involved cognitive tests. The third factor, labelled 'Behaviour Change', in-volved informants' reports of changes from earlier in life in personality or judgement. The fourth factor involved cerebrovascular disease items, both reported by the subject and by the informant, and was labelled 'Stroke'. The fifth factor, labelled 'Depression', involved depress-ive symptoms as reported by subjects.
There are a number of potential limitations of this analysis with respect to sample bias and the handling of missing data. It is possible that the 683 subjects included in the analysis are a biased sample. To see if this was the case, the subjects included were compared to those excluded. No difference was found in education or sex dis-tribution, but the excluded subjects were found to be older (means of 78-8 v. 76-6 years), to be more cognitively impaired on the MMSE (means of 25-5 v. 27-4) and to be more depressed on the Goldberg scale (means of 2-4 v. 1-9). The exclusion of subjects due to missing data is important only if these subjects have a different covariance structure to those who remain in the analysis. To determine whether this was the case, principal components were extracted from correlation matrices calculated from subjects from whom all data were available (N = 423) and also on a pair-wise basis (N ranged from 767 to 964), in addition to the relatively conservative procedure of substituting the mean for missing values. The results of these procedures were very similar and the mean-substituted results only are reported. The same argument applies to analysis of the raw sample which oversampled males.
Separate analyses of male and female data yielded similar solutions, with coefficients of congruence for the factors between 0-69 and 0-85.
Alternative rotation procedures were also tried in the principal components analysis. Retaining four rather than five factors for varimax rotation led to the Cognitive Decline and Behaviour Change factors collapsing into a single factor of informant reported changes. Rotating six factors produced the same factors as the five-factor rotation, plus an additional social disability factor which related to responses to subsections of a single nested question asked to informants. An oblique rotation of five factors produced similar results to the orthogonal varimax rotation, but with small correlations between some of the factors. The Cognitive Decline factor correlated 0-23 with the Cognitive Impairment factor and 0-23 with the Behaviour Change factor. All other correlations between factors were small (< 0-14).
Selection of items for scales
Items with loadings of ^ 0-30 on a factor were regarded as candidates for inclusion on scales to measure the factors. However, some items have complex characteristics which made them less suitable for inclusion. These were items which were part of a nested set and could not be considered in isolation and items which require complex materials such as photographs. The remaining items loading on each factor were subjected to a two-parameter latent trait analy-sis. Items which were not already dichotomous (some cognitive test items) had to be dichoto-mized for this analysis. Items from each factor were analysed separately, confirming the uni-dimensional nature of each factor and providing separate slope and threshold parameters for each item. Items were selected for final inclusion in scales so as to have steep slopes (i.e. they were highly discriminating items) and to have a range of thresholds (i.e. they covered a range of severity so as to discriminate among more severely impaired as well as more mildly im-paired individuals). The stroke items were split into separate subject and informant scales, each having parallel items. This procedure yielded a Cognitive Impairment scale consisting of nine items (but yielding scores from 0 to 21 errors because some items are scored according to the
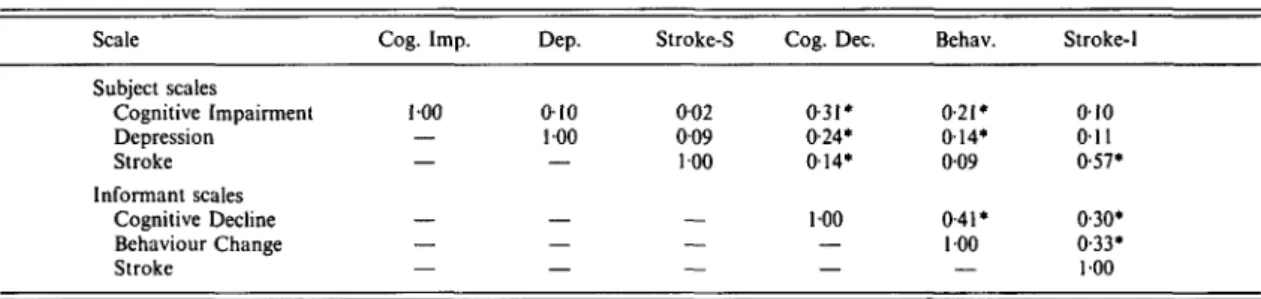
Table 2. Interconelations of the PAS in the Canberra sample Scale Subject scales Cognitive Impairment Depression Stroke Informant scales Cognitive Decline Behaviour Change Stroke Cog. Imp. 100 — — — — — Dep. 010 100 — — — — Stroke-S 002 009 100 — — — Cog. Dec. 0-31* 0-24* 014* 100 — — Behav. 0-21 • 014* 009 0-41* 100 — Stroke-1 010 011 0-57* 0-30* 0-33* 100 Correlations computed with list-wise deletion of missing values, N = 497; * P < 0-01.
Table 3. Correlations between PAS and socio-demographic variables in the Canberra sample
Scale Subject scales Cognitive Impairment Depression Stroke Informant scales Cognitive Decline Behaviour Change Stroke Age 0 31* 005 002 0-28* 009 013* Sex (female) - 0 0 5 013* - 0 0 3 - 0 0 1 - 0 0 2 001 Education (years) - 0 1 8 * - 0 0 6 - 0 0 2 -0-01 - 0 0 3 -0-02 For correlations involving subject scales N = 887-901; for informant scales N = 682-748; * P < 001.
number of components incorrect), a Depression scale of 12 items, a Cognitive Decline scale of ten items, a Behaviour Change scale of 15 items, and subject and informant Stroke scales each consisting of six items. These scales constitute the Psychogeriatric Assessment Scales (PAS). All scales are scored using an unweighted sum of the items. Because all items were selected to have uniformly high discrimination, the 'number right' score (raw total) is a simple and accurate method of scoring each scale (cf. Duncan-Jones et al. 1986).
The intercorrelations among the scales are shown in Table 2. As would be expected, the two Stroke scales were correlated, but there were also correlations between other scales, the highest being between Cognitive Decline and Behaviour Change. To see whether higher-order factors could be found with the scales, a principal components analysis was carried out on them (after the Stroke scales had been combined into one). Although only one factor had an eigen-value of greater than one, the scales did not have
uniformly high loadings on this factor. This suggests a low degree of redundancy among the scales.
Correlations of scales with other variables
Table 3 shows the correlations of scales with age, sex and years of education. It can be seen that Cognitive Impairment and Cognitive De-cline increase with age, females tend to score higher on Depression, and Cognitive Impair-ment (but not Cognitive Decline) is related to education.
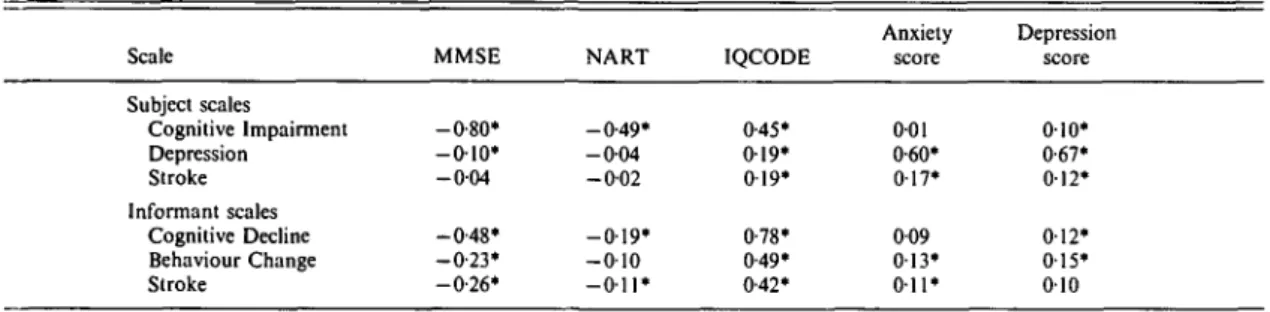
Table 4 shows the correlations of the scales with other tests measuring cognitive functioning or affective state. The MMSE is a measure of current cognitive functioning, the NART esti-mates pre-morbid ability, while the IQCODE measures cognitive decline as perceived by an informant. The Cognitive Impairment scale correlates very highly with the MMSE and also with the NART and IQCODE. The pattern of correlations would suggest that the scale reflects both pre-morbid ability and cognitive decline. The Cognitive Decline scale correlates highly with the IQCODE, which is not surprising given that they both rely on informant reports, but also with the MMSE. The Cognitive Decline scale appears to be much less influenced by pre-morbid ability than the Cognitive Impairment scale. The Depression scale correlates highly with both the depression and anxiety scales of Goldberg et al. (1988), although the correlation with depression is marginally higher than with anxiety. The Behaviour Change scale and the informant Stroke scale correlate most highly with the IQCODE, reflecting the common source of information used by these scales.
To see whether the affective state of inform-ants influences their ratings, scale scores were
Table 4. Correlations between PAS and other tests in the Canberra sample Scale Subject scales Cognitive Impairment Depression Stroke Informant scales Cognitive Decline Behaviour Change Stroke MMSE -0-80* - 0 1 0 * - 0 0 4 -0-48* - 0 - 2 3 * -0-26* NART -0-49* - 0 0 4 -0-02 - 0 1 9 * - 0 1 0 - O i l * IQCODE 0-45* 019* 0 19* 0-78* 0-49* 0-42* Anxiety score 001 0-60* 017* 009 0 1 3 ' 011* Depression score 010* 0-67* 012* 012* 015* 010 For correlations involving subject scales N = 659-890; for informant scales N = 600-708; * P < 0 0 1 .
Table 5. Reliability of the PAS in three samples Internal consistency Test-retest Scale Subject scales Cognitive Impairment Depression Stroke Informant scales Cognitive Decline Behaviour Change Stroke Canberra 0-60 0-68 0-54 0-81 0-80 0-72 Sydney 0-64 0-76 0-59 0-89 0-83 0-55 Geneva 0-53 0-77 0-71 0-78 0-88 0-50 Sydney 0-81 0 81 0-68 0-94 0-83 0-83 Geneva 0-81 0-76 0-76 0-93 0-97 0-85
For internal consistency N = 690-901 in Canberra, 59-67 in Sydney and 30-59 in Geneva; for test-retest N = 50-55 in Sydney and 10-41 in Geneva.
also correlated with anxiety and depression symptoms in the informants, as measured by the Goldberg et al. (1988) symptom inventory. Anxiety in the informants was found to be significantly correlated with the subject's Cog-nitive Decline score (r = 016, # = 669) and Behaviour Change score (r = 016, # = 6 3 6 ) . Similar correlations were found between de-pression in the informants and these scales (r = 017, JV = 699 and r = 014, N = 664, res-pectively). Correlations with all other scores were near zero.
Reliability of the scales in three samples
Reliability was evaluated using data from the Canberra, Sydney and Geneva samples. Internal consistency reliability (Cronbach's alpha) was evaluated in all three samples, while test-retest reliability was evaluated only in Sydney and Geneva. Table 5 shows the results. Test-retest coefficients were generally higher than the internal coefficients. This finding reflects the fact that Cronbach's alpha is a lower bound of test reliability (McDonald, 1985, p. 217).
Validity of the scales in three samples
The scales were evaluated as screening tests for dementia and depression using ROCs. Diag-noses of dementia and depression were available from the CIE algorithm for the Canberra, Sydney and Geneva samples. These diagnoses were made according to both ICD-10 and
DSM-III-R criteria. In addition, clinical diagnoses of
ICD-10 and DSM-III-R dementia were available for all three sites, but in the Canberra sample dementia diagnoses were made only on subjects living outside institutions who had MMSE scores < 27. Thus, the areas under the ROC for the Canberra sample are likely to be conservative because subjects who were least likely to be cognitively impaired were excluded. Clinical diagnoses of depression (DSM-III-R Major Depressive Episode and ICD-10 Depressive Episode) were made only for the Sydney and Geneva samples. All clinical diagnoses were made independently of the PAS data, but the CIE diagnoses are not independent of the PAS because they were based on the same interview.
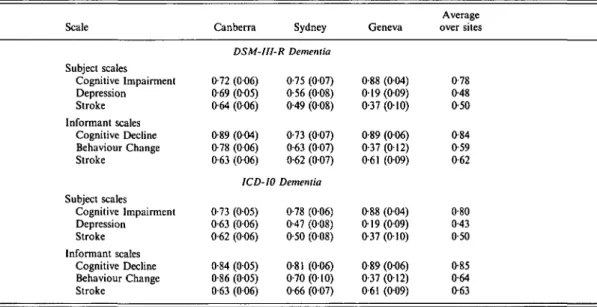
Table 6. Areas under the ROC {and standard errors) for the PAS as a screening test for dementia diagnosed by the CIE algorithm
Scale Canberra Sydney Geneva
Average over sites Subject scales Cognitive Impairment Depression Stroke Informant scales Cognitive Decline Behaviour Change Stroke Subject scales Cognitive Impairment Depression Stroke Informant scales Cognitive Decline Behaviour Change Stroke DSM-III-R Dementia 0-88 (003) 0-57 (0-04) 0-62 (005) 0-87 (0-03) 0-80 (004) 0-67 (004) 0-75 (006) 0-55 (009) 0-49 (009) 0-86 (005) 0-75 (006) 0-60 (008) 1CD-10 Dementia 0-93 (002) 0-60 (007) 0-60 (007) 0-98 (001) 0-95 (002) 0-72 (0-06) 0-73 (0-07) 0-39 (012) 0-48 (010) 0-86 (005) 0-83 (005) 0-54 (010) 0-75 (007) 0-28 (013) 0-37(0-10) 0-91 (004) 0-54(0-13) 0-54 (010) 0-76 (008) 0-32 (013) 0-39 (011) 0-80(0-12) 0-58 (018) 0-67 (013) 0-79 0-47 0-49 0-88 0-70 0-60 0-81 0-44 0-49 0-88 0-79 0-64
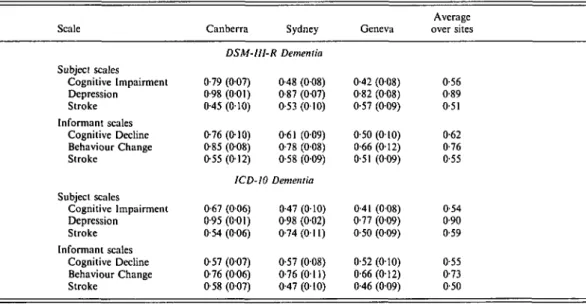
Table 7. Areas under the ROC (and standard errors) for the PAS as a screening test for dementia diagnosed by clinicians Scale Subject scales Cognitive Impairment Depression Stroke Informant scales Cognitive Decline Behaviour Change Stroke Subject scales Cognitive Impairment Depression Stroke Informant scales Cognitive Decline Behaviour Change Stroke Canberra Sydney DSM-III-R Dementia 0-72 (006) 0-69 (005) 0-64 (006) 0-89 (004) 0-78 (006) 0-63 (006) 0-75 (007) 0-56 (008) 049 (008) 0-73 (007) 0-63 (007) 0-62 (007) ICD-10 Dementia 0-73 (005) 0-63 (006) 0-62 (006) 0-84 (0-05) 0-86 (005) 0-63 (006) 0-78 (006) 0-47 (0-08) 0-50 (008) 0-81 (006) 0-70 (010) 0-66 (007) Geneva 0-88 (004) 0 1 9 ( 0 0 9 ) 0-37(010) 0-89 (006) 0-37 (012) 0-61 (009) 0-88 (004) 019 (009) 0-37 (010) 0-89 (006) 0-37 (012) 061 (009) Average over sites 0-78 0-48 0-50 0-84 0-59 0-62 0-80 0-43 0-50 0-85 0-64 0-63
Table 6 shows the areas under the ROC where the validity standard was dementia diagnosed by the CIE algorithm. Both the Cognitive Im-pairment and Cognitive Decline scales per-formed well at detecting dementia. The Be-haviour Change scale also showed some ability to detect dementia, although it did not perform well in this regard. All other scales performed at chance level or not much better than chance.
Table 7 shows the areas under the ROC using clinically diagnosed dementia as the validity standard. Again, the Cognitive Impairment and Cognitive Decline scales did best at detecting dementia. The Behaviour Change scale also showed some discriminating power, except in the Geneva sample where it performed poorly.
Table 8 shows the results for depression diagnosed by the CIE algorithm. The Depression
Table 8. Areas under the ROC (and standard errors) for the PAS as a screening test for
depression diagnosed by the CIE algorithm
Scale Canberra Sydney Geneva
Average over sites Subject scales Cognitive Impairment Depression Stroke Informant scales Cognitive Decline Behaviour Change Stroke Subject scales Cognitive Impairment Depression Stroke Informant scales Cognitive Decline Behaviour Change Stroke DSM-UI-R Dementia 0-79 (007) 0-98 (001) 0-45 (010) 0-76 (010) 0-85 (008) 0-55 (012) ICD-10 0-67 (006) 095 (0-01) 0-54 (006) 0-57 (007) 0-76 (006) 0-58 (007) 0-48 (008) 0-87 (007) 0-53 (010) 0-61 (009) 0-78 (008) 0-58 (009) Dementia 0-47 (010) 0-98 (0-02) 0-74(011) 0-57 (008) 0-76(011) 0-47 (010) 0-42 (0-08) 0-82 (008) 0-57 (009) 0-50(010) 0-66(012) 0-51 (009) 0-41 (008) 0-77 (009) 0-50 (009) 0-52 (0-10) 0-66(012) 0-46 (009) 0-56 0-89 0 51 0-62 0-76 0-55 0-54 0-90 0-59 0-55 0-73 0-50
Table 9. Areas under the ROC (and standard
errors) for the PAS as a screening test for depression diagnosed by clinicians
Scale Sydney Geneva
DSM-III-R Depression Subject scales Cognitive Impairment Depression Stroke Informant scales Cognitive Decline Behaviour Change Stroke 0-53 (008) 0-85 (007) 0-54 (010) 0-52 (008) 0-74 (008) 0-48 (009) 0-29 (007) 0-77 (009) 0-60(0-10) 0-39 (009) 0-56 (013) 0-54 (009) ICD-10 Depression Subject scales Cognitive Impairment Depression Stroke Informant scales Cognitive Decline Behaviour Change Stroke 0-52 (008) 0-81 (008) 0-38 (010) 0-43 (009) 0-78 (008) 0-41 (009) 0-29 (007) 0-77 (009) 0-60 (010) 0-39 (0-09) 0-56(0-13) 0-54 (009) Average over sites 0-41 0-81 0-57 0-46 0-65 0-51 0-40 0-79 0-49 0-41 0-67 0-48
scale performed well and the Behaviour Change scale showed some ability to detect depression. Other scales performed at near chance level. Table 9 shows the results for clinically diagnosed depression which were very similar to those with the CIE algorithm.
The areas under the ROC shown in the tables do not give values for sensitivity and specificity. For the benefit of readers who may be interested in these values, ROCs were plotted for the Cognitive Impairment, Cognitive Decline and Depression scales using the combined data from the Sydney and Geneva samples (see Fig. 1). The validity standard used in these ROCs was a clinical diagnosis of either dementia or de-pression. In evaluating the performance of the scales in these samples, it must be borne in mind that these were typical clinical samples in which all subjects had an illness of some kind and the subjects were not selected to include clear-cut cases or non-cases. For example, the dementia cases were classified by ICD-10 criteria as mild in 18 cases, moderate in 14 and severe in only four. Severity was not rated for DSM-III-R Dementia, but the mean MMSE score of the DSM-III-R cases was 21-8 (range 11-29). It is apparent that these samples represented a realistic diagnostic challenge.
The ROCs show the ability of the PAS to discriminate cases from non-cases, but with dementia it is often desirable to differentiate between specific dementing diseases. The CIE algorithm does not subdivide dementia cases further and only in the Canberra sample was a clinical diagnosis made of type of dementia. These clinical diagnoses were used to see whether
Cognitive Impairment scale
o-cn
0 -T
25 50 75 1-Specificity Cognitive Decline scale
100 25 50 75 1-Specificity Depression scale 25 50 75 1-Specificity 100
FIG. 1. ROCs for the Cognitive Impairment, Cognitive Decline and Depression scales in the combined Sydney and Geneva samples (D-D, DSM-II1-R Dementia; O-O, ICD-10 Dementia).
the Stroke scales are able to discriminate vascular from other forms of dementia. Subjects were classified according to whether they had ICD-10 Vascular Dementia or DSM-HI-R Multi-Infarct Dementia. With the ICD-10 criteria, there were 11 cases of vascular dementia and 51 cases of other dementias (mainly Dementia in Alz-heimer's Disease). An ROC analysis gave an area of 0-90 (S.E. = 006) for the subject Stroke scale and 0-87 (S.E. = 0-08) for the informant Stroke scale. Similarly with the DSM-III-R criteria, there were 11 cases of multi-infarct dementia and 44 cases of other dementias (mainly Primary Degenerative Dementia of the Alzheimer Type). The areas under the ROC for this diagnosis were 0-91 (S.E. = 0-06) and 0-86 (S.E. = 0-08) for the subject and informant Stroke scales respectively. An additional indicator of the validity of the Stroke scales is their cor-relation with Hachinski et a/.'s (1975) Ischaemic Score, which was also used by the Canberra clinician. The correlation with the subject Stroke scale was 0-71 (N = 118) and with the informant Stroke scale 0-65 (N = 93).
Development of norms and a summary profile Interpretation of PAS scores is aided by referring to population norms. The Canberra sample was therefore used to develop percentile rank norms for the scales. Because the Canberra study involved separate sampling of community dwel-lers and institutional residents and because males were oversampled compared to females, the Canberra PAS data were weighted by age group, sex and place of residence to match the structure of the population aged ^ 70 in Canberra and Queanbeyan in 1990. Subjects were included in the normative sample for a particular scale if they had complete data on that scale, regardless of whether there was missing data on other scales. The same norms were developed for all people aged ^ 70 rather than being made more age specific. To use age-specific norms would tend to mask impairments in the very elderly because age is a major risk factor for these impairments. Similarly, the norms take no account of education, which is correlated only to the Cognitive Impairment scale. There is still debate in the literature about whether such education differences are real or reflect test bias (Mortimer & Graves, 1993).
Median or below
Cognitive Depression Stroke
Impairment Cognitive Behaviour StrokeDecline Change
Informant scales
Subject scales
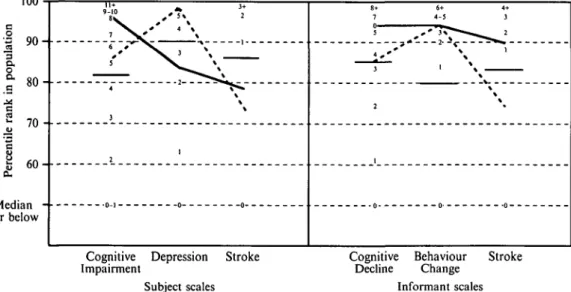
FIG. 2. Average scores on the PAS for cases of dementia (—) and depression (—).
Median or below
Cognitive Depression Stroke Impairment
Subject scales
Cognitive
Decline BehaviourChange Informant scales
Stroke
FIG. 3. Average scores on the PAS for cases of Alzheimer's dementia (—) and vascular dementia (—-).
continuous rather than categorical represen-tation of psychopathology, it is useful to consider how scores correspond to clinical diagnoses. To ensure sufficiently large groups for analysis, cases of dementia and depression were pooled from the Canberra, Sydney and Geneva samples. Individuals were included as cases if they satisfied either the ICD-10 or DSM-III-R criteria. Cut-offs were devised for each scale which identified approximately 80% of cases with the relevant diagnosis. This was done separately for cases
diagnosed with the CIE algorithm and for clinically diagnosed cases. However, the results were very similar, so only the results with the algorithmic diagnoses are presented here. For the Cognitive Impairment scale a cut-off of 4/5 identified approximately 80 % of dementia cases, as did a cut-off of 3/4 on the Cognitive Decline scale. The Behaviour Change scale appears to be sensitive to both dementia and depression, and it was found that a cut-off of 0/1 identified the required percentage for both diagnoses. For the
two Stroke scales, a cut-off of 0/1 was found appropriate for vascular dementia. For the Depression scale a cut-off of 3/4 identified approximately 80 % of depression cases. It must be emphasized that these cut-offs are not meant to provide a de facto categorical diagnosis, but simply give an indication of how scores on the continuous scales correspond to conventional categories.
To aid presentation of scale scores a summary profile form was developed in which raw scores are plotted and interconnected with lines. The raw scores are automatically converted to percentile ranks on the form. Horizontal bars on the summary profile show the regions of the scales which incorporate approximately 80 % of cases. Fig. 1 shows the average profiles of cases of dementia and depression diagnosed by the CIE algorithm. These average profiles are based on cases meeting either ICD-10 or DSM-III-R criteria from all three samples. The average profiles of cases diagnosed by clinicians are very similar and therefore not shown. As expected, dementia cases have high scores on Cognitive Impairment and Cognitive Decline, but the Depression cases also tend to have raised scores on these scales. Conversely, the depression cases have very high scores on the Depression scale, with dementia cases lower. Figure 2 shows the average score profiles for cases of vascular and Alzheimer's dementia diagnosed by the Can-berra clinician. Again, cases are included if they satisfy either ICD-10 or DSM-III-R criteria. It can be seen that the Stroke scales clearly discriminate the two types of dementia (Fig. 3).
DISCUSSION
The results of the principal components analysis reported here substantially replicate those found by Jorm et al. (1993) using a different data set based on a population sample in Stockholm. Jorm et al. (1993) found four factors which they labelled 'Depressive Symptoms', 'Cerebrovas-cular Disease',' Disturbed Behaviour' and' Cog-nitive Impairment'. The present study found five factors labelled 'Depression', 'Stroke', 'Behaviour Change', 'Cognitive Impairment' and 'Cognitive Decline'. Despite the different labels, there is close correspondence between the factors in content, with the behaviour change factor in the present study corresponding to
Jorm et al.'s disturbed behaviour factor, and the present stroke factor corresponding to the earlier cerebrovascular disease factor. The major dif-ference is that in the present study cognitive test performance and informant-reported cognitive decline produced separate factors (labelled 'Cog-nitive Impairment' and 'Cog'Cog-nitive Decline' respectively), while in the earlier study they found a single factor (labelled 'Cognitive Im-pairment'). When four instead of five factors were retained for rotation in the present study, there was still not a replication of the earlier factors. However, if a five-factor solution was chosen in the earlier study, separate cognitive test and informant-reported cognitive change factors emerged, consistent with the present results. The difference in the results is probably due to the nature of the samples. In the earlier study, the data came from a population sample which had been screened using the MMSE. All subjects scoring below the MMSE cut-off and a matched sample of subjects scoring above the cut-off were given a clinical examination which provided the data for the principal components analysis. By contrast, the present study used data from an unscreened population sample and contained proportionately fewer cognitively im-paired subjects. In cognitively imim-paired subjects, the correlation between cognitive test perform-ance and informant reports would be greater than in a normal group where cognitive test performance largely reflects pre-morbid differ-ences rather than decline.
The present study also shows that the factors capture much of the information used in making clinical diagnoses of dementia and depression, including historical data. The latter are usually absent in brief assessment scales. The PAS differentiates cases of dementia and depression and cases of vascular dementia from Alzheimer's dementia. Again, the results are similar to those of the earlier study, with one major exception. Jorm et al. (1993) found that Alzheimer cases were high on the disturbed behaviour factor and low on the cerebrovascular disease factor, while vascular dementia cases showed the reverse pattern. However, in the present study the Alzheimer and vascular dementia cases were differentiated on the Stroke scales, but not on the Behaviour Change scale. This difference in findings may reflect the procedures used for clinical diagnosis in the two studies which may
have placed a different degree of emphasis on such changes. Further work is needed to see if Alzheimer cases really do tend to have more behaviour change.
The PAS aims to cover the clinical domains of dementia and depression, but differs in a number of ways from standard diagnostic criteria. The major difference is that the PAS treats psycho-geriatric impairments as continua rather than categories. An examination of the distributions of scale scores in the population shows that this approach is generally appropriate. The major exception is the Stroke scales, which have a highly skewed distribution with around 90 % of the population having a score of zero. With a distribution of this sort, a categorical model would seem appropriate, although there will be variations in severity amongst those in the category. The Behaviour Change scale also has a highly skewed distribution, with more than 80% of the population showing no change. This sort of distribution could be due to a lack of items which are sensitive to milder behaviour change, but it may also imply that a categorical model is applicable. Although the PAS was developed to fit with a continuous rather than categorical model, it is not necessary for users to accept the continuous model to use the PAS as an assessment tool. A second major difference between the PAS and categorical diagnoses is that the scales do not combine together diverse types of information. For example, a clinical diagnosis of Alzheimer's dementia might involve assessment of cognitive deficit, behaviour change and the absence of stroke symptoms. This information is then combined into a single diagnostic decision. However, it is apparent from the present data that these impairments are not so highly intercorrelated that they can be grouped together on empirical grounds. Fur-thermore, different sources of information (e.g. subject v. informant reports) may not always yield consistent findings and it is worth retaining these distinctions in summarizing clinical data. By providing a multi-dimensional profile on each subject, the PAS draws attention to subclinical impairments which may be ignored in a categorical classification. For example, subjects diagnosed as depressed also tend to have a notable degree of cognitive impairment, but this may not be captured by a diagnostic system in which subjects are often assigned
exclusively to one category. The multi-dimen-sional profile also shows similarities between subjects with different diagnoses. Thus, both dementia and depression cases tend to show similar behaviour changes from the informant's point of view.
The PAS does not purport to cover the less common psychogeriatric impairments or other important aspects of geriatric assessment such as disability. The reason for the exclusion of disability in constructing the PAS is that it is meant to cover the psychogeriatric domain but not physical functioning. Furthermore, there are already a number of widely used scales for assessing activities of daily living that can be used in conjunction with the PAS if needed. However, the PAS does provide an assessment of aspects of disability relevant to psycho-geriatric impairments. The Behaviour Change scale can be regarded as a measure of social disability, while the Cognitive Decline scale measures cognitive disability.
As with all tests, care should be taken in assuming population norms presented here when applying the PAS in other groups. While these norms are based on a relatively large probability sample, differences between Canberra residents and other Australian communities are known to exist. The Canberra elderly have a higher education level than other Australians.
Like its parent, the CIE, the PAS can be administered by lay interviewers after training. However, the PAS is much simpler than the CIE and would require less training. A single session of a few hours, followed up by practice in its use, should be sufficient. The PAS can be computer scored from the full CIE using a short SPSS program or administered as a stand-alone interview which can be easily scored by hand. Because the PAS is much shorter and simpler to administer than the full CIE, it may be preferred when the time available for assessment is limited or a continuous approach is preferred over diagnostic categories. It is intended for ap-plication in research and in service settings where a standardized assessment is required that is reasonably brief yet comprehensive.
The Canberra study was supported by grants from the National Health and Medical Research Council and the Australian Rotary Health Research Fund. Help with the Canberra study was provided by C.
Doyle, S. Lindsay and P. Jacomb. Help with the Sydney study was provided by G. A. Broe, J. Snow-don, S. Williams and A. Duncan. Help with the Geneva study was provided by P. Berney and P. Giannakopoulos.
Copies of the PAS are available at no cost by writing to: The Secretary, NH&MRC Social Psychiatry Research Unit, The Australian National University, Canberra, ACT 0200, Australia. REFERENCES
American Psychiatric Association (1987). Diagnostic and Statistical
Manual of Mental Disorders (3rd edn- Revised). DSM-III-R.
American Psychiatric Association: Washington, DC.
Copeland, J. R. M., Gurland, B. J., Dewey, M. E., Kelleher, M. J., Smith, A. M. R. & Davidson, I. A. (1987). Is there more dementia, depression and neurosis in New York? A comparative study of the elderly in New York and London using the computer diagnosis AGECAT. British Journal of Psychiatry 151, 466-473. Duncan-Jones, P., Grayson, D. A. & Moran, P. A. P. (1986). The
utility of latent trait models in psychiatric epidemiology.
Psycho-logical Medicine 16, 391-405.
Folstein, M. F., Folstein, S. E. & McHugh, P. R. (1975). 'Mini-Mental State': a practical method for grading the cognitive state of patients for the clinician. Journal of Psychiatric Research 12, 189-198.
Goldberg, D. & Huxley, P. (1992). Common Mental Disorders: A
Bio-Social Model. Tavistock/Routledge: London & New York.
Goldberg, D., Bridges, K., Duncan-Jones, P. & Grayson, D. (1988). Detecting anxiety and depression in general medical settings.
British Medical Journal 297, 897-899.
Gustafson, L. & Nilsson, L. (1982). Differential diagnosis of presenile dementia on clinical grounds. Ada Psychiatrica Scandinavica 65, 194-209.
Hachinski, V. C , Iliff, L. D., Zilhka, E., Du Boulay, G. H., McAllister, V. L., Marshall, J., Russell, R. W. R. & Symon, L. (1975). Cerebral blood flow in dementia. Archives of Neurology 32, 632-637.
Hanley, J. A. & McNeil, B. J. (1982). The meaning and use of the area under a receiver operating characteristic (ROC) curve.
Radiology 143, 29-36.
Henderson, A. S., Jorm, A. F., Mackinnon, A., Christensen, H., Scott, L. R., Korten, A. E. & Doyle, C. (1993). The prevalence of depressive disorders and the distribution of depressive symptoms in later life: a survey using draft ICD-10 and DSM-III-R.
Psychological Medicine 23, 719-729.
Henderson, A. S., Jorm, A. F., Mackinnon, A., Christensen, H., Scott, L. R., Korten, A. E. & Doyle, C. (1994). A survey of dementia in the Canberra population: experience with ICD-10 and DSM-III-R criteria. Psychological Medicine 24, 473-482.
Holzer, C. E., Tischler, G. L., Leaf, P. J. & Myers, J. K. (1984). An epidemiologic assessment of cognitive impairment in a community population. Research in Community and Mental Health 4, 3—32. Huppert, F. A., Brayne, C. & O'Connor, D. (eds.) (1994). Dementia
and Normal Aging. Cambridge University Press: Cambridge.
Jorm, A. F. & Jacomb, P. A. (1989). The Informant Questionnaire on Cognitive Decline in the Elderly (IQCODE): socio-demographic correlates, reliability, validity and some norms. Psychological
Medicine 19, 1015-1022.
Jorm, A. F., Scott, R., Cullen, J. S. & Mackinnon, A. J. (1991). Performance of the Informant Questionnaire on Cognitive Decline in the Elderly (IQCODE) as a screening test for dementia.
Psychological Medicine 21, 785-790.
Jorm, A. F., Fratiglioni, L. & Winblad, B. (1993). Differential diagnosis in dementia: Principal components analysis of clinical data from a population survey. Archives of Neurology 50, 72-77. McDonald, R. P. (1985). Factor Analysis and Related Methods.
Lawrence Erlbaum Associates: Hillsdale, New Jersey.
Mackinnon, A., Christensen, H., Cullen, J. S., Doyle, C. J., Hen-derson, A. S., Jorm, A. F., Korten, A. E. & Scott, L. R. (1993). The Canberra Interview for the Elderly: assessment of its validity in the diagnosis of dementia and depression. Ada Psychiatrica
Scandinavica 87', 146-151.
Mackinnon, A. J., Christensen, H., Jorm, A. F., Henderson, A. S., Scott, R. & Korten, A. E. (1994). A latent trait analysis of an inventory designed to detect symptoms of anxiety and depression using an elderly community sample. Psychological Medicine 24, 977-986.
Mortimer, J. A. & Graves, A. B. (1993). Education and other socioeconomic determinants of dementia and Alzheimer's disease.
Neurology 43 (suppl 4), S39-S44.
Mulligan, R., Mackinnon, A., Berney, P. & Giannakopulos, P. (1994). The reliability and validity of the French version of the Canberra Interview for the Elderly. Ada Psychiatrica Scandinavica 89, 268-273.
Nelson, H. E. & O'Connell, A. (1978). Dementia: the estimation of premorbid intelligence levels using the New Adult Reading Test.
Cortex 14, 234-244.
Roth, M., Tym, E., Mountjoy, C. Q., Huppert, F. A., Hendrie, H. Verma, S. & Goddard, R. (1986). CAMDEX: a standardized instrument for the diagnosis of mental disorder in the elderly with special reference to the early detection of dementia. British Journal
of Psychiatry 149, 698-709.
Social Psychiatry Research Unit (1992). The Canberra Interview for the Elderly: a new field instrument for the diagnosis of dementia and depression by ICD-10 and DSM-III-R. Ada Psychiatrica
Scandinavica 85, 105-113.
World Health Organization (1993). The ICD-10 Classification of
Mental and Behavioural Disorders: Diagnostic Criteria for Re-search. World Health Organization: Geneva.
Yesavage, J., Brink, T. L., Rose, T. L., Lum, O., Huang, V., Adey, M. & Leiver, V. O. (1983). Development and validation of a geriatric depression screening scale: a preliminary report. Journal