RESEARCH OUTPUTS / RÉSULTATS DE RECHERCHE
Author(s) - Auteur(s) :
Publication date - Date de publication :
Permanent link - Permalien :
Rights / License - Licence de droit d’auteur :
Bibliothèque Universitaire Moretus Plantin
Institutional Repository - Research Portal
Dépôt Institutionnel - Portail de la Recherche
researchportal.unamur.be
University of Namur
An Advanced User Interface for Exploring, Analysing and Browsing Digital Artwork
Collections
Dumas, Bruno; Moerman, Bram; Trullemans, Sandra; Signer, Beat
Publication date:
2014
Document Version
Early version, also known as pre-print
Link to publication
Citation for pulished version (HARVARD):
Dumas, B, Moerman, B, Trullemans, S & Signer, B 2014, 'An Advanced User Interface for Exploring, Analysing
and Browsing Digital Artwork Collections', Paper presented at AVI 2014 International Working Conference on
Advanced Visual Interfaces, Como, Italy, 27/05/14 - 30/05/14.
General rights
Copyright and moral rights for the publications made accessible in the public portal are retained by the authors and/or other copyright owners and it is a condition of accessing publications that users recognise and abide by the legal requirements associated with these rights. • Users may download and print one copy of any publication from the public portal for the purpose of private study or research. • You may not further distribute the material or use it for any profit-making activity or commercial gain
• You may freely distribute the URL identifying the publication in the public portal ?
Take down policy
If you believe that this document breaches copyright please contact us providing details, and we will remove access to the work immediately and investigate your claim.
An Advanced User Interface for Exploring, Analysing and
Browsing Digital Artwork Collections
Bruno Dumas, Bram Moerman, Sandra Trullemans and Beat Signer
Web & Information Systems Engineering Lab Vrije Universiteit Brussel
Pleinlaan 2, 1050 Brussels, Belgium
{bdumas,bmoerman,strullem,bsigner}@vub.ac.be
ABSTRACT
We present ArtVis, an advanced user interface combining state-of-the-art visualisation techniques and tangible interaction to ex-plore the Web Gallery of Art digital artwork collection consisting of almost 28 000 European artworks. The graphical ArtVis inter-face contains three separate visualisation panels that allow users to temporally, semantically and geographically investigate the dig-ital artwork collection. The goal of ArtVis is that users can gain new insights by visually analysing and exploring a large data set rather than to only provide detailed information about individual artworks. This explorative ArtVis interaction style is further fos-tered by a tangible user interface where physical artefacts can be used as simple handles to drive the faceted browsing of the rich digital information space.
Keywords
ArtVis; information visualisation; faceted browsing; tangible inter-action; artwork explorer.
Categories and Subject Descriptors
H.5.m. [Information Interfaces and Presentation]: Miscella-neous
General Terms
Experimentation; Human Factors.
In today’s world where large quantities of data are produced every day, data overload and the efficient processing of data has become an important issue. The question of how to retrieve information and extract meaning out of large quantities of data has been intensively investigated by researchers over the last decade and a number of approaches have been explored. One of these approaches relies on information visualisation (InfoVis) in order to help users in making sense out of large quantities of data [5]. InfoVis provides interac-tion techniques that allow users to refine, retrieve, filter and explore large data sets. Multiple techniques have been investigated to en-able interactivity in information visualisation, including zooming,
Permission to make digital or hard copies of all or part of this work for personal or classroom use is granted without fee provided that copies are not made or distributed for profit or commercial advantage and that copies bear this notice and the full citation on the first page. Copyrights for components of this work owned by others than the author(s) must be honored. Abstracting with credit is permitted. To copy otherwise, or republish, to post on servers or to redistribute to lists, requires prior specific permission and/or a fee. Request permissions from [email protected].
AVI’14,May 27–29 2014, Como, Italy
Copyright is held by the owner/author(s). Publication rights licensed to ACM.
Explore
Browse
Analyse
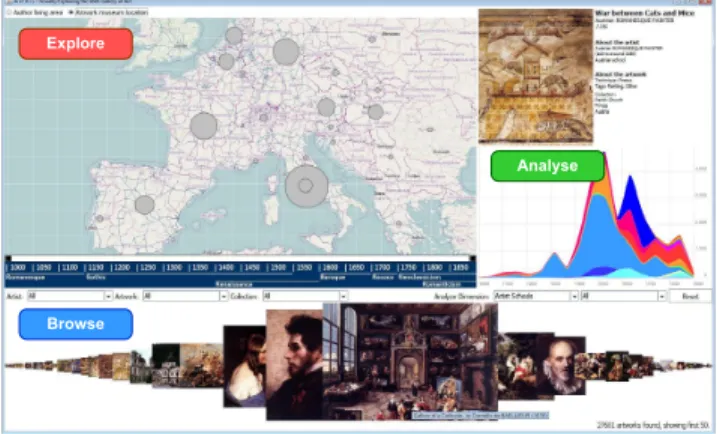
Figure 1: Graphical ArtVis user interface
highlighting or fisheye views. One of these techniques is called linking and brushing[4] and consists of a combination of multiple representations of the same data, which are linked in such a way that the selection of elements in one representation will highlight the same elements in the other representations. While techniques such as linking and brushing have demonstrated their strengths, they still mainly rely on graphical user interfaces and not many projects have explored interaction techniques that go beyond the well-established WIMP interaction style.
We demonstrate ArtVis [1], an advanced user interface for the ex-ploration, analysis and browsing of European artworks created be-tween the 11th and 19th century. ArtVis combines advanced vi-sualisation concepts such as linking and brushing with interaction techniques from the domain of tangible user interfaces (TUI). Our ArtVis demonstrator is based on data from the Web Gallery of Art1, a rich source of information about the artworks of European painters and sculptors. The Web Gallery of Art database consists of almost 28 000 artworks and we will first demonstrate the different graphical user interface elements to investigate this digital artwork collection. We then present the tangible user interface which allows users to interact with the ArtVis application in a natural way. The main ArtVis application window is shown in Figure 1. The graphical user interface consists of three panels, an Analyse panel, an Explore panel and a Browse panel, which have been imple-mented based on the Prefuse toolkit [3]. The three panels are al-ways synchronised which means that any update in the Analyse panel is propagated to the Explore and the Browse panel. The
1
Analyse panel consists of a stacked area chart showing how the artistic production changed over time. Thereby, three different di-mensions can be selected from a pulldown menu, including the artist schools, the artwork inspiration or the artwork form. For example, the light blue area in the Analyse panel in Figure 1 rep-resents the evolution of the Italian school between the 11th and the 19th century. From the visualisation in the Analyse panel, one can learn that the Italian school was at its peak around the year 1500. Similarly, if a user selects the artwork form dimension, they can see that the art of illumination disappeared shortly after the invention of the printing press. These two examples illustrate how the Analyse panel enables studying the evolution of artworks over time.
On the other hand, the Explore panel offers a geographical overview of two other dimensions. It shows the places where artists were liv-ing and it can also visualise the museums where the different art-works are currently located. By using panning and zooming, a user can navigate from the world level to the country level illustrated in Figure 1, or even down to city level. Note that we have used data from OpenStreetMap2for the realisation of the map. Depending on the zoom level, the circles on the map aggregate the number of art-works produced or located on a specific continent, in a country or a city. The power of the Explore panel comes from the fact that the displayed results can be filtered semantically or temporally. A user can utilise the Analyse panel to, for example, only select artworks that are related to the Italian school which means that the Explore panel will also only show artworks from the Italian school. An in-teractive timeline positioned below the Explore panel can further be used to select any subperiod of the 850 years of artworks which again will immediately be reflected in the Explore panel.
Finally, the Browse panel is located at the bottom of the ArtVis main view as illustrated in Figure 1. In addition to the possibility to browse the collection of artworks resulting from the filtering via the selections in the Analyse and Explore panels, the Browse panel also offers three text search fields which can be used to search the data set for a specific artist, artwork or museum.
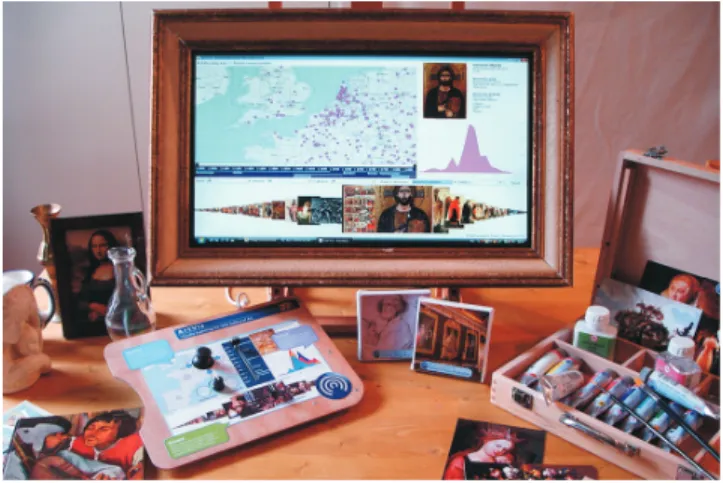
Figure 2: Tangible ArtVis user interface
In order to provide an attractive and stimulating user interface to be used in a museum setting, we further developed a tangible user interface which is shown in Figure 2 and can be used to interact with the graphical ArtVis user interface. The main components of the tangible ArtVis user interface are a picture frame on a painter’s
2
http://www.openstreetmap.org
easel, a painter’s tube box and palette, some paint tubes, postcards as well as a few other artefacts including a glass jug or a small sculpture. Each of these physical objects representing a painter’s working environment can be used to interact with ArtVis and the corresponding output is shown on a screen which has been em-bedded into the picture frame. The tangible ArtVis interface has been realised based on low-cost plug-and-play Phidgets [2]. The painter’s palette combines various physical controls to interact with the Explore and Browse panels. A small joystick is used to control the panning of the map while a rotation sensor is used to control the zoom level. A physical slider component further allows for navigating through the 850 years of artworks. Another slider can be used to navigate through the thumbnails of artworks shown in the Browse panel. In order to select the different dimensions of the Analyse panel, various RFID-tagged physical objects can be used. The painter’s palette has an embedded RFID reader and if an RFID-tagged object is held close to the palette, a selection will be triggered in the Analyse panel. For example, the selection of the glass jug will show the evolution of glassware whereas the statue will provide some insights about the evolution of sculpture. Last but not least, specific RFID tags for authors or museums can also be embedded in books about these subjects. An RFID-tagged book about the Louvre museum in Paris shows a selection of the Lou-vre’s collection together with the location where the artists were living. A user experience evaluation revealed that the demonstrated ArtVis user interface indeed attracts and stimulates users to explore the digital artwork collection [1].
Conclusion
We have demonstrated the advanced ArtVis user interface which combines state-of-the-art information visualisation techniques with tangible interaction in order to explore a large collection of art-works. The presented natural user interface fosters the investiga-tion of a data set in order to gain new insights and further offers new possibilities for multi-user interaction with the information space. Our ArtVis demonstration will hopefully result in a discus-sion about the presented design space and possibly identify other domains that could profit from the promising combination of ad-vanced visualisation techniques with tangible interaction.
Acknowledgments
Bruno Dumas is supported by MobiCraNT, a project forming part of the Strategic Platforms programme by Innoviris.
1.
REFERENCES
[1] B. Dumas, B. Moerman, S. Trullemans, and B. Signer. ArtVis: Combining Advanced Visualisation and Tangible Interaction for the Exploration, Analysis and Browsing of Digital Artwork Collections. In Proceedings of AVI 2014, Como, Italy, May 2014.
[2] S. Greenberg and C. Fitchett. Phidgets: Easy Development of Physical Interfaces through Physical Widgets. In Proceedings of UIST 2001, Orlando, USA, November 2001.
[3] J. Heer, S. K. Card, and J. A. Landay. Prefuse: A Toolkit for Interactive Information Visualization. In Proceedings of CHI 2005, Portland, USA, April 2005.
[4] D. A. Keim. Information Visualization and Visual Data Mining. IEEE Transactions on Visualization and Computer Graphics, 8(1), January 2002.
[5] B. Shneiderman. The Eyes Have It: A Task by Data Type Taxonomy for Information Visualizations. In Proceedings of VL 1996, Boulder, USA., September 1996.