HAL Id: hal-01464145
https://hal-amu.archives-ouvertes.fr/hal-01464145
Submitted on 10 Feb 2017
HAL is a multi-disciplinary open access
archive for the deposit and dissemination of
sci-entific research documents, whether they are
pub-lished or not. The documents may come from
teaching and research institutions in France or
abroad, or from public or private research centers.
L’archive ouverte pluridisciplinaire HAL, est
destinée au dépôt et à la diffusion de documents
scientifiques de niveau recherche, publiés ou non,
émanant des établissements d’enseignement et de
recherche français ou étrangers, des laboratoires
publics ou privés.
The average baboon brain: MRI templates and tissue
probability maps from 89 individuals
Scott Love, Damien Marie, Muriel Roth, Romain Lacoste, Bruno Nazarian,
Alice Bertello, Olivier Coulon, Jean-Luc Anton, Adrien Meguerditchian
To cite this version:
Scott Love, Damien Marie, Muriel Roth, Romain Lacoste, Bruno Nazarian, et al.. The average baboon
brain: MRI templates and tissue probability maps from 89 individuals. NeuroImage, Elsevier, 2016,
132, pp.526 - 533. �10.1016/j.neuroimage.2016.03.018�. �hal-01464145�
The average baboon brain: MRI templates and tissue probability maps
from 89 individuals
Scott A. Love
a,b,c,⁎
,1, Damien Marie
a,b,1, Muriel Roth
c, Romain Lacoste
b, Bruno Nazarian
c, Alice Bertello
a,b,d,
Olivier Coulon
c,e, Jean-Luc Anton
c, Adrien Meguerditchian
a,b,⁎⁎
a
Laboratoire de Psychologie Cognitive, UMR7290, Université Aix-Marseille/CNRS, 13331 Marseille, France
b
Station de Primatologie, CNRS, UPS846, 13790 Rousset, France
c
Institut des Neurosciences de la Timone, UMR7289, Université Aix-Marseille/CNRS, 13005 Marseille, France
d
Ecole Nationale Vétérinaire, 31300 Toulouse, France
eLaboratoire des Sciences de l'Information et des Systèmes, UMR 7296, Université Aix-Marseille/CNRS, 13288 Marseille, France
a b s t r a c t
a r t i c l e i n f o
Article history:
Received 21 October 2015 Accepted 7 March 2016 Available online 11 March 2016
The baboon (Papio) brain is a remarkable model for investigating the brain. The current work aimed at creating a population-average baboon (Papio anubis) brain template and its left/right hemisphere symmetric version from a large sample of T1-weighted magnetic resonance images collected from 89 individuals. Averaging the prior probability maps output during the segmentation of each individual also produced thefirst baboon brain tissue probability maps for gray matter, white matter and cerebrospinalfluid. The templates and the tissue probability maps were created using state-of-the-art, freely available software tools and are being made freely and publicly available:http://www.nitrc.org/projects/haiko89/orhttp://lpc.univ-amu.fr/spip.php?article589. It is hoped that these images will aid neuroimaging research of the baboon by, for example, providing a modern, high quality normalization target and accompanying standardized coordinate system as well as probabilistic priors that can be used during tissue segmentation.
© 2016 Elsevier Inc. All rights reserved.
Keywords: Papio anubis Template Atlas
Tissue probability map Brain mapping Non-human primate
Introduction
Given the phylogenetic proximity between humans, apes and monkeys, research on non-human primate models is an essential component to understanding both healthy brain function and disease (Belmonte et al., 2015; Roelfsema and Treue, 2014). After the anthro-poid apes, Old World monkeys are the next closest relatives to humans (Stewart and Disotell, 1998). As well as being an excellent natural model for epilepsy (Killam, 1979; Szabo et al., 2011a, 2011b) baboons (Papio), an Old World monkey, possess several features that make them a particularly fruitful model for understanding human brain struc-ture and function (Black et al., 2009). A baboon brain, for example, is on average two times larger than the brain of a rhesus macaque (Macaca mulatta,Leigh, 2004)— one of the most common Old World monkeys found in laboratories. The baboon brain also has a larger degree of
gyrification (folding) than other Old World monkeys and contains all the primary cortical structures found in humans (Rogers et al., 2010). Accordingly, the baboon model has been used in numerous structural and functional neuroimaging experiments (e.g.,Kochunov et al., 2010a, 2010b; Kroenke et al., 2005, 2007; Liu et al., 2008; Miller et al., 2013; Phillips and Kochunov, 2011; Phillips et al., 2012; Rogers et al., 2007; Salinas et al., 2011; Szabo et al., 2007, 2011a, 2011b; Wey et al., 2013).
The application of multi-subject statistics to such neuroimaging ex-periments requires, in general, that images acquired in a participant's native-space be normalized to the standardized coordinate space of a template image. This process ensures, as accurately as the normalization algorithm allows, that the same coordinates within the space represent corresponding anatomical regions from each individual. This now standard practice increases statistical power, enables conclusions to be generalized to the population as a whole and facilitates the generaliz-ability and compargeneraliz-ability of results across studies.
Pioneering human neuroimaging work by Fox and colleagues (Fox et al., 1985) used an X-ray to objectively map PET activation sites to the Talairach space (Talairach et al., 1967). This technique was soon up-dated to use a T1-weighted (T1w) magnetic resonance imaging (MRI) scan instead of an X-ray (e.g.,Evans et al., 1992; Seitz et al., 1990). Due to the limitations caused by Talairach space being based on a single 60-year old female, this development also led to the creation of a new population-average template and an associated standard space (MNI
⁎ Correspondence to: Laboratoire de Psychologie Cognitive, UMR7290, Université Aix-Marseille/CNRS, 13331 Marseille, France.
⁎⁎ Correspondence to: CNRS, RD 56, 13790 Rousset, France. Tel:+ 33 4 42 99 24 59. Fax: +33 4 42 29 40 44.
E-mail addresses:[email protected](S.A. Love),
[email protected](A. Meguerditchian).
1
Authors contributed equally.
http://dx.doi.org/10.1016/j.neuroimage.2016.03.018
1053-8119/© 2016 Elsevier Inc. All rights reserved.
Contents lists available atScienceDirect
NeuroImage
space, Evans et al., 1993). While the MNI space continues to be extensively used and further developed (Evans et al., 2012) for some applications it is arguably not the most appropriate target space, for instance, an age-appropriate template is generally to be preferred in pe-diatric studies (Fonov et al., 2011; Sanchez et al., 2012; Wilke et al., 2002; Yoon et al., 2009).
The importance of non-human primate neuroimaging research also necessitated the creation of appropriate brain templates (Black
et al., 2001a, 2001b). The first non-human primate
population-average template was constructed from the T1w MRI images of nine olive baboons (Papio anubis,Black et al., 1997, 2001b) and was mapped to the Davis and Huffman (1968) baboon brain atlas. Since, template images for several non-human primate species have ben made available: the pig-tailed macaque (Macaca nemestrina, Black et al., 2001a), the rhesus macaque (Macaca mulatta, Frey et al., 2011; McLaren et al., 2009; Rohlfing et al., 2012), the Japanese macaque (Macaca fuscata,Quallo et al., 2010), the cynomolgus monkey (Macaca fascicularis,purl.org/net/kbmd/ cyno), the vervet monkey (Chlorocebus aethiops, Fedorov et al., 2011; Maldjian et al., 2014; Woods et al., 2011), the common mar-moset (Callithrix jacchus,Hikishima et al., 2011; Newman et al., 2009) and the olive baboon (Papio anubis,Black et al., 2001b; Greer et al., 2002). Recently, tissue probability maps have also been provid-ed with non-human primate brain templates (e.g.,Fedorov et al., 2011; Hikishima et al., 2011; McLaren et al., 2009; Rohlfing et al., 2012).
The existing baboon (Papio Anubis) templates were made avail-able almost 15 years ago (Black et al., 2001b,purl.org/net/kbmd/ b2k;Greer et al., 2002,sites.google.com/site/baboonmriatlas). Sev-eral factors warrant the creation of a new, updated and improved brain template in this species. First, a baboon template would ideally be created from a large number of individuals— in the existing templates the maximum number is 9. The larger the number and consequently the more heterogeneous the sample of animals used to create a template the better it represents the variability in brain morphometry within a species. Second, there have been significant improvements in the techniques used to coregister T1w MRI images, which is a critical component of template creation (Klein et al., 2009). Third, to our knowledge there is no currently available symmetric template image for the baboon. For both human and non-human primate brains, it is well known that there are differences in morphology across the two cerebral hemispheres (e.g.,Barrick et al., 2005; Pilcher et al., 2001). Symmetric templates are critical when investigating these hemispheric differences using, for example, voxel-based morphometry (VBM, Ashburner and Friston, 2000); normalization to an asymmetric template introduces a confound as it is impossible to conclude whether hemispheric dif-ferences are real or simply caused by normalization to an asymmet-ric template (Fonov et al., 2011; Pepe et al., 2014). Fourth, to our knowledge there are no tissue probability maps available to aid in the normalization or the segmentation of baboon brains. Finally, despite being an important and visibly protuberant brain region anteroinferior to the frontal lobe, the olfactory bulb is not present in theGreer et al. (2002)baboon template. Although present in the template ofBlack et al. (2001b), it is not encompassed by the brain mask provided by the authors.
For these reasons the current work aimed to produce both asym-metric and symasym-metric unbiased population-averaged T1w baboon (Papio anubis) brain templates and their associated gray matter, white matter and cerebrospinalfluid tissue probability maps primarily using the open source toolkit Advanced Normalization Tools (ANTs,http://
stnava.github.io/ANTs/; Avants et al., 2011a). ANTs has been
independently evaluated as containing one of the top performing regis-tration algorithms (Klein et al., 2009; Ou et al., 2014) and employs cur-rent best practice in template creation (Avants et al., 2010; Hopkins and Avants, 2013). In the current article, we detail the data and methods
used in the creation of these templates and associated tissue probability maps. The main template, Haiko89, inherited its name from the 100th baboon scanned in this project. Haiko was the oldest baboon of the so-cial group and passed away naturally before the end of the MRI project. Created entirely using freely available software, the templates are being made available to the scientific community to facilitate, for example, normalization to a standard coordinate space, skull stripping and tissue segmentation of individual baboon brains.
Materials and methods Animals
From the 106 olive baboons (Papio anubis) that underwent MR imaging, 89 were included in template creation (58 females and 31 males, age range = 2.4 to 26.4 years, mean age = 11.8 years [SD = 6 years]) while 17 were excluded due to large MRI artifacts. The baboons are housed at the Station de Primatologie CNRS (UPS 846, Rousset, France; Agreement number for conducting experiments on vertebrate animals: D13-087-7). All individuals live in social groups and have free access to outdoor areas connected to indoor areas. Enclosures are enriched by wooden platforms and vertical structures. Baboons are fed four times a day with monkey pellets, seed mixture, fresh vegetables and fruits. Water is available ad libitum. The exper-imental procedure complied with the current French laws and the European directive 86/609/CEE.
Imaging
In vivo imaging was performed with a 3 T whole-body imager MEDSPEC 30/80 ADVANCE (Bruker) located at the Marseille Functional MRI Center. Whole brain anatomical MRI data were acquired using a Rapid-Biomed surface antenna. High-resolution structural T1w images were acquired using one of two MPRAGE sequences depending on acquisition of a female/young male (TR: 9.4 ms; TE: 4.3 ms;flip angle: 30°; inversion time: 800 ms;field of view: 108 × 108 × 108 mm; isotro-pic voxel size: 0.6 mm3) or an adult male (same parameters except for
field of view: 126 × 126 × 126 mm, and isotropic voxel size: 0.7 mm3).
For each MRI session, premedication was realized with an intramus-cular injection of ketamine (10 mg/kg) at the Station de Primatologie and subjects remained sedated during transportation to the MRI center. On arrival at the MRI center, the focal subject was further sedated with an intramuscular injection of tiletamine and zolazepam (Zoletil™, 7 mg/kg) and acepromazine (Calmivet™, 0.2–0.5 mg/kg). The latter in-jection was needed to provoke a myorelaxation and avoid snoring or motion. Finally anesthesia was maintained thanks to a drip irrigation of tiletamine, zolazepam (Zoletil™, 4 mg/kg/h) and NaCl (0.9% of 4 ml/kg/h). Cardiovascular and respiratory functions were monitored with a SpO2device and a respiratory belt, respectively. Animals were
in ventral decubitus position within the scanner and the head was maintained with cushions and Velcro strips. After surveillance to make sure they were fully awake, recovered from anesthesia and in good health baboons were put back in their social group.
Image preprocessing
Images werefirst denoised using the Adaptive Nonlocal Means filter (ANLM,Manjón et al., 2010). Second, the freely available Multi Atlas Skull Stripping software (MASS,http://www.cbica.upenn.edu/sbia/ software/MASS/index.html;Doshi et al., 2013; Ou et al., 2011) was used to create skull stripping brain masks to remove any non-brain tis-sue. Briefly, MASS works by registering each image to multiple reference images, which also have accompanying optimal brain masks. The in-verse of these registration transformations are then applied to the reference brain masks to put them into the space of the original image. A spatially adaptive weighted voting strategy is then used to
combine these coregistered masks into an optimal skull stripping brain mask for the original image. Note thefinal step of the MASS procedure, removal of small separated clusters, was not used here as it regularly re-moved the olfactory bulb from the current sample of baboon images.
In the MASS procedure the reference images should be study-specific, i.e., from the study sample, and encompass the anatomical variations within the data set (e.g., different head orientations,field of view). In the current work, 10 study-specific reference images were selected from our data set using the ChooseTemplates function provided. This function conducts K-means clustering (K = 10) to identify images that represent the major anatomical variations in the study sample. All reference images were then manually skull stripped ITK-SNAP (version 3.2,www.itksnap. org,Yushkevich et al., 2006) before being used in the MASS procedure.
Finally, intensity inhomogeneities were corrected in the skull stripped images using the N4 algorithm (see Inline Supplementary Parameters 1,Tustison et al., 2010).
Inline Supplementary Parameters 1 can be found online athttp://dx. doi.org/10.1016/j.neuroimage.2016.03.018.
Template creation
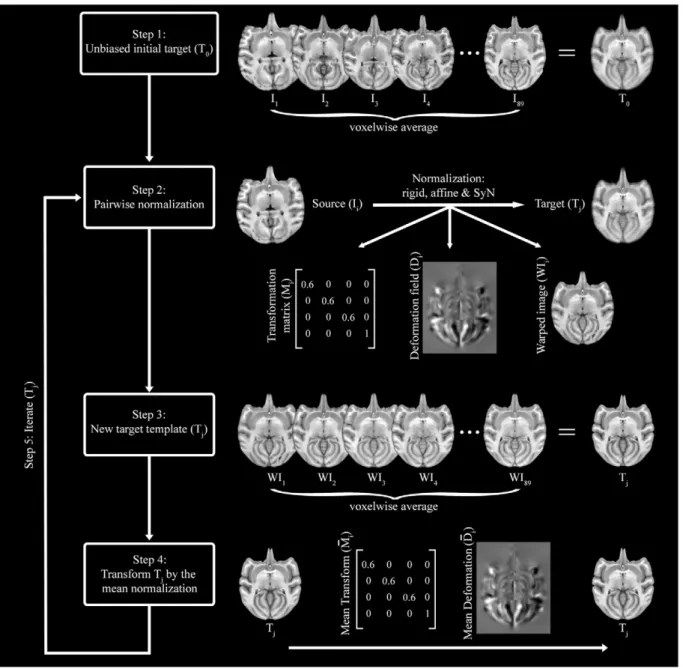
The skull stripped images were used to create optimal population-averaged templates that are unbiased in both shape and appearance using the symmetric group-wise normalization (SyGN) approach pro-vided by the ANTs toolkit (version: 2.1.post75-g58172,Avants and Gee, 2004; Avants et al., 2008, 2010). Briefly, the SyGN approach involves (Fig. 1):
1) Creating an initial target template by averaging the skull stripped images.
2) Pairwise normalization of each skull stripped image to the target template.
3) Create new target template by averaging the normalized images output during step 2.
4) Transform the new target template by the average affine transform and the average inverse warpfield multiplied by a scaling factor (0.25).
5) Iterate steps 2 to 4 until convergence: leveling of the root square mean difference between successive population-average template images output at step 4.
The normalization in step 2 comprised rigid, affine and diffeomorphic registration (symmetric normalization, SyN, see Inline Supplementary Parameters 2) steps. However, these successive
transformations werefinally composed and applied to the original input image in a single transform, which minimizes interpolation. Both symmetric and asymmetric optimal unbiased population-averaged templates were created in this way: the asymmetric template was created from the original 89 skull stripped images; the symmetric template was created from these 89 images plus their left/right mirror flipped versions, i.e., from 178 images total.
Fig. 2. Skull stripping. Illustration of skull stripping results from a randomly selected individual. Three axial and three sagittal slices are displayed from both before (top) and after (bottom) skull stripping. Slice numbers are in voxels.
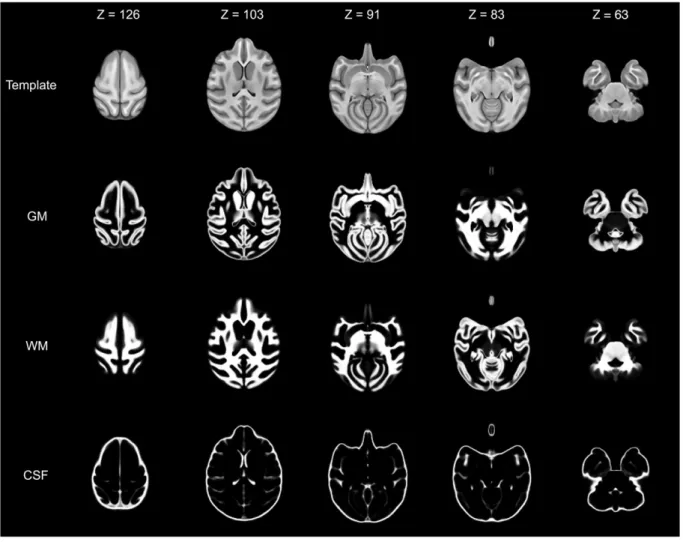
Fig. 3. Template and tissue probability maps. Five axial slices illustrate volume data from Haiko89 (first row), the gray matter (GM, second row), white matter (WM, third row) and cerebrospinalfluid (CSF, fourth row). Slice numbers are in voxels.
Inline Supplementary Parameters 2 can be found online athttp://dx. doi.org/10.1016/j.neuroimage.2016.03.018.
Tissue segmentation
Tissue probability maps were created using the segmentation algorithm, Atropos, distributed with ANTs (Avants et al., 2011b). Each skull stripped image was normalized (rigid, affine & diffeomorphic) to our population-average templates and then processed with the antsAtroposN4.sh pipeline: https://github.com/stnava/ANTs/blob/ master/Scripts/antsAtroposN4.sh. The pipeline was run twice: once using the symmetric template and once using the asymmetric template during normalization.
Briefly, this script alternates between intensity inhomogeneity correc-tion using the N4 algorithm and tissue segmentacorrec-tion using Atropos. Tissue segmentation was initialized using K-means clustering (K = 3) to seg-ment gray matter, white matter and cerebrospinalfluid. This initial seg-mentation was then used as spatial priors during subsequent prior-based segmentation, which is iterated (output of the current iteration be-come the priors of the next) until convergence, i.e., the posterior probabil-ity of the current iteration was less than that of the previous (seeAvants et al., 2011b). For each of the three tissue types this process produced a separate posterior probability map. These maps were then averaged across individuals separately for each tissue type to produce mean gray matter, white matter and cerebrospinalfluid tissue probability maps. Validation
Following procedures of template validation from previous studies, landmark distance measures were used to validate Haiko89 (Black et al., 2001a, 2001b; Ella and Keller, 2015; Hikishima et al., 2011; McLaren et al., 2009; Quallo et al., 2010).
Thirty randomly selected individual images were normalized to Haiko89. Two subcortical and two bilateral cortical landmarks were identified on each of these normalized images: middle of the anterior commissure, superior-most point of the posterior commissure, lateral-most point of the lateral sulcus and medial-lateral-most inflection point between the lower-bank of the superior temporal sulcus and the upper-bank of the middle temporal sulcus (see Inline Supplementary Figure S1). The 3D Euclidean distance between each of these landmarks and the equivalent landmarks in Haiko89 were calculated.
Inline Supplementary Fig. S1 can be found online athttp://dx.doi. org/10.1016/j.neuroimage.2016.03.018.
Results Skull stripping
Subjectively, the skull stripped images produced by MASS (Fig. 2) were appreciably better than those from the other methods tested (e.g., BET from FSL, http://fsl.fmrib.ox.ac.uk/fsl/fslwiki/; Jenkinson et al., 2012; Smith, 2002). While the skull stripping was of a very high quality, we still felt it necessary to inspect and to manually correct,
when necessary, every image. Approximately, 50% of the images re-quired no manual correction, 40% benefitted from very minor correction in the olfactory bulb and/or the anterior ventral temporal cortices. The final 10% required more substantial manual correction and benefitted from some parameter adjustment to thefinal mask thresholding proce-dure. In a preliminary test, 7 reference images were used; qualitatively we observed that increasing the number of reference images from 7 to 10 (the 2 amounts we tested) made appreciable improvements to the final brain masks and warranted the extra processing time.
Templates & tissue probability maps
Two unbiased population-averaged templates, one asymmetric (Haiko89, Figs. 3 & 4) and one symmetric (Haiko89_Sym), were successfully created using the procedures outlined in section 2.4. Highlighting the success and quality of the template creation procedure, Haiko89 (Fig. 3) displays increased contrast between gray and white matter than individual images (Fig. 2). Furthermore, there is enhanced delineation of anatomical structures in the template compared to indi-viduals. Tissue probability maps were also successfully created for gray matter, white matter and cerebrospinalfluid after normalization to the symmetric and asymmetric (Fig. 3) templates. Each voxel within a tissue probability map contains a value between 0 and 1 representing the average likelihood that that voxel represents the tissue type. Repre-sentative examples of the individual segmentations can be seen in Inline Supplementary Figure S2.
Inline Supplementary Fig. S2 can be found online athttp://dx.doi. org/10.1016/j.neuroimage.2016.03.018.
Template validation
The high accuracy of spatially normalizing individuals to Hiako89 can be seen subjectively in Inline Supplementary Figure S3. The mean error of all objectively tested landmarks was 0.54 mm and the maxi-mum error for any landmark from any individual tested was 1.45 mm (Table 1). Overall the variation between a landmark's location in Haiko89 and in the normalized individuals was consistent with similar measurements in marmosets (Hikishima et al., 2011) and noticeably smaller than those from macaques and baboons (Black et al., 2001a, 2001b; McLaren et al., 2009).
Inline Supplementary Fig. S3 can be found online athttp://dx.doi. org/10.1016/j.neuroimage.2016.03.018.
Image format, coordinates and orientation
Both templates and the tissue probability maps are being made pub-licly available under the CC BY-NC-SA creative common licence and can be downloaded here: http://www.nitrc.org/projects/haiko89/ and
http://lpc.univ-amu.fr/spip.php?article589.
All images are provided in the NIfTI-1 format and the intensity data are stored within a 180 × 180 × 180 grid in RAS index order, i.e. the fastest varying index (i) corresponds to the left-to-right anatomical
Fig. 4. Haiko89 surface. Right, Left, and top views of the surface rendering of Haiko89. Images were created using MRIcroGL v11 (http://www.mccauslandcenter.sc.edu/ mricrogl/).
Table 1
Landmark error (Euclidean distance between Haiko89 and individuals).
Landmark Mean (SD) Max
AC 0 0 PC 0.09 (0.23) 0.85 L. lLs 0.69 (0.27) 1.04 R. lLs 0.81 (0.28) 1.34 L. mSMTs 1.03 (0.29) 1.45 R. mSMTs 0.64 (0.36) 1.34 AC, anterior commissure; PC, posterior commissure; lLs, lateral-most point of the lateral sul-cus; mSMTs, medial-most inflection point between the lower-bank of the superior temporal sulcus and the upper-bank of the middle temporal sulcus; all values are in millimeters.
direction (x), the second fastest (j) to the posterior-to-anterior direction (y) and the third (k) to the inferior-to-superior direction (z). Each voxel is 0.6 mm isotropic in size. To create a standard anatomical coordinate system similar to the Talairach and MNI spaces the mid-plane of the image grid coincides with the anatomical midsagittal plane of the tem-plate, the origin of the template was set to coincide with the center of the anterior commissure (AC) and the superior-most point of the posterior commissure (PC) lies on the same axial plane as AC (Fig. 5). Like in the Talairach and MNI spaces, this enables the AC to be used as the origin (x = 0, y = 0, z = 0 mm) of the standard anatomical space (Fig. 5).
Discussion
The main aim of the current work was to construct and make freely available an updated and improved olive baboon brain MRI template. The resulting T1w population-average brain template, Haiko89 (Fig. 3), encompasses best practice in template creation and notable im-provements over currently available baboon templates.
The large sample of baboon brain images used in the construction of Haiko89 ensures that the template encapsulates the intraspecies vari-ability in baboon brain morphometry. Thanks to the large sample size and the initial target image chosen (seeTemplate creationsection
Fig. 1), the template is not biased towards the brain morphometry of an individual. Coupling a large population of individuals with the state-of-the-art SyGN template creation technique (Avants et al., 2010) produced a brain template that reaches the standard of modern human templates (e.g.,Fonov et al., 2011). Thefirst gray matter, white matter and cerebrospinalfluid tissue probability maps of the baboon brain were also produced using the entire sample of baboon brains and a cutting-edge automatic tissue segmentation algorithm (Avants et al., 2011b). They can be used, for example, as priors during tissue seg-mentation or to mask functional MRI analysis to only gray matter. Haiko89 is also accompanied with thefirst symmetric baboon brain template (Haiko89_Sym), which provides researchers with the means to conduct voxel-based brain lateralization research in the baboon that is free from the confound created by normalizing to an asymmetric template (Fonov et al., 2011; Pepe et al., 2014). Furthermore, Haiko89 is the only available skull stripped baboon brain template that includes the olfactory bulb.
A recent review highlights the important role that the olfactory bulb plays in helping to understand not only olfaction but how the brain develops and functions in general (Imai, 2014). In the human brain the olfactory bulb is situated underneath the anterior frontal
lobe, whereas in non-human primates it can be the most anterior part of the brain, protruding inferiorly and slightly beyond the fron-tal lobe. The olfactory bulb is often absent in skull stripped non-human primate MRI templates (Black et al., 2001b; Greer et al., 2002; McLaren et al., 2009; Rohlfing et al., 2012). A clear example of this can be seen in Fig. 8 ofRohlfing et al., 2012, which highlights both the absence of the olfactory bulb in their rhesus macaque brain template as well as its presence in the NeuroMaps (http:// braininfo.rprc.washington.edu/TemplateNeuroMaps.aspx) labeling, which is in register with the template.
In the current work, the region posed many challenges, in particular during skull stripping— our initial attempts (e.g., using BET from FSL) consistently removed the olfactory bulb. Even ourfirst attempts at re-moving non-brain tissue with the MASS procedure removed the olfacto-ry bulb. Thefinal step of the MASS procedure is the removal of small separated clusters from the brain mask and it was mainly this step that removed the olfactory bulb; omission of it resulted in the olfactory bulb being retained in the brain mask. From this experience we can speculate that the olfactory bulb is often removed accidently during skull stripping or indeed purposefully to simplify skull stripping and image registration. Here we demonstrate that it is possible to preserve this important brain region in a population-average MRI template. Limitations, concerns and future directions
A comprehensive labeling of the neuroanatomical structures contained within Haiko89 does not yet exist. The baboon template of-fered byBlack et al. (2001b)was placed in correspondence with the
Davis and Huffman (1968)photomicrographic atlas; however, this
atlas focuses on subcortical regions and contains little labeling of the cortex.Greer et al. (2002)gave neuroanatomical labels to hand drawn outlines of several regions of their baboon template. This labeling is available as .jpg images with 5 mm spacing:https://sites.google.com/ site/baboonmriatlas/home/labeled-slices. Haiko89 can be normalized to these templates to facilitate the use of their labeling schemes; howev-er, neither of these labeling options approach the standard of modern options for the macaque brain (e.g.,Rohlfing et al., 2012).
Ideally, an MRI template would be comprised of an equal proportion of male and female images. However, unequal proportions of females and males are fairly common in large-sample human (e.g., 21% females inEvans et al., 1993) and non-human primate templates (e.g., 27% fe-males inMcLaren et al., 2009). The current sample of baboon images contained a larger proportion of females (65%) than males. We chose to use the entire sample when creating Haiko89 so as to include the greatest possible intraspecies variability in the template. That said we appreciate that certain research questions necessitate the use of a tem-plate comprised of an equal number of males and females. Hence, we also make available, Haiko62_MF, which was created using an equal number of male (31) and randomly selected female (31) images.
The majority of our early MRI sessions involved female participants. MRI parameters were defined on these scans and were thus inadver-tently optimized for females. Unfortunately, there are large differences in the size of the muscle surrounding the skull between males and fe-males. Increased muscle size in older males led to wrapping artifacts when using the initially defined voxel size and field of view. Hence, it was necessary to increase voxel size andfield of view to overcome this artifact for the older males. While this should have no appreciable impact on the current templates it is still of concern.
Van Essen and Dierker (2007)highlighted the benefits of providing a surface-based template alongside a volume-based template. Future work will focus on producing a surface-based population-average ba-boon brain template to complement Haiko89. Similarly, a complemen-tary diffusion tensor baboon brain template would facilitate group-level voxelwise investigation of white matter organization and cortical microstructure (Adluru et al., 2012; Kroenke et al., 2007). Furthermore, the usefulness of age-specific brain templates, i.e., templates comprised
Fig. 5. Talairach-like standardized space. The proposed standardized anatomical coordinate system for the baboon brain. The origin (x = 0, y = 0, z = 0) of the space corresponds anatomically to the middle of the AC. Left (−) to right (+) is represented by the x coordinate, posterior (−) to anterior (+) by the y coordinate and inferior (−) to superior (+) by the z coordinate. AC, anterior commissure; PC, posterior commissure; I, inferior; S, superior; P, posterior; and A, anterior.
only of individuals spanning a relatively narrow age range, has been dem-onstrated in humans. Specifically, normalizing MRI images of human in-fant brains to adult based templates is less accurate than when an infant based template is used (Fillmore et al., 2015; Fonov et al., 2011; Sanchez et al., 2012; Wilke et al., 2002; Yoon et al., 2009). To our knowl-edge there has been no investigation of the usefulness of age-specific templates for any non-human primate species. Neither has there been any study for any species as to whether normalizing to a template created from animals covering the entire lifespan of the species, i.e., a true aver-age, age-general template, is more or less accurate than age-specific tem-plates. In the current work, so as to include the greatest possible intraspecies variability, Haiko89 was created from a large sample of indi-viduals spanning a wide range of the baboon lifespan (2.4 to 26.4 years). However, we also provide a template (Haiko67_A) that was created using only images from animals seven years and older, highly likely to have reached structural maturity of the cortex (Mahaney et al., 1993). Future work should create and investigate the consequences of using age-specific and age-general MRI baboon brain templates.
Conclusions
The current work describes the collection of T1w MRI images from a large sample of 89 individual baboons. Using state-of-the-art, freely available software tools this data was used to create an updated and im-proved population-average baboon brain template. The template, termed Haiko89, is being made freely available within a collection of 3D MRI images:http://www.nitrc.org/projects/haiko89/andhttp:// lpc.univ-amu.fr/spip.php?article589. Notably, the collection also con-tains gray matter, white matter and cerebrospinalfluid tissue probabil-ity maps, a symmetric version of the template (Haiko89_Sym), a template that contains an equal number of males and females (Haiko62_MF) as well as a template of adult baboons over 7 years old (Haiko67_A). To facilitate the generalizability and comparability of re-sults across studies Haiko89 is proposed as a Talairach-like standardized anatomical coordinate space with its origin set at the anterior commis-sure. It can also be used as the target image during normalization of in-dividuals to this space, enabling the use of voxelwise multi-subject statistics. Additionally, the tissue probability maps can be used as priors to improve the segmentation of new imaging data.
Acknowledgments
We are very grateful to the Station de Primatologie CNRS, particular-ly the animal care staff and technicians, Noël Benoit, Jean-Christophe Marin, Valérie Moulin, Fidji and Richard Francioly, Laurence Boes, Célia Sarradin, Brigitte Rimbaud, Sebastien Guiol, Georges Di Grandi for their critical involvement in this project, the administration staff Laura Desmis, Frederic Lombardo and Colette Pourpe, the vets Ivan Balansard and Sandrine Melot-Dusseau for additional help. This re-search complied with the European Directive 2010/63/EU and was sup-ported by the French“Agence Nationale de le Recherche” (LangPrimate Project, P.I. Adrien Meguerditchian: ANR-12-PDOC-0014-01). References
Adluru, N., Zhang, H., Fox, A.S., Shelton, S.E., Ennis, C.M., Bartosic, A.M., Oler, J.A., Tromp, D.P.M., Zakszewski, E., Gee, J.C., Kalin, N.H., Alexander, A.L., 2012. A diffusion tensor brain template for rhesus macaques. NeuroImage 59, 306–318.http://dx.doi.org/10. 1016/j.neuroimage.2011.07.029.
Ashburner, J., Friston, K.J., 2000. Voxel-based morphometry— the methods. NeuroImage 11, 805–821.http://dx.doi.org/10.1006/nimg.2000.0582.
Avants, B.B., Gee, J.C., 2004. Geodesic estimation for large deformation anatomical shape averaging and interpolation. NeuroImage 23, 139–150.http://dx.doi.org/10.1016/j. neuroimage.2004.07.010.
Avants, B.B., Epstein, C.L., Grossman, M., Gee, J.C., 2008. Symmetric diffeomorphic image registration with cross-correlation: evaluating automated labeling of elderly and neu-rodegenerative brain. Med. Image Anal. 12, 26–41.http://dx.doi.org/10.1016/j.media. 2007.06.004.
Avants, B.B., Yushkevich, P.A., Pluta, J., Minkoff, D., Korczykowski, M., Detre, J., Gee, J.C., 2010. The optimal template effect in hippocampus studies of diseased populations. NeuroImage 49, 2457–2466.http://dx.doi.org/10.1016/j.neuroimage.2009.09.062. Avants, B.B., Tustison, N.J., Song, G., Cook, P.A., Klein, A., Gee, J.C., 2011a. A reproducible
evaluation of ANTs similarity metric performance in brain image registration. NeuroImage 54, 2033–2044.http://dx.doi.org/10.1016/j.neuroimage.2010.09.025. Avants, B.B., Tustison, N.J., Wu, J., Cook, P.A., Gee, J.C., 2011b. An open source multivariate
framework for N-tissue segmentation with evaluation on public data. Neuroinformatics 9, 381–400.http://dx.doi.org/10.1007/s12021-011-9109-y. Barrick, T.R., Mackay, C.E., Prima, S., Maes, F., Vandermeulen, D., Crow, T.J., Roberts, N.,
2005. Automatic analysis of cerebral asymmetry: an exploratory study of the rela-tionship between brain torque and planum temporale asymmetry. NeuroImage 24, 678–691.http://dx.doi.org/10.1016/j.neuroimage.2004.09.003.
Belmonte, J.C.I., Callaway, E.M., Churchland, P., Caddick, S.J., Feng, G., Homanics, G.E., Lee, K.-F., Leopold, D.A., Miller, C.T., Mitchell, J.F., Mitalipov, S., Moutri, A.R., Movshon, J.A., Okano, H., Reynolds, J.H., Ringach, D., Sejnowski, T.J., Silva, A.C., Strick, P.L., Wu, J., Zhang, F., 2015. Brains, genes, and primates. Neuron 86, 617–631.http://dx.doi.org/ 10.1016/j.neuron.2015.03.021.
Black, K.J., Gado, M.H., Videen, T.O., Perlmutter, J.S., 1997. Baboon basal ganglia stereotaxy using internal MRI landmarks: validation and application to PET imaging. J. Comput. Assist. Tomogr. 21, 881–886.http://dx.doi.org/10.1097/00004728-199711000-00006. Black, K.J., Koller, J.M., Snyder, A.Z., Perlmutter, J.S., 2001a. Template images for nonhuman
primate neuroimaging: 2. Macaque. NeuroImage 14, 744–748.http://dx.doi.org/10. 1006/nimg.2001.0871.
Black, K.J., Snyder, A.Z., Koller, J.M., Gado, M.H., Perlmutter, J.S., 2001b. Template images for nonhuman primate neuroimaging: 1. Baboon. NeuroImage 14, 736–743.http:// dx.doi.org/10.1006/nimg.2001.0752.
Black, K.J., Hershey, T., Moerlein, S.M., Perlmutter, J.S., 2009.Neuroimaging in Baboons. In: VandeBerg, J., Williams-Blangero, S., Tardif, S. (Eds.), The Baboon in Biomedical Re-search, Developments in Primatology: Progress and Prospects. Springer, New York, pp. 327–350.
Davis, R., Huffman, R.D., 1968.Stereotaxic Atlas of the Brain of the Baboon. University of Texas Press, Austin, TX.
Doshi, J., Erus, G., Ou, Y., Gaonkar, B., Davatzikos, C., 2013. Multi-atlas skull-stripping. Acad. Radiol. 20, 1566–1576.http://dx.doi.org/10.1016/j.acra.2013.09.010. Ella, A., Keller, M., 2015. Construction of an MRI 3D high resolution sheep brain template.
Magn. Reson. Imaging 1–9http://dx.doi.org/10.1016/j.mri.2015.09.001.
Evans, A.C., Marrett, S., Neelin, P., Collins, L., Worsley, K., Dai, W., Milot, S., Meyer, E., Bub, D., 1992.Anatomical mapping of functional activation in stereotactic coordinate space. NeuroImage 1, 43–53 (1053-8119(92)90006-9 [pii]).
Evans, A.C., Collins, D.L., Mills, S.R., Brown, E.D., Kelly, R.L., Peters, T.M., 1993. 3D statistical neuroanatomical models from 305 MRI volumes. Proc. IEEE Nucl. Sci. Symp. Med. Im-aging Conf. 1813–1817http://dx.doi.org/10.1109/NSSMIC.1993.373602.
Evans, A.C., Janke, A.L., Collins, D.L., Baillet, S., 2012. Brain templates and atlases. NeuroImage 62, 911–922.http://dx.doi.org/10.1016/j.neuroimage.2012.01.024. Fedorov, A., Li, X., Pohl, K.M., Bouix, S., Styner, M., Addicott, M., Wyatt, C., Daunais, J.B.,
Wells, W.M., Kikinis, R., 2011. Atlas-guided segmentation of vervet monkey brain MRI. Open Neuroimaging J.http://dx.doi.org/10.2174/1874440001105010186. Fillmore, P.T., Phillips-Meek, M.C., Richards, J.E., 2015. Age-specific MRI brain and head
templates for healthy adults from 20 through 89 years of age. Front. Aging Neurosci. 7, 1–14.http://dx.doi.org/10.3389/fnagi.2015.00044.
Fonov, V.S., Evans, A.C., Botteron, K., Almli, C.R., McKinstry, R.C., Collins, D.L., 2011. Unbi-ased average age-appropriate atlases for pediatric studies. NeuroImage 54, 313–327.http://dx.doi.org/10.1016/j.neuroimage.2010.07.033.
Fox, P.T., Perlmutter, J.S., Raichle, M.E., 1985. A stereotactic method of anatomical localiza-tion for positron emission tomography. J. Comput. Assist. Tomogr.http://dx.doi.org/ 10.1097/00004728-198501000-00025.
Frey, S., Pandya, D.N., Chakravarty, M.M., Bailey, L., Petrides, M., Collins, D.L., 2011. An MRI based average macaque monkey stereotaxic atlas and space (MNI monkey space). NeuroImage 55, 1435–1442.http://dx.doi.org/10.1016/j.neuroimage.2011.01.040. Greer, P.J., Villemagne, V.L., Ruszkiewicz, J., Graves, A.K., Meltzer, C.C., Mathis, C.A., Price,
J.C., 2002.MR atlas of the baboon brain for functional neuroimaging. Brain Res. Bull. 58, 429–438.
Hikishima, K., Quallo, M.M., Komaki, Y., Yamada, M., Kawai, K., Momoshima, S., Okano, H.J., Sasaki, E., Tamaoki, N., Lemon, R.N., Iriki, A., Okano, H., 2011. Population-averaged standard template brain atlas for the common marmoset (Callithrix jacchus). NeuroImage 54, 2741–2749.http://dx.doi.org/10.1016/j.neuroimage.2010.10.061.
Hopkins, W.D., Avants, B.B., 2013. Regional and hemispheric variation in cortical thickness in chimpanzees (Pan troglodytes). J. Neurosci. 33, 5241–5248.http://dx.doi.org/10. 1523/JNEUROSCI.2996-12.2013.
Imai, T., 2014. Construction of functional neuronal circuitry in the olfactory bulb. Semin. Cell Dev. Biol. 35, 180–188.http://dx.doi.org/10.1016/j.semcdb.2014.07.012. Jenkinson, M., Beckmann, C.F., Behrens, T.E.J., Woolrich, M.W., Smith, S.M., 2012. Fsl.
NeuroImage 62, 782–790.http://dx.doi.org/10.1016/j.neuroimage.2011.09.015. Killam, E.K., 1979.Photomyoclonic seizures in the baboon, Papio papio. Fed. Proc. 38,
2429–2433.
Klein, A., Andersson, J., Ardekani, B.A., Ashburner, J., Avants, B.B., Chiang, M.-C., Christensen, G.E., Collins, D.L., Gee, J., Hellier, P., Song, J.H., Jenkinson, M., Lepage, C., Rueckert, D., Thompson, P., Vercauteren, T., Woods, R.P., Mann, J.J., Parsey, R.V., 2009. Evaluation of 14 nonlinear de-formation algorithms applied to human brain MRI registration. NeuroImage 46, 786–802.
http://dx.doi.org/10.1016/j.neuroimage.2008.12.037.
Kochunov, P.V., Castro, C., Davis, D., Dudley, D., Brewer, J., Zhang, Y., Kroenke, C.D., Purdy, D., Fox, P.T., Simerly, C., Schatten, G., 2010a. Mapping primary gyrogenesis during fetal development in primate brains: high-resolution in utero structural MRI of fetal brain development in pregnant baboons. Front. Neurosci. 4, 1–11.http://dx.doi.org/ 10.3389/fnins.2010.00020.
Kochunov, P.V., Glahn, D.C., Fox, P.T., Lancaster, J.L., Saleem, K., Shelledy, W., Zilles, K., Thompson, P.M., Coulon, O., Mangin, J.F., Blangero, J., Rogers, J., 2010b. Genetics of pri-mary cerebral gyrification: heritability of length, depth and area of pripri-mary sulci in an extended pedigree of Papio baboons. NeuroImage 53, 1126–1134.http://dx.doi.org/ 10.1016/j.neuroimage.2009.12.045.
Kroenke, C.D., Bretthorst, G.L., Inder, T.E., Neil, J.J., 2005. Diffusion MR imaging character-istics of the developing primate brain. NeuroImage 25, 1205–1213.http://dx.doi.org/ 10.1016/j.neuroimage.2004.12.045.
Kroenke, C.D., Van Essen, D.C., Inder, T.E., Rees, S., Bretthorst, G.L., Neil, J.J., 2007. Micro-structural changes of the baboon cerebral cortex during gestational development reflected in magnetic resonance imaging diffusion anisotropy. J. Neurosci. 27, 12506–12515.http://dx.doi.org/10.1523/JNEUROSCI.3063-07.2007.
Leigh, S.R., 2004. Brain growth, life history, and cognition in primate and human evolu-tion. Am. J. Primatol. 62, 139–164.http://dx.doi.org/10.1002/ajp.20012.
Liu, F., Garland, M., Duan, Y., Stark, R.I., Xu, D., Dong, Z., Bansal, R., Peterson, B.S., Kangarlu, A., 2008. Study of the development of fetal baboon brain using magnetic resonance imaging at 3 Tesla. NeuroImage 40, 148–159. http://dx.doi.org/10.1016/j. neuroimage.2007.11.021.
Mahaney, M.C., Leland, M.M., Williams-Blangero, S., Marinez, Y.N., 1993.Cross-sectional growth standards for captive baboons: I. Organ weight by chronological age. J. Med. Primatol. 22, 400–414.
Maldjian, J.A., Daunais, J.B., Friedman, D.P., Whitlow, C.T., 2014. Vervet MRI atlas and label map for fully automated morphometric analyses. Neuroinformatics 12.http://dx.doi. org/10.1007/s12021-014-9231-8(543–500).
Manjón, J.V., Coupé, P., Martí-Bonmatí, L., Collins, D.L., Robles, M., 2010. Adaptive non-local means denoising of MR images with spatially varying noise levels. J. Magn. Reson. Imaging 31, 192–203.http://dx.doi.org/10.1002/jmri.22003.
McLaren, D.G., Kosmatka, K.J., Oakes, T.R., Kroenke, C.D., Kohama, S.G., Matochik, J.A., Ingram, D.K., Johnson, S.C., 2009. A population-average MRI-based atlas collection of the rhesus macaque. NeuroImage 45, 52–59. http://dx.doi.org/10.1016/j. neuroimage.2008.10.058.
Miller, B., Marks, L.A., Koller, J.M., Newman, B.J., Bretthorst, G.L., Black, K.J., 2013. Prolactin and fMRI response to SKF38393 in the baboon. PeerJ 1, e195.http://dx.doi.org/10. 7717/peerj.195.
Newman, J.D., Kenkel, W.M., Aronoff, E.C., Bock, N.A., Zametkin, M.R., Silva, A.C., 2009. A combined histological and MRI brain atlas of the common marmoset monkey, Callithrix jacchus. Brain Res. Rev.http://dx.doi.org/10.1016/j.brainresrev.2009.09.001. Ou, Y., Sotiras, A., Paragios, N., Davatzikos, C., 2011. DRAMMS: deformable registration via attribute matching and mutual-saliency weighting. Med. Image Anal. 15, 622–639.
http://dx.doi.org/10.1016/j.media.2010.07.002.
Ou, Y., Akbari, H., Bilello, M., Da, X., Davatzikos, C., 2014. Comparative evaluation of regis-tration algorithms in different brain databases with varying difficulty: results and in-sights. IEEE Trans. Med. Imaging 0062, 1–29.http://dx.doi.org/10.1109/TMI.2014. 2330355.
Pepe, A., Dinov, I., Tohka, J., 2014. An automatic framework for quantitative validation of voxel based morphometry measures of anatomical brain asymmetry. NeuroImage 100, 444–459.http://dx.doi.org/10.1016/j.neuroimage.2014.06.029.
Phillips, K.A., Kochunov, P.V., 2011. Tracking development of the corpus callosum in fetal and early postnatal baboons using magnetic resonance imaging. Open Neuroimaging J. 5, 179–185.http://dx.doi.org/10.2174/1874440001105010179.
Phillips, K.A., Rogers, J., Barrett, E.A., Glahn, D.C., Kochunov, P.V., 2012. Genetic contribu-tions to the midsagittal area of the corpus callosum. Twin Res. Hum. Genet.http:// dx.doi.org/10.1017/thg.2012.10.
Pilcher, D.L., Hammock, E.A.D., Hopkins, W.D., 2001. Cerebral volumetric asymmetries in non-human primates: a magnetic resonance imaging study. Laterality 6, 165–179.
http://dx.doi.org/10.1080/13576500042000124.
Quallo, M.M., Price, C.J., Ueno, K., Asamizuya, T., Cheng, K., Lemon, R.N., Iriki, A., 2010. Cre-ating a population-averaged standard brain template for Japanese macaques (M. fuscata). NeuroImage 52, 1328–1333.http://dx.doi.org/10.1016/j.neuroimage. 2010.05.006.
Roelfsema, P.R., Treue, S., 2014. Basic neuroscience research with nonhuman primates: a small but indispensable component of biomedical research. Neuron 82, 1200–1204.
http://dx.doi.org/10.1016/j.neuron.2014.06.003.
Rogers, J., Kochunov, P.V., Lancaster, J., Shelledy, W., Glahn, D., Blangero, J., Fox, P., 2007. Heritability of brain volume, surface area and shape: an MRI study in an extended
pedigree of baboons. Hum. Brain Mapp. 28, 576–583.http://dx.doi.org/10.1002/ hbm.20407.
Rogers, J., Kochunov, P.V., Zilles, K., Shelledy, W., Lancaster, J., Thompson, P., Duggirala, R., Blangero, J., Fox, P.T., Glahn, D.C., 2010. On the genetic architecture of cortical folding and brain volume in primates. NeuroImage 53, 1103–1108.http://dx.doi.org/10. 1016/j.neuroimage.2010.02.020.
Rohlfing, T., Kroenke, C.D., Sullivan, E.V., Dubach, M.F., Bowden, D.M., Grant, K.A., Pfefferbaum, A., 2012. The INIA19 template and NeuroMaps atlas for primate brain image parcellation and spatial normalization. Front. Neuroinformatics 6, 27.http:// dx.doi.org/10.3389/fninf.2012.00027.
Salinas, F.S., Szabo, C.A., Zhang, W., Jones, L., Leland, M.M., Wey, H.-Y., Duong, T.Q., Fox, P.T., Narayana, S., 2011. Functional neuroimaging of the baboon during concurrent image-guided transcranial magnetic stimulation. NeuroImage 57, 1393–1401.
http://dx.doi.org/10.1016/j.neuroimage.2011.05.065.
Sanchez, C.E., Richards, J.E., Almli, C.R., 2012. Age-specific MRI templates for pediatric neu-roimaging. Dev. Neuropsychol. 37, 379–399.http://dx.doi.org/10.1080/87565641. 2012.688900.
Seitz, R.J., Bohm, C., Greitz, T., Roland, P.E., Eriksson, L., Blomqvist, G., Rosenqvist, G., Nordell, B., 1990. Accuracy and precision of the computerized brain atlas programme for localization and quantification in positron emission tomography. J. Cereb. Blood Flow Metab. 10, 443–457.http://dx.doi.org/10.1038/jcbfm.1990.87.
Smith, S.M., 2002. Fast robust automated brain extraction. Hum. Brain Mapp. 17, 143–155.http://dx.doi.org/10.1002/hbm.10062.
Stewart, C.-B., Disotell, T.R., 1998. Primate evolution— in and out of Africa. Curr. Biol.
http://dx.doi.org/10.1016/S0960-9822(99)80350-9.
Szabo, C.A., Narayana, S., Kochunov, P.V., Franklin, C., Knape, K., Davis, M.D., Fox, P.T., Leland, M.M., Williams, J.T., 2007. PET imaging in the photosensitive baboon: case-controlled study. Epilepsia 48, 245–253.http://dx.doi.org/10.1111/j.1528-1167. 2006.00949.x.
Szabo, C.A., Kochunov, P.V., Knape, K.D., McCoy, K.J.M., Leland, M.M., Lancaster, J.L., Fox, P.T., Williams, J.T., Rogers, J., 2011a. Cortical sulcal areas in baboons (Papio hamadryas spp.) with generalized interictal epileptic discharges on scalp EEG. Epilepsy Res. 93, 91–95.http://dx.doi.org/10.1016/j.eplepsyres.2010.10.016.
Szabo, C.A., Salinas, F.S., Narayana, S., 2011b. Functional PET evaluation of the photosensi-tive baboon. Open Neuroimaging J. 5, 206–215. http://dx.doi.org/10.2174/ 1874440001105010206.
Talairach, J., Szikla, G., Tournoux, P., Prossalentis, A., Bordas-Ferrer, M., Covello, L., Iacob, M., Mempel, E., 1967.Atlas D'anatomie Stereotaxique Du Telencephale. Masson, Paris.
Tustison, N.J., Avants, B.B., Cook, P.A., Zheng, Y., Egan, A., Yushkevich, P.A., Gee, J.C., 2010. N4ITK: improved N3 bias correction. IEEE Trans. Med. Imaging 29, 1310–1320.http:// dx.doi.org/10.1109/TMI.2010.2046908.
Van Essen, D.C., Dierker, D.L., 2007. Surface-based and probabilistic atlases of primate cere-bral cortex. Neuron 56, 209–225.http://dx.doi.org/10.1016/j.neuron.2007.10.015. Wey, H.-Y., Phillips, K.A., McKay, D.R., Laird, A.R., Kochunov, P.V., Davis, M.D., Glahn, D.C.,
Duong, T.Q., Fox, P.T., 2013. Multi-region hemispheric specialization differentiates human from nonhuman primate brain function. Brain Struct. Funct. 2187–2194
http://dx.doi.org/10.1007/s00429-013-0620-9.
Wilke, M., Schmithorst, V.J., Holland, S.K., 2002. Assessment of spatial normalization of whole-brain magnetic resonance images in children. Hum. Brain Mapp. 17, 48–60.
http://dx.doi.org/10.1002/hbm.10053.
Woods, R.P., Fears, S.C., Jorgensen, M.J., Fairbanks, L.A., Toga, A.W., Freimer, N.B., 2011. A web-based brain atlas of the vervet monkey, Chlorocebus aethiops. NeuroImage 54, 1872–1880.http://dx.doi.org/10.1016/j.neuroimage.2010.09.070.
Yoon, U., Fonov, V.S., Perusse, D., Evans, A.C., 2009. The effect of template choice on mor-phometric analysis of pediatric brain data. NeuroImage 45, 769–777.http://dx.doi. org/10.1016/j.neuroimage.2008.12.046.
Yushkevich, P.A., Piven, J., Hazlett, H.C., Smith, R.G., Ho, S., Gee, J.C., Gerig, G., 2006. User-guided 3D active contour segmentation of anatomical structures: significantly im-proved efficiency and reliability. NeuroImage 31, 1116–1128.http://dx.doi.org/10. 1016/j.neuroimage.2006.01.015.