HAL Id: hal-03170996
https://hal.archives-ouvertes.fr/hal-03170996
Submitted on 16 Mar 2021
HAL is a multi-disciplinary open access
archive for the deposit and dissemination of
sci-entific research documents, whether they are
pub-lished or not. The documents may come from
teaching and research institutions in France or
abroad, or from public or private research centers.
L’archive ouverte pluridisciplinaire HAL, est
destinée au dépôt et à la diffusion de documents
scientifiques de niveau recherche, publiés ou non,
émanant des établissements d’enseignement et de
recherche français ou étrangers, des laboratoires
publics ou privés.
Lumbar spine discs classification based on deep
convolutional neural networks using axial view MRI
Wafa Mbarki, Moez Bouchouicha, Sebastien Frizzi, Frederick Tshibasu, Leila
Farhat, Mounir Sayadi
To cite this version:
Wafa Mbarki, Moez Bouchouicha, Sebastien Frizzi, Frederick Tshibasu, Leila Farhat, et al.. Lumbar
spine discs classification based on deep convolutional neural networks using axial view MRI.
Interdis-ciplinary Neurosurgery, 2020, 22, �10.1016/j.inat.2020.100837�. �hal-03170996�
Contents lists available atScienceDirect
Interdisciplinary Neurosurgery
journal homepage:www.elsevier.com/locate/inatResearch Article
Lumbar spine discs classi
fication based on deep convolutional neural
networks using axial view MRI
Wafa Mbarki
a,b,⁎, Moez Bouchouicha
c, Sebastien Frizzi
c,f, Frederick Tshibasu
d, Leila Ben Farhat
e,
Mounir Sayadi
aaLaboratoire Signal, Image et Maitrise de l'Energie(SIME), ENSIT, Université de Tunis, Tunis, Tunisie bUniversité de Sousse, ENISO, Tunisia
cAix Marseille Univ, Université de Toulon, CNRS, LIS, Toulon, France dCliniques Universitaires de Kinshasa, République Démocratique deu Congo eService Imagerie Mdicale, Mongi Slim Hospital, La Marsa, Tunisia
fUniversité de Toulon, Département Génie Biologie-IUT, 83957 La Garde, France
A B S T R A C T
Axial Lumbar disc herniation recognition is a difficult task to achieve, due to many challenges such as complex background, noise, blurry image. Lumbar discs are small joints that lie between each two vertebrae (L1-L2, L2-L3, L3-L4, L4-L5 and L5-S1). The segmentation and localization of the different discs are the most important tasks in Computer aided diagnosing of herniation. During the lastfive years, deep learning based methods have set new standards for many computer vision and pattern recognition research. In this work, our objective is to develop an automatic system based on deep convolutional neural network. This Network processes the input MRI (Magnetic Resonance Imaging) in multiple scales of context and then merges the high-level features to enhance the capability of the network to detect discs from lumbar spine. In this study, we are particularly interested in convolutional neural networks (CNN); it was characterized by a topology similar to a visual cortex of mammals. In fact, these kind of techniques has been applied successfully in many classification problems. In order to recognize herniated lumbar disc in Magnetic Resonance Imaging (MRI), we have chosen to use Convolutional neural networks based on VGG16 architecture. Experiments were carried on our own dataset from Sahloul University Hospital of Sousse. The accuracy achieved of the trained model was 94% which represents a high-performance results by providing state of the art. Our system is very efficient and effective for detecting and diagnosing herniated lumbar disc. Therefore, The contribution of this study includes in: Firstly, the using of the U-net deep neural network architecture to localize and to detail the location of the herniation. Secondly, the using of the axial view MRI in order to locate exactly the pathological and the normal intervertebral discs.The main objective of this paper is to help radiologists in the diagnosing and treating lumbar herniated disc disease.
1. Introduction
The main cause of herniated discs and the lower back pain was the pathology and the loss of the height of one or more than one inter-vertebral discs. The spine is made up of bony vertebrae separated by discs which are round cushioning and shock-absorbing pads. Different conditions of the lumbar spine including disc herniation are a main cause of low back pain. The disc height loss is the major cause of her-niation. Disruption of inner annular fibers with intact outer annular fibers, fragment without tail extending into disc space and fragment may be reabsorbed spontaneously. Lumbar discs localization is a chal-lenging problem due to a wide range of variabilities in the size, shape, count and appearance of discs and vertebrae. A disc substance com-presses the spinal cord. It is the herniation that comprises four stages according to the nucleus pulposus state. In this study, we worked
toward 2-D segmentation and classification of both normal and de-generated lumbar intervertebral discs from T2-weighted MR images of the spine; we proposed the deep learning method for locating and classification the intervertebral disc in order to find the type of her-niated disc: median, foraminal or post lateral. The automatic detection of intervertebral disc from lumbar magnetic resonance imaging is the first step towards computer-aided diagnosis. In this paper, we proposed to explore the importance of axial lumbar MRI for the automatic de-tection of abnormalities and we proposed a robust method to detect herniated lumbar disc. A computer aided diagnosis(CAD) system to generate results from the clinical computed tomography(CT) and clin-ical magnetic resonance imaging (MRI) would boost the diagnosis’ confidence and reduce the radiologists’ burden. There are different types of herniated discs such as cervical, dorsal or lumbar herniation. The lumbar herniated discs are the most common disease. The main
https://doi.org/10.1016/j.inat.2020.100837
Received 11 January 2020; Received in revised form 11 April 2020; Accepted 5 July 2020
⁎Corresponding author.
E-mail addresses:[email protected](W. Mbarki),[email protected],[email protected](M. Bouchouicha),[email protected](S. Frizzi),
[email protected](F. Tshibasu),[email protected](L.B. Farhat),[email protected](M. Sayadi).
Available online 11 July 2020
2214-7519/ Published by Elsevier B.V. This is an open access article under the CC BY-NC-ND license (http://creativecommons.org/licenses/by-nc-nd/4.0/).
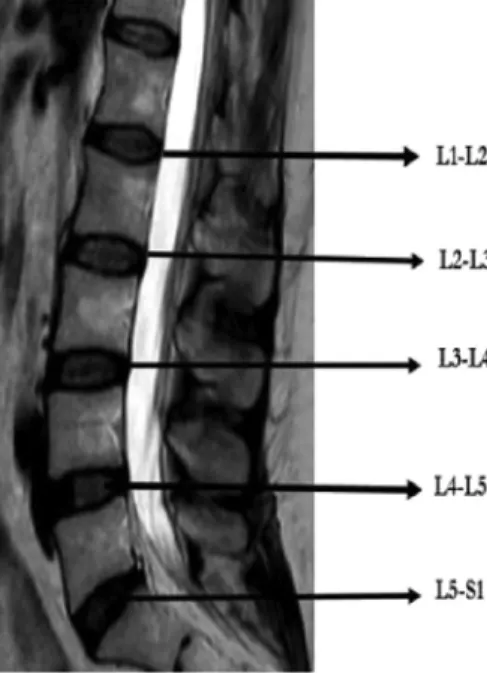
method for diagnosing the illness of lower back pain is the Magnetic Resonance Imaging (MRI) examination. The main objective of this paper concludes in localizing and labeling the disc area in the lumbar spine using the axial intervertebral discs. Axial lumbar discs localiza-tion is a challenging problem due to a wide range of variabilities in the size, shape, count and appearance of discs and vertebrae. The tradi-tional segmentation methods and thresholding have some drawbacks. Automation of the segmentation process of medical images is a difficult task. It is complex and does not contain any of the simple features. Clustering methods are mostly dependent on selection of parameters, noise sensitivity and their convergence mainly depends on cluster centroid initialization. For each disc in sagittal view, we can find a suitable axial view, which shows the size and location tofind the type of herniated disc (as shown in theFig. 1). A disc substance compresses the spinal cord. The herniation comprises four stages according to the nucleus pulposus state. Thefirst step was called bulging in which the disc has a mild herniation. The second stage was called protrusion in
which the herniated disc compresses the spinal cord. The third step was called extrusion in which the fragment migrates superiorly. The fourth step was the extrusion when the herniated disc with a free fragment has ruptured through the posterior ligaments [1]. The evaluation of de-generated and herniated discs were performed in T2-Weighted MRI. Labeling and localizing of the intervertebral discs represent thefirst step to find the type of disc herniation. Difference between bulge, protrusion, extrusion and exclusion were made according to the shape of disc. TheFig. 6a shows the disc degenerated type2 in L4-L5 ’para-median and right foraminal protrusion. In L5-S1, we show para’para-median extrusion and degeneration type C in L1-L2. In this paper, we proposed a method based on deep learning to help radiologist and clinicians in performing lumbar disc localization through segmentation of discs and apophyse in axial view MRI images. We will consider the importance of deep convolutional neural networks and advanced technologies used to perform automatic detection of lumbar intervertebral discs in axial view MRI. Our study is organized as follows: Firstly, we presented the proposed approach and the network architecture in Section2. Datasets and features extraction method was presented in Section3. Third, we discussed the training data and the different results in Section4. Then, extensive experiments were discussed in Section5. Finally, conclusions were draw in Section6. The main objective of this paper is to develop a new system for detecting and extracting the herniated lumbar disc. The principal originality of this work is the development of a new approach based on deep learning to help radiologist to detect herniation using axial view MRI.
2. Related work
There are many previous methods for intervertebral disc detection of diseases on lumbar spine. Jiang et al.[2]developed a quantitive and visualization analysis framework using image segmentation technique to derive six features that were extracted from patients’ MRI images. These features include the distribution of the protruded disc, the ratio between the protruded part and the dural sacs, and its relative signal intensity. Booth et al. [3] proposed an algorithm that could auto-matically locate the center of the spinal canal on the axial images based on a symmetry measure. Ghosh et al.[4]presented a majority voting system for the lumbar herniation diagnosis that used intensity, planar shape features, and texture features extracted by Gray level co-occur-rence matrix. The system was tested on a dataset containing 35 subjects and the accuracy of the system was 94.86%. Bhole et al.[5]developed a
Fig. 1. Different discs in sagittal view.
Fig. 2. Principle of Deep Learning.
W. Mbarki, et al. Interdisciplinary Neurosurgery 22 (2020) 100837
method for automatic segmentation of lumbar discs and vertebrae from magnetic resonance imaging using the geometric information from T2 axial, T2 sagittal and T1 sagittal modalities. They achieved 98.8% ac-curacy for discs labeling on 67 sagittal cases. Oktay et al.[6]presented another method using pyramidal histogram of oriented gradients (HOG) and SVM to achieve 95% accuracy on 40 images. Peter et al.[7] developed a fully and unsupervised approach based on active contour model. They achieved 0.71 dice similarity index on 60 images. Schmidt et al. [8]proposed a probabilistic model that measures the different locations of the intervertebral disc in MRI. They achieved 91% accuracy on 30 images. Pekar et al.[9]developed a labeling approach for de-tecting and automatic scanning in magnetic resonance imaging. They detected the different candidates of discs from the two dimensional images of horizontal spinal. They gained an accuracy 25/30 for the lumbar regions and 29/30 for the cervical scans. This approach was one-step beyond the method of Peng et al.[1]found the best sagittal slice to detect intervertebral disc. They used a canny edge operator creating open contours. Horsfield et al. [10]developed a semi-auto-matic approach for the detection of the spinal cord from the magnetic resonance imaging; they used an active surface model to achieve mul-tiple sclerosis. Ayed et al.[11]proposed a method based on graph cut segmentation to delineate the intervertebral discs in spine magnetic resonance images. Michopolou et al.[12]achieved 86–88% accuracy for normal vs degenerated disc classification. They used fuzzy C-means to perform semi-automatic atlas based disc segmentation and then used a Bayesian Classifier. They also reported 94% accuracy using texture features for 50 manually segmented discs. Neubert et al.[13]proposed a new approach to diagnose herniated discs and degeneration in mag-netic resonance imaging in order to classify pathologies, they was done based on signal intensity and shape features. Liqiang Nie et al.[14] suggested a novel model based on multimodal data and multimedia in order to delimit the chronic diseases progress. For diagnosing disc ab-normalities from the axial view MRI, Unal et al.[15]proposed a hybrid model using features obtained manually by the technician. Hoad et al. [16]respectively proposed a technique to segment vertebrae and spinal cord on MRI images. For both cases, the initialization phase needed a user interaction to manually detect the center of the spinal cord at every spine level or to manually locate 4 points on each vertebral body. On the other hand, they developed an algorithm that could automatically localize the center of the spinal canal on the axial images based on a symmetry measure. Then they applied an active contour algorithm to segment the spinal canal. Tsai et al.[17]detected herniation from 3D MRI and CT volumes of the discs by using geometric features like shape, size and location. Ruiz-Espana et al.[18]achieved a full classification using the intensities across the height of the intervertebral discs fea-tures. Corso et al.[19]developed a two-level probabilistic model for labeling a magnetic resonance lumbar scans. They used a powerful method to solve the problem of the light intensity changing of MR images. They used 20 T2 weighted scans of patients to test their ap-proach. They gained 96.6% accuracy. Alomari et al.[20]presented a fully automated herniation detection system using GVF snake for an initial disc contour and then trained a Bayesian classifier on the re-sulting shape features. They achieved 92.5% accuracy on 65 clinical MRI cases but a low sensitivity of 86.4%. Ghosh et al.[21]proposed a robust and fully automated lumbar herniation diagnosis system. They reduced the time to analyze each case. They constructedfive different classifiers and combined them to achieve the best results; they got 94.86% accuracy and 95.90% specificity. Booth et al. proposed an al-gorithm that could detect the center of the spinal canal automatically: Elias et al.[22]developed a system in order to diagnose lumbar disc herniation disease by MRI image. They used the Otsu thresholding method and extracted features by calculating the shape feature and finally they found the classification by using the Multi-layer perceptron, the k-nearest neighbor and the support vector machine. The MLP and KNN classifiers showed around 91.90% and 92.38% of accuracy re-spectively [23]. Chevrefils et al. [24] combined two methods, the
watershed and the morphological operations, to detect the discs from MR images. An automated technique was proposed to regulate the in-itial values of the centroid of the cluster using intuitionistic fuzzy clustering. A new complement of function was mentioned for in-tuitionistic fuzzy clustering using the magnetic resonance imaging. The evaluation is done using recall, precision, Jaccard coefficient and dice coefficient. Any CAD system goes through several steps to perform the diagnosis process: These steps are: Image enhancement, Region of in-terest extraction, Herniated lumbar disc detection, Classification of herniation detected as type A, B, C or D. Seifert et al.[25]proposed an automated system for cervical intervertebral disc segmentation using the Hough transform and statistical shape- aware deformable models. Many studies were investigated possible causes of discs interpretation, investigation of the results was complicated by lack of a standardized magnetic resonance imaging of spinal degeneration phenotype [26]. Magnetic Resonance imaging recognition of spinal degeneration fea-tures have become a common diagnostic tool. Therefore, numerous with disc degeneration features were asymptomatic [27]. Advanced works with Deep Learning techniques were studied. Cain et al.[28] developed deep learning methods to detect and segment intervertebral discs and vertebrae from 2D images or volumetric data. Simonyan et al. [29], He et al.[30], Dou et al.[31]developed many methods based on deep learning to detect and localize intervertebral discs(IVDs) and vertebrae from 2D images. Cai et al.[32]recognized IVDs by a 3D hierarchical model and achieved the segmentation by using features extracted from deep neural networks. Both Chen et al.[33], Suzani et al.[34]proposed approaches based on deep learning, the approach proposed by Chen et al. was based on CNN(Convolutional neural net-works) and the method developed by Suzani et al. was based on feed forwards neural networks. Jamaludin et al.[35]developed a convolu-tional neural network based framework to automatically detect each intervertebral disc and the vertebrae with a number of radiological scores. Ala-Kafri et al.[36]proposed a method based on deep learning (Segnet architecture) in order to aid clinicians in performing lumbar spinal stenosis detection through delineation of MRI scans of lumbar discs. They developed a new approach in order to help radiologist in performing lumbar spinal localization in MRI. Aras et al.[37]detected the intervertebral discs and vertebrae from high-resolution magnetic resonance imaging by using a statistical shape model. Chen et al.[38] proposed a novel detection method, they presented a convolutional neural network to locate the spine from L1 to S, the experiments showed that their method was received a better accuracy than others. G.Wang et al.[39]developed a system based on deep learning to per-form segmentation and labeling axial MRI slices from MRI.
3. Proposed approach
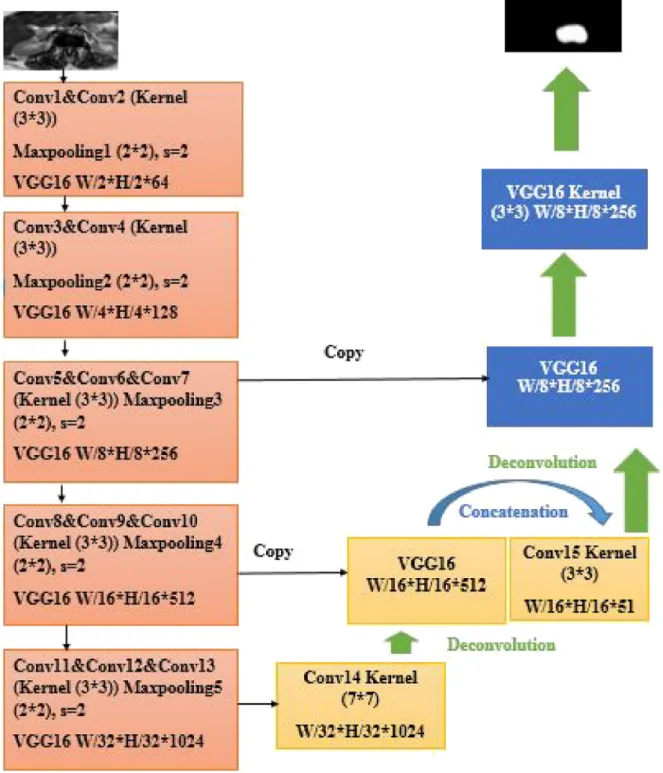
In this section, we describe our approach to detect a herniated lumbar disc starting from L1-L2, L2-L3, L3-L4, L4-L5 andfinally L5-S1 as shown in theFig. 1: Intervertebral disc can be easily detected from sagittal view; the problem lies in detection from axial view MRI. We proposed to use the deep learning technique in order to extract features, to classify the herniated and the normal lumbar disc automatically using the convolutional neural networks, particularly the vgg16 archi-tecture (as shown in theFig. 3)) tofind the disco radicular conflicts in order tofind the type of herniation. To reach this objective we need firstly to automatic label the discs via artificial intelligence and ma-chine learning. In our experiments we will concentrate on the VGG16 architecture (Shown in theFig. 3)) to detect the disc and the thecal sac in order to classify the herniated disc as foraminal, post-lateral or median.
3.1. Description of our network architecture
Our model include the convolutions, the pooling, the transpose convolutions and activation layers. The VGG16 model was inspired
Fig. 3. VGG16 Structure. Table 1
MRI Disc Parameters.
Viewplane types + Sequence Types SagittalT2 Weighted Axial T2 Weighted
Echo time(ms) 71.0 to95.0 82.0 to 98.0
Repetition time(ms) 2900 to 3500 2000 to 5500
Number of Echoes 16 to 19 8 to 15
Field of view 260 210
Spacing between slices(mm) 2.9 to 5.9 2.9 to 5.9
Slice Tickness 2.0 to 4.0 2.0 to 4.0
Matrix(Freq. x Phase) 100% 100%
Imaging Frequency (MHZ) 64.5689 to 64.68975 64.5689to 64.68975 Number of phase Encoding Steps 250 to 400 250 to 450
Flip Angle 150 150
W. Mbarki, et al. Interdisciplinary Neurosurgery 22 (2020) 100837
from the U-net architecture[40]. There are two steps coding and de-coding. In the coding step, there are two blocks, which they include two convolutional operations with a kernel size 3 × 3, and three blocks composed of three convolutional operations with a kernel size 3 × 3 and a maxpooling layer in order to minimize the feature maps. The decoding step include one convolutional operation with a kernel size 7 × 7 and a stride s = 2, one deconvolutional layer and features maps of Transpose convolution or deconvolutional step with softmax and argmax layers to detect disc and apophyse masks in order to detect the disc and apophyse. Each convolution layer in the Eq.1was lied with rectified unit layer (Relu). Each image has a width W and a height H.
3.2. CNN components 3.2.1. Convolutional layers
A convolutional LayerCi(i: is the Layer of the network) is set by K convolutional maps Nji (j = 1…k). The convolutional kernel size is: Mx*My. Each convolutional map Nji is the sum of the previous con-volution mapsN−
j
i 1. A bias b
j
iis subsequently added. The result is ob-tained via an activation function. Below is the result of a fully con-nected map to previous layers.
∑
= + = − Nji Φ( )bji N *M i k ki ki 1 1 (1) *: convolutional product.Φ: Activation function3.2.2. Pooling Layers
The principal aim of these layers is to reduce the resolution of convolutional maps. Max pooling is the most known operator as in the Eq.2:
=
aj maxN N* (ain n* u n n( , )) (2)
3.2.3. Activation function (Relu)
The deep artificial Neural networks (CNN) was trained efficiently using Relu than using tanh and sigmoid (it cannot solve the gradient vanishing problem). For modeling a neuron’s output f, the standard way is a function of its input x is withf x( )=max(0, )x where x is the ramp function, is the input to a neuron. Hinton et al. [23], they refer to neurons with this nonlinearity as Rectified Linear Units (ReLUs). Deep convolutional neural networks with ReLUs train several times faster than their equivalents with tanh units. Jarrett et al.[22]claim that the nonlinearity f x( )=tanh( )x works particularly well with their type of contrast normalization followed by local average pooling.
3.2.4. Features extraction
Our features were extracted by a software named labelme, which used to predict the disc (as shown inFig. 3)and the apophyse area in the axial view MRI. These features set covers the intensity characteristic of the magnetic resonance imaging and the coordinates value. 3.2.5. Lumbar discs MRI
Our dataset was collected from Sahloul University Hospital of
Sousse between Marsh 2018 and January 2019 from patients who were reported relevant pains. We collected clinical magnetic resonance imaging (MRI) of 450 patients with symptomatic sciatica and lower back pain. The parameters used in the MRI scanning are varied and depend on view plane types and the sequence. The most important values are summarized inTable 1. The main objective of this study is to develop an automatic system to detect herniated lumbar disc, we focus on an application of artificial intelligence based on deep convolutional neural networks which is adaptable to this difficult task in order to help radiologist and clinicians for diagnosing herniation in Magnetic Re-sonance Imaging. We have trained our convolutional network after labeling our dataset.Firstly, weflipped the training images and the validation images because our dataset was very smaller, so we have increased the training data from 330 images to 1320 images and the validation data from 52 images to 416 images. We have extracted the mask-disc and the mask-apophyse for each image. Secondly, we have trained(as in theFig. 4–6) our network and the Graphical card GTX 1080 following three classes(Disc, apophyse and the background). Fi-nally, we found an accuracy 0.889 for the disc, 0.631 for the apophyse and 0.998 for the background(as shown inFig. 7e). IoU of apophyse was very lower than thecal disc’s IoU and background’s IoU because of intenisties’s pixels and region of interest(as shown inFig. 5: case1,2). 3.2.6. Training data
Thefirst step to use in the Deep Convolutional neural networks is to preparing to train classifiers with training data. In our study, the training data is masks containing the disc and the apophyse area in
Fig. 5. Discs MRI and the developed disc and apophyse for each image.
W. Mbarki, et al. Interdisciplinary Neurosurgery 22 (2020) 100837
order to delilimit the position and the form of disc to classify the her-niated disc as bulging, protrusion, extrusion or exclusion. (A, B, C,D). These training masks (disc-mask and apophyse-mask) are provided manuallyusing the labelme software. Figure1 we shows an example of mask images and the MRI images. The Lableme we found the manual segmentation and the masks of the two classes. We have divided our dataset: 1320 images for training and 320 MRI for testing (Section5). Learning rate decay if the validation loss does not improve for 5 con-tinues epochs.Early stopping if the validation loss does not improve for 10 continues epochs.Save the weights only if there is improvement in validation loss. We use a batch size of 32. Note that there could be a lot of scope to tune these hyper parameters and further improve the model performance. Our experiments consist of tens of epochs, the learning rate of the convolution layer is set to be10 3− and that of the
decon-volution layer is10 4, therefore the batch size selection is a very im-−
portant task. Our experiments show that the mini batch size of 32 is a good choice.
Fig. 6. The different Cases on Magnetic Resonance Imaging.
4. Experiments
In our experiments, the training data was containing the non-disc and the disc area clearly labelled. For the training and the testing processes using our dataset to evaluate the efficacity of the parameters of the convolution network (VGG16), we used a Geforce GTX 1080 for acceleration training and testing within acceptable time. The proposed neural architecture is inspired from the convolutional neural networks. Each network contains characteristic maps that are the convolution results, pooling or unit operations of neurons. The application of these operations ensures the extraction of characteristics leading to the au-tomatic recognition of herniated disc in the magnetic resonance Imaging (MRI). Thefirst Layer is the input Layer, it consists of inputs cards, each of them corresponding to image color. We can distinguish three main levels: Level1: Convolutional part equivalent to extraction of features. Layer of inputs extracts some specific features such as pixel intensity from three color channels: this layer consists of the char-acteristic maps. Level2: Combining features and extracting more com-plex information: Outputs of the different cards are merged in order to combine different characteristics. Level 3: The third level is the classi-fication level through a classifier, which will associate each herniated lumbar disc with its corresponding class. The necessary layers in the convolutional neural network are convolutional layers, pooling Layers and fully connected layers (FC). The intersection-over-union (IoU) was calculated as the ratio between the intersection (number of predicted pixels) and the union (the sum of number of incorrectly and correctly predicted pixels) (as shown inFig. 4). (3): The number of pixels of class c (background, apophyse or disc) correctly predicted pixels.: The total number of pixels predicted to class c.: The total number of pixels of class c.
5. Results and discussion
We evaluate our method on our T2 weighted MRI, and calculate
performance metrics using convolutional neural networks for T2 axial views. We detected all the visible discs starting from L1-L2 to L5-S1 in the lumbar spine to successfully classify the case of patient and tofind the type of surgical operation. Accuracy gets a discrete false or true value for a particular sample and the loss function is used to optimize a machine learning algorithm,we notice that the loss function tends to 0, it means that our system is very efficient.
Paragraph headings Use paragraph headings as needed.
+ =
a2 b2 c2 (3)
Our herniated disc localization technique has two essential steps as follows: Firstly, we proposed a manual labeling intervertebral Disc and apophyse segmentation using the labelme software in order to extract the region of interests (as discussed in the Section 4.1.1) on the T2 axial views MRI. The second step represents the segmentation and classi fi-cation of the lumbar intervertebral disc using the magnetic resonance imaging (as shown in theFig. 6). Figure shows the sagittal view with the different discs (L1-L2), (L2-L3), (L3-L4), (L4-L5) and (L5-S1)Fig. 2 shows the intervertebral disc and the different parts of the axial view. This low signal is in the T2-SPIR MR images and thefigure shows the detected disc (as shown in theFig. 6d. The evaluation of our approach was found on our own MRI dataset collected from the university hos-pital of sousse because we haven’t a public dataset for herniated lumbar disc on axial view. Firstly, We found the experiments on 50 cases and after we increased our dataset to 150 cases which include multiple axial resonance imaging. The subjects range in their age between 14 and 81 years old with different abnormality conditions including at least one herniated disc in each subject. The dataset include both of the T1 and the T2 weighted, we are particularly interested to the T2 axial view magnetic resonance imaging. Using the Uet-architecture on axial view MRI allows as to perform and realize the best results providing by the state of the art (Table 2) summarize some results)
The best results was achieved by the Unet architecture. 6. Conclusion
We have studied a method to help radiologists in performing lumbar discs detection in MRI images. This method based on convolutional neural network starts by applying segmentation to locate three regions of interest namely apophyse, disc and background in order to classify the herniated lumbar disc depending on the shape of the disc and the position to the apophyse. We proposed to use VGG16, one of the best performing convolutional neural networks. Due to the limitation in
Fig. 7. The individual class performance of the VGG16 classifier. Table 2
IoU results for different approaches.
Architecture IoU results Medium Gaussian SVM 66%
Segnet 58%
PALMSNet 76%
Unet 93.3%
W. Mbarki, et al. Interdisciplinary Neurosurgery 22 (2020) 100837
suitability of existing public lumbar dataset, we decided to use our own dataset. The convolutional neural network architecture was successfully tested on more than 200 patient cases. This study can assist radiologist and clinicians with basic work. We developed a system for herniation disc detection based on deep neural networks that used a sliding window and calculates the features. Each position results in an acti-vation of the neuron and the output was collected in the feature map in order to detect herniation. We cropped image and we extracted an example of region of interest. Our system detected herniated disc and the future work we will classify automatically disc herniation as type A, B, C or D to help radiologist in diagnosing the herniated disks. We have developed a new approach to help radiologist and clinicians in diag-nosing the different cases of herniation and to see if the patient will undergo a simple treatment or a surgical operation.
Appendix A. Supplementary data
Supplementary data associated with this article can be found, in the online version, athttps://doi.org/10.1016/j.inat.2020.100837. References
[1] Possible pathogenesis of painful intervertebral disc degeneration, Spine 31 (5) (2006) 560–566.
[2] B. Peng, J. Hao, S. Hou, W. Wu, D. Jiang, X. Fu, Y. Yang, Possible pathogenesis of painful intervertebral disc degeneration, Spine 31 (5) (2006) 560–566. [3] The use of epidural steroids in the treatment of lumbar radicular pain. a
pro-spective, randomized, double-blind study., The Journal of bone and joint surgery. American volume 67(1) (1985) 63–66.
[4] Supervised methods for detection and segmentation of tissues in clinical lumbar mri, Computerized medical imaging and graphics 38(7) (2014) 639–649. [5] C. Bhole, S. Kompalli, V. Chaudhary, Context sensitive labeling of spinal structure in
mr images, in: Medical Imaging 2009: Computer-Aided Diagnosis, vol. 7260, International Society for Optics and Photonics, 2009, p. 72603P.
[6] A.B. Oktay, Y.S. Akgul, Localization of the lumbar discs using machine learning and exact probabilistic inference, International Conference on Medical Image Computing and Computer-Assisted Intervention, Springer, 2011, pp. 158–165. [7] J. Koh, P.D. Scott, V. Chaudhary, G. Dhillon, An automatic segmentation method of
the spinal canal from clinical mr images based on an attention model and an active contour model, in: 2011 IEEE International Symposium on Biomedical Imaging: From Nano to Macro, IEEE, 2011, pp. 1467–1471.
[8] S. Schmidt, J. Kappes, M. Bergtholdt, V. Pekar, S. Dries, D. Bystrov, C. Schnörr, Spine detection and labeling using a parts-based graphical model, Biennial International Conference on Information Processing in Medical Imaging, Springer, 2007, pp. 122–133.
[9] V. Pekar, D. Bystrov, H.S. Heese, S.P. Dries, S. Schmidt, R. Grewer, C.J. Den Harder, R.C. Bergmans, A.W. Simonetti, A.M. Van Muiswinkel, Automated planning of scan geometries in spine mri scans, International Conference on Medical Image Computing and Computer-Assisted Intervention, Springer, 2007, pp. 601–608. [10] M.A. Horsfield, S. Sala, M. Neema, M. Absinta, A. Bakshi, M.P. Sormani,
M.A. Rocca, R. Bakshi, M. Filippi, Rapid semi-automatic segmentation of the spinal cord from magnetic resonance images: application in multiple sclerosis, Neuroimage 50 (2) (2010) 446–455.
[11] I.B. Ayed, K. Punithakumar, G. Garvin, W. Romano, S. Li, Graph cuts with invariant object-interaction priors: application to intervertebral disc segmentation, Biennial International Conference on Information Processing in Medical Imaging, Springer, 2011, pp. 221–232.
[12] Atlas-based segmentation of degenerated lumbar intervertebral discs from mr images of the spine, IEEE Trans. Biomed. Eng. 56(9) (2009) 2225–2231. [13] A. Neubert, J. Fripp, C. Engstrom, D. Walker, M. Weber, R. Schwarz, S. Crozier,
Three-dimensional morphological and signal intensity features for detection of in-tervertebral disc degeneration from magnetic resonance images, J. Am. Med. Inform. Assoc. 20 (6) (2013) 1082–1090.
[14] L. Nie, L. Zhang, Y. Yang, M. Wang, R. Hong, T.-S. Chua, Beyond doctors: future health prediction from multimedia and multimodal observations, Proceedings of the 23rd ACM international conference on Multimedia ACM, 2015, pp. 591–600. [15] Y. Unal, K. Polat, H.E. Kocer, M. Hariharan, Detection of abnormalities in lumbar discs from clinical lumbar mri with hybrid models, Appl. Soft Comput. 33 (2015) 65–76.
[16] C. Hoad, A. Martel, Segmentation of mr images for computer-assisted surgery of the lumbar spine, Phys. Med. Biol. 47 (19) (2002) 3503.
[17] R. Tsai, A versatile camera calibration technique for high-accuracy 3d machine vision metrology using off-the-shelf tv cameras and lenses, IEEE J. Rob. Autom. 3 (4) (1987) 323–344.
[18] I. Castro-Mateos, R. Hua, J.M. Pozo, A. Lazary, A.F. Frangi, Intervertebral disc classification by its degree of degeneration from t2-weighted magnetic resonance images, Eur. Spine J. 25 (9) (2016) 2721–2727.
[19] J.J. Corso, A. Raja’S, V. Chaudhary, Lumbar disc localization and labeling with a probabilistic model on both pixel and object features, International Conference on Medical Image Computing and Computer-Assisted Intervention, Springer, 2008, pp. 202–210.
[20] R.S. Alomari, J.J. Corso, V. Chaudhary, G. Dhillon, Lumbar spine disc herniation diagnosis with a joint shape model, Computational Methods and Clinical Applications for Spine Imaging, Springer, 2014, pp. 87–98.
[21] S. Ghosh, A. Raja’S, V. Chaudhary, G. Dhillon, Composite features for automatic diagnosis of intervertebral disc herniation from lumbar mri, 2011 Annual International Conference of the IEEE Engineering in Medicine and Biology Society, IEEE, 2011, pp. 5068–5071.
[22] K. Murphy, G. Elias, J. Steppan, C. Boxley, K. Balagurunathan, X. Victor, T. Meaders, M. Muto, Percutaneous treatment of herniated lumbar discs with ozone: investigation of the mechanisms of action, J. Vasc. Interv. Radiol. 27 (8) (2016) 1242–1250.
[23] E. Ebrahimzadeh, F. Fayaz, F. Ahmadi, M. Nikravan, A machine learning-based method in order to diagnose lumbar disc herniation disease by mr image processing, MedLife Open Access 1 (1) (2018) 1.
[24] C. Chevrefils, F. Chériet, G. Grimard, C.-E. Aubin, Watershed segmentation of in-tervertebral disk and spinal canal from mri images, International Conference Image Analysis and Recognition, Springer, 2007, pp. 1017–1027.
[25] G. Marquardt, M. Bruder, S. Theuss, M. Setzer, V. Seifert, Ultra-long-term outcome of surgically treated far-lateral, extraforaminal lumbar disc herniations: a single-center series, Eur. Spine J. 21 (4) (2012) 660–665.
[26] D. Steffens, M.J. Hancock, L.S. Pereira, P.M. Kent, J. Latimer, C.G. Maher, Do mri findings identify patients with low back pain or sciatica who respond better to particular interventions? a systematic review, Eur. Spine J. 25 (4) (2016) 1170–1187.
[27] W. Brinjikji, P.H. Luetmer, B. Comstock, B.W. Bresnahan, L. Chen, R. Deyo, S. Halabi, J. Turner, A. Avins, K. James, et al., Systematic literature review of imaging features of spinal degeneration in asymptomatic populations, Am. J. Neuroradiol. 36 (4) (2015) 811–816.
[28] R.P. Jackson, J.J. Cain, R. Jacobs, B.R. Cooper, G.E. Mcmanus, The neuroradio-graphic diagnosis of lumbar herniated nucleus pulposus: Ii. a comparison of com-puted tomography (ct), myelography, ct-myelography, and magnetic resonance imaging, Spine 14 (12) (1989) 1362–1367.
[29] K. Simonyan, A. Zisserman, Very deep convolutional networks for large-scale image recognition, arXiv preprint arXiv:1409.1556.
[30] K. He, X. Zhang, S. Ren, J. Sun, Deep residual learning for image recognition, in, Proceedings of the IEEE conference on computer vision and pattern recognition, 2016, pp. 770–778.
[31] Q. Dou, L. Yu, H. Chen, Y. Jin, X. Yang, J. Qin, P.-A. Heng, 3d deeply supervised network for automated segmentation of volumetric medical images, Med. Image Anal. 41 (2017) 40–54.
[32] Y. Cai, M. Landis, D.T. Laidley, A. Kornecki, A. Lum, S. Li, Multi-modal vertebrae recognition using transformed deep convolution network, Computerized medical imaging and graphics 51 (2016) 11–19.
[33] H. Chen, Q. Dou, L. Yu, J. Qin, P.-A. Heng, Voxresnet: deep voxelwise residual networks for brain segmentation from 3d mr images, NeuroImage 170 (2018) 446–455.
[34] A. Suzani, A. Seitel, Y. Liu, S. Fels, R.N. Rohling, P. Abolmaesumi, Fast automatic vertebrae detection and localization in pathological ct scans-a deep learning ap-proach, International Conference on Medical Image Computing and Computer-Assisted Intervention, Springer, 2015, pp. 678–686.
[35] N.F. Harun, K.M. Yusof, M.Z. Jamaludin, S.A.H.S. Hassan, Motivation in problem-based learning implementation, Proc.-Soc. Behav. Sci. 56 (2012) 233–242. [36] A.S. Al-Kafri, S. Sudirman, A. Hussain, D. Al-Jumeily, F. Natalia, H. Meidia,
N. Afriliana, W. Al-Rashdan, M. Bashtawi, M. Al-Jumaily, Boundary delineation of mri images for lumbar spinal stenosis detection through semantic segmentation using deep neural networks, IEEE Access 7 (2019) 43487–43501.
[37] R. Haq, R. Aras, D.A. Besachio, R.C. Borgie, M.A. Audette, 3d lumbar spine inter-vertebral disc segmentation and compression simulation from mri using shape-aware models, Int. J. Comput. Assisted Radiol. Surgery 10 (1) (2015) 45–54. [38] Y. Zhou, Y. Liu, Q. Chen, G. Gu, X. Sui, Automatic lumbar mri detection and
identification based on deep learning, J. Digital Imaging 32 (3) (2019) 513–520. [39] G. Wang, R. Li, P.A. Patel, M. Aertsen, T. Doel, A.L. David, J. Deprest, S. Ourselin,
et al., Interactive medical image segmentation using deep learning with image-specific fine tuning, IEEE Trans. Med. Imaging 37 (7) (2018) 1562–1573. [40] X. Li, H. Chen, X. Qi, Q. Dou, C.-W. Fu, P.-A. Heng, H-denseunet: hybrid densely
connected unet for liver and tumor segmentation from ct volumes, IEEE Trans. Med. Imag. 37 (12) (2018) 2663–2674.