HAL Id: hal-01619542
https://hal.archives-ouvertes.fr/hal-01619542
Submitted on 15 Nov 2019
HAL is a multi-disciplinary open access
archive for the deposit and dissemination of
sci-entific research documents, whether they are
pub-lished or not. The documents may come from
teaching and research institutions in France or
abroad, or from public or private research centers.
L’archive ouverte pluridisciplinaire HAL, est
destinée au dépôt et à la diffusion de documents
scientifiques de niveau recherche, publiés ou non,
émanant des établissements d’enseignement et de
recherche français ou étrangers, des laboratoires
publics ou privés.
Genetic Factors and Orofacial Motor Learning
Selectively Influence Variability in Central Sulcus
Morphology in Chimpanzees (Pan troglodytes)
William D. Hopkins, Oliver Coulon, Adrien Meguerditchian, Michelle Autrey,
Kendall Davidek, Lindsay Mahovetz, Sarah Pope, Mary Catherine Mareno,
Steven J. Schapiro
To cite this version:
William D. Hopkins, Oliver Coulon, Adrien Meguerditchian, Michelle Autrey, Kendall Davidek, et
al.. Genetic Factors and Orofacial Motor Learning Selectively Influence Variability in Central Sulcus
Morphology in Chimpanzees (Pan troglodytes). Journal of Neuroscience, Society for Neuroscience,
2017, 37 (22), pp.5475-5483. �10.1523/JNEUROSCI.2641-16.2017�. �hal-01619542�
Behavioral/Cognitive
Genetic Factors and Orofacial Motor Learning Selectively
Influence Variability in Central Sulcus Morphology in
Chimpanzees (
Pan troglodytes)
William D. Hopkins,
1,2,3,4X
Oliver Coulon,
5X
Adrien Meguerditchian,
4,6Michelle Autrey,
2X
Kendall Davidek,
2Lindsay Mahovetz,
2Sarah Pope,
2Mary Catherine Mareno,
7and Steven J. Schapiro
71Division of Developmental and Cognitive Neuroscience, Yerkes National Primate Research Center, Atlanta, Georgia 30322,2Neuroscience Institute and Language Research Center, Georgia State University, Atlanta, Georgia 30302,3IMe´RA Institut d’Etudes Avance´es, Aix-Marseille University, 13004 Marseille, France,4Brain Language Research Institute, Aix-Marseille University, Centre National de la Recherche Scientifique (CNRS), 13604 Aix-en-Provence, France,5Laboratoire des Sciences de l’Information et des Syste`mes, Unite´ Mixte de Recherche (UMR) 7296, Aix-Marseille Universite, Centre Nationale de la Recherche Scientifque, Institut de Neuroscience de La Timone, Marseille, France 13288,6Laboratoire de Psychologie Cognitive, UMR 7290, Aix-Marseille University, CNRS, Marseille, France, and7National Center for Chimpanzee Care, Department of Veterinary Sciences, The University of Texas M.D. Anderson Cancer Center, Bastrop, Texas 78602
Captive chimpanzees (
Pan troglodytes) have been shown to learn the use of novel attention-getting (AG) sounds to capture the attention
of humans as a means of requesting or drawing their attention to a desired object or food. There are significant individual differences in
the use of AG sounds by chimpanzees and, here, we examined whether changes in cortical organization of the central sulcus (CS) were
associated with AG sound production. MRI scans were collected from 240 chimpanzees, including 122 that reliably produced AG sounds
and 118 that did not. For each subject, the depth of CS was quantified along the superior–inferior plane with specific interest in the inferior
portion corresponding to the region of the motor cortex where the mouth and orofacial movements are controlled. Results indicated that
CS depth in the inferior, but not superior, portion was significantly greater in chimpanzees that reliably produced AG sounds compared
with those who did not. Quantitative genetic analyses indicated that overall CS surface area and depth were significantly heritable,
particularly in the superior regions, but less so in the inferior and central portions. Further, heritability in CS depth was altered as a
function of acquisition of AG sounds. The collective results suggest that learning to produce AG sounds resulted in region-specific cortical
reorganization within the inferior portion of the CS, a finding previously undocumented in chimpanzees or any nonhuman primate.
Key words: central sulcus; chimpanzee; heritability; language; orofacial movements; vocal learning
Introduction
In primate brains, the central suclus (CS) separates primary
motor and somatosensory cortex. Electrical stimulation of the
precentral gyrus elicits different motor movements that are
topo-graphically organized along the superior–inferior plane in both
human and nonhuman primate brains (
Penfield and Boldrey,
Received Aug. 20, 2016; revised Jan. 23, 2017; accepted Feb. 1, 2017.
Author contributions: W.D.H. designed research; W.D.H., A.M., M.A., K.D., L.M., S.P., M.C.M., and S.J.S. performed research; O.C. contributed unpublished reagents/analytic tools; W.D.H. analyzed data; W.D.H., O.C., A.M., K.D., S.P., L.M., M.C.M., and S.J.S. wrote the paper.
This work was supported by the National Institutes of Health (Grants NS-73134, NS-42867, HD-60563), the National Science Foundation (INSPIRE Grant 1542848), the Human Frontier Science Program (Grant RGP0044), and the Fondation Fyssen. Chimpanzee maintenance at the National Center for Chimpanzee Care is funded by the National Institutes of Health (National Center for Research Resources Grant U42-OD-011197).
Significance Statement
Recent studies in chimpanzees (
Pan troglodytes) have shown that some can learn to produce novel sounds by configuring different
orofacial movement patterns and these sounds are used in communicatively relevant contexts. Here, we examined the
neuromor-phological correlates in the production of these sounds in chimpanzees. We show that chimpanzees that have learned to produce
these sounds show significant differences in central sulcus (CS) morphology, particularly in the inferior region. We further show
that overall CS morphology and regions within the superior portion are significantly heritable, whereas central and inferior
portions of the CS are not. The collective findings suggest chimpanzees exhibit cortical plasticity in regions of the brain that were
central to the emergence of speech functions in humans.
1936
;
Bailey et al., 1950
). For example, as
in humans,
Bailey et al. (1950)
reported
that the chimpanzee (Pan troglodytes) CS
has superior and inferior “knees” that
serve as boundaries between the leg and
arm movements and arm and face
move-ments (
Fig. 1
). Stimulation of the ventral
region of the CS immediately below the
inferior knee elicited movements of the lips,
mouth, and larynx, whereas stimulation of
the cortex above the superior knee elicited
movements of the legs and trunk.
Here, we examined the role of genetic
and nongenetic factors on variation in
CS morphology in chimpanzees. The CS is
a highly conserved sulcus in primate
evo-lution, so its development is likely under
some genetic control (
Hopkins et al., 2014b
;
Go´mez-Robles et al., 2015
). Indeed,
McKay et al. (2013)
found that heritability
in CS depth is highest in the superior and
inferior regions and essentially absent in
the central portion. Similarly,
Go´mez-Robles et al. (2015)
reported that the
spa-tial location of the superior and inferior
points of the CS are significantly heritable
in both humans and chimpanzees. Similar to
McKay et al. (2013)
, we
used quantitative genetics to evaluate heritability in the overall surface
area and mean depth along 100 equally space regions along the
su-perior–inferior plane in a sample of captive chimpanzees.
The second purpose of this study was to determine whether
individual differences in the use of attention-getting (AG) sounds
were associated with variation in the depth of the CS in
chimpan-zees, particularly within the inferior portion of the sulcus. Studies
have demonstrated that some chimpanzees and other great apes
voluntarily produce several classes of novel sounds to capture the
attention of an otherwise inattentive audience (
Theall and
Pov-inelli, 1999
;
Liebal et al., 2004
;
Poss et al., 2006
;
Cartmill and
Byrne, 2007
;
Leavens et al., 2008
;
Gentry et al., 2015
).
Experimen-tal evidence has shown that the use of AG sounds is under
volun-tary control (
Hopkins et al., 2007
;
Hopkins et al., 2011
), often
occurs in conjunction with manual gestures (
Hopkins and
Can-tero, 2003
) and grooming (
Leavens et al., 2014
;
Fedurek et al.,
2015
;
Watts, 2016
), is lateralized to the left hemisphere (
Losin et
al., 2008
;
Wallez et al., 2012
), and is socially learned (
Taglialatela
et al., 2012
). For instance, systematic investigations of the
pro-duction of AG sounds in 279 chimpanzees from two different
populations found that 52% and 46% of the chimpanzees within
each sample reliably produce some type of AG sound,
respec-tively (
Hopkins et al., 2010
;
Taglialatela et al., 2012
). Therefore,
some chimpanzees reliably produce AG sounds and others do
not.
The neural and potential genetic mechanisms that underlie
individual variation in AG sound production remains unstudied
and here we explored this question in two ways. First, we
inves-tigated whether chimpanzees that do or do not reliably produce
AG sounds differed in overall CS depth or asymmetry. In light of
the fact the AG sounds are socially learned, we were specifically
interested in assessing whether differences in overall CS depth or
asymmetry were specific to the inferior regions, where the mouth,
lips, and larynx are located in the motor cortex (
Bailey et al., 1950
;
Fig. 1
). Second, we used quantitative genetic analyses to test for
genetic correlations between AG sound production in CS depth
along and superior–inferior plane. If common genes underlie
both the production of AG sounds and CS depth, particularly
in the inferior regions, then this would suggest that genetic
mecha-nisms underlie their expression. Alternatively, if phenotypic
associations are evident between AG sound production and
region-specific CS depth and these are not attributable to
com-mon genetic factors, then this may indicate changes in CS
mor-phology that are experience dependent.
Materials and Methods
Subjects. For the quantitative genetic analyses, MRIs were obtained from
264 captive chimpanzees housed at the Yerkes National Primate Research Center (YNPRC) and the National Center for Chimp Care (NCCC) of The University of Texas M.D. Anderson Cancer Center. There were 152 females and 112 males ranging from 6 to 53 years of age. Within this sample, there were 132 mother-reared, 79 human-reared, and 53 wild-born individuals. Within the entire sample, behavioral data were avail-able for 251 individuals, including 148 females and 103 males. Therefore, the analyses focusing on the association between CS depth, AG sound production, and gesture handedness were performed on a smaller sample than the quantitative genetic analyses. The methods for measuring hand preferences for manual gestures and the production of AG sounds by the chimpanzees have been described in detail previously (Hopkins et al., 2005;Taglialatela et al., 2012). For gesture handedness, there were 81 left-handed, 51 ambiguously handed, and 119 right-handed chimpan-zees. In terms of AG sound production, 123 individuals were classified as never producing AG sounds (AG⫺) and the remaining 128 chimpanzees were observed to produce at least one AG sound within the testing par-adigm (AG⫹). Within the AG⫹group, the number of sounds produced in 6 test trials ranged between 1 and 6 (mean⫽ 3.72, SE ⫽ 0.031).
MRI image collection. Both in vivo and postmortem MRI scan data
were used in this study. In vivo scans were obtained at the time the
AmericanPsychologicalAssociationguidelinesfortheethicaltreatmentofanimalswereadheredtoduringallaspectsofthis study. We thank the veterinary staff at the NCCC and YNPRC for assistance in the collection of the MRI scans.
The authors declare no competing financial interests.
Correspondence should be addressed to William D. Hopkins, Neuroscience Institute, Georgia State University, P.O. Box 5030, Atlanta, GA 30302. E-mail:whopkin@emory.eduorwhopkins4@gsu.edu.
DOI:10.1523/JNEUROSCI.2641-16.2017
Copyright © 2017 the authors 0270-6474/17/375476-09$15.00/0
Figure 1. Summary of topographic map of the chimpanzee motor cortex based on previous published electrical stimulation. Illustration taken from The Isocortex of the Chimpanzee (copyright 1950 by the Board of Trustees of the University of Illinois. Used with permission of the University of Illinois).
chimpanzees were being surveyed for their annual physical examina-tions. Subjects were first immobilized by ketamine (10 mg/kg) or telazol (3–5 mg/kg) and subsequently anesthetized with propofol (40 – 60 mg/ kg/h) following standard procedures at the YNPRC and NCCC facilities. YNPRC subjects were then transported to the MRI facility and NCCC subjects were wheeled to the mobile imaging unit. The subjects remained anesthetized for the duration of the scans, as well as during the time needed to transport them between their home cage and the imaging facility (between 5 and10 min) or mobile imaging unit (total time⬃5 min). Subjects were placed in the scanner chamber in a supine position with their head fitted inside the human-head coil. Scan duration ranged between 40 and 60 min as a function of brain size.
Seventy-eight chimpanzees were scanned using a 3.0 T scanner (Trio; Siemens) at YNPRC. T1-weighted images were collected using a 3D gra-dient echo sequence (pulse repetition⫽ 2300 ms, echo time ⫽ 4.4 ms, number of signals averaged⫽ 3, matrix size ⫽ 320 ⫻ 320, voxel dimen-sion 0.6 mm⫻ 0.6 mm ⫻ 0.6 mm). In addition, 142 NCCC chimpanzees were scanned using a 1.5 T Philips machine. T1-weighted images were collected in the transverse plane using a gradient echo protocol (pulse repetition⫽ 19.0 ms, echo time ⫽ 8.5 ms, number of signals averaged ⫽ 8, and a 256⫻ 256 matrix, voxel dimension .7 mm ⫻ 0.7 mm ⫻ 1.2 mm). After completing MRI procedures, the subjects were temporarily housed in a single enclosure for 6 –12 h to allow the effects of the anesthesia to wear off, after which time they were returned to their social group. Post-mortem T2-scans were obtained from 44 chimpanzees that had died from natural causes. For the postmortem scanning, either 4.7 or 7 T magnets were used and T2-weighted images were collected in the trans-verse plane using a gradient echo protocol (voxel dimension 0.67 mm⫻
0.67 mm⫻ 0.67 mm) pulse repetition ⫽ 22.0 s, echo time ⫽ 78.0 ms, number of signals averaged⫽ 8–12, and a 256 ⫻ 192 matrix recon-structed to 256⫻ 256).
Sulci extraction and measurement. The sequence of postimage
process-ing steps performed on the images are shown inFigure 2, a–h. The pipeline of processing used to extract the sulci from the raw T1-weighted image derives from a pipeline initially dedicated to the human brain and freely distributed as a BrainVISA toolbox (http://brainvisa.info) (Mangin et al., 2004). To account for the differences in chimpanzee anatomy compared with humans, a number of adjustments were per-formed before the scans were processed using the pipeline procedure within BrainVISA. Specifically, chimpanzee MRI volumes were skull stripped, cropped, and reformatted at 0.7 mm isotropic resolution using ANALYZE 11.0 software and subsequently imported into BrainVISA. The pipeline process of extracting the sulci from the cortex involved a number of steps (Mangin et al., 2004;Fig. 2a– h). To align the template
brain, the anterior and posterior commissures were manually specified on the MRI at the point where they intersect with the midsagittal slice. The first step was to correct for spatial inhomogeneities in the signal intensity providing a spatially smooth bias field with a stable distribution of tissue intensities (Fig. 2b). Next, the analysis of the signal histogram
and mathematical morphology were performed using an automatic anal-ysis of the voxel intensities for the entire brain to obtain a binary mask of the brain (Fig. 2c). Adjustments were sometimes needed in the histogram
process to determine gray and white matter means for chimpanzee brain scans. The mask was then split into the left and right hemispheres and the cerebellum (Fig. 2d). A negative mold of the white matter was computed
from the split-brain mask. The outside boundary of this mold results
from a 5 mm morphological closing of the masked hemisphere, filling up the folds. The gray/white interface is the inside boundary that preserves deformations and ensures the spher-ical topology of the mold (Fig. 2e). Finally the
mold was skeletonized to detect cortical fold-ing and topological constraints guaranteed that the resulting surfaces would have no holes (Mangin, 2000;Mangin et al., 2004;Fig. 2f,g).
Finally, the folds making up the CS in each hemisphere were selected manually (Fig. 1h)
using a 3D visualization interface by following standard anatomical landmarks (Bailey et al., 1950;Hopkins et al., 2014b) and the total sur-face area and average depth were computed for this sulcus in each hemisphere (Fig. 3).
Quantifying CS depth along the superior to inferior plane. The selected CS was meshed
us-ing a triangular mesh and the resultus-ing surface was parameterized to create a longitudinal coordinate system (Coulon et al., 2006;Fig. 4a–d). The parameterization process was
con-strained by the two ventral and dorsal sulcus extremities, automatically detected using the extrema of the first nonzero eigenfunction of the mesh Laplacian (e1and e2;Fig. 4b). From
these points, a smooth and quasi-isometric (i.e., with minimal metric distortions)
coordi-nate field was extrapolated, which localizes all mesh surface points ac-cording to their relative position along the sulcus between the two extremities (Fig. 4c). The coordinate field extends along the length of the
CS from the superior/dorsal (y⫽ 1) to the inferior/ventral (y ⫽ 100) ends of the sulcus. Depth was measured at 100 sulcal length positions in a superior-to-inferior progression along the parameterized sulcal mesh surface. Position 1 was adjacent to the interhemispheric fissure and po-sition 100 was adjacent to the Sylvian fissure (Fig. 4c). At each position y
along the length, the depth was computed by measuring a geodesic dis-tance (in millimeters) from the brain envelope to the fundus of the sulcus (Fig. 4d).
Data analysis. For each subject and hemisphere, we computed a total
surface area and average depth of the CS (Fig. 3). In addition, we com-puted individual average surface area and average depth by summing the total left and right hemisphere values and dividing by two. For the pa-rameterization analyses, rather than compare and estimate the total ad-ditive genetic variance (h2) scores for each of the 100 points along the
sulcus within each hemisphere, we computed average depth values in intervals of five positions. Therefore, we computed 20 depth measures for each hemisphere along the superior-to-inferior plane (1–20). From these measures, we computed the mean depths between the hemispheres at each position as follows: mean depth⫽ (R ⫹ L)/2, as well as the difference scores in depth at each position as follows: difference⫽ (R ⫺ L). For the difference scores, positive values indicate rightward asymmetries and negative values indicated leftward biases. For all analyses,␣ was set to
p⬍ 0.05 and post hoc analyses, when necessary, were performed using
Tukey’s honestly significant difference test.
Quantitative genetic analyses. To estimate heritability, we used the
soft-ware package SOLAR (Almasy and Blangero, 1998). which uses a vari-ance components approach to estimate the polygenic component of variance when considering the entire pedigree (Rogers et al., 2007;Fears et al., 2009;Fears et al., 2011;Hopkins et al., 2014a). h2is the proportion
of total phenotypic variance that is attributable to all genetic sources. Total phenotypic variance is constrained to a value of 1; therefore, all nongenetic contributions to the phenotype are equal to 1⫺ h2. We used
SOLAR in two ways. First, we used SOLAR to determine heritability in the total surface area, average depth, and regional variation in CS depth for the left and right hemisphere. Second, we used the bivariate function within SOLAR to calculate genetic correlations between CS depth mea-sures in the left and right hemispheres along the superior–inferior plane and between depth measures for the left and right hemisphere CS
mea-sures along the superior–inferior plane within the AG⫺ and AG⫹ groups. Heritability estimates and genetic correlations at p⬍ 0.05 or less were considered significant.
Results
Descriptive data
Because there are very little data available on CS morphology in
nonhuman primates, we initially performed some descriptive
analyses. Shown in
Table 1
is the average overall CS surface area
and mean depth for male and female chimpanzees scanned at 1.5,
3, and 7 T. For the overall surface area and mean CS depth, we
performed two mixed-model ANCOVAs with sex and rearing
history serving as the between-group factors and scanner and age
as the covariates. Hemisphere was the repeated measure. For
sur-face area, we found a main effect for sex of F
(1,255)⫽ 8.698, p ⫽
0.003. Not surprisingly, males had significantly larger CS surface
areas than females. No other main effects or interactions were
significant. However, we did find that the covariate scanner was
significant (F
(1,259)⫽ 17.145, p ⫽ 0.000). The average surface area
for chimpanzees scanned at 1.5 T was smaller than those scanned
at 3 and 7 T (
Table 1
). For the mean CS depth, no significant main
effects or interactions were found; however, as was the case with
surface area, scanner was a significant covariate (F
(1,259)⫽ 40.946,
p
⫽ 0.000). The average mean CS depth was lower in chimpanzees
scanned at 1.5 T compared with those scanned at 3 and 7 T (
Table 1
).
For the parameterization data, we performed two
mixed-model ANCOVAs with sex serving as the between-group factor
and scanner and age as the covariates. For one analysis, the mean
CS depth for the 20 regions was the repeated measure and, for the
second analysis, the repeated measure was the CS difference
score. For the mean CS depth, significant main effects for CS
region (F
(19,4788)⫽ 214.25, p ⫽ 0.000) and sex (F
(1,252)⫽ 5.729,
p
⫽ 0.017) were found, as well as a two-way interaction between
sex and CS region (F
(19,4788)⫽ 2.241, p ⫽ 0.002). The mean CS
depths for male and female chimpanzees are shown in
Figure 5
.
First, for both males and females and consistent with previous
reports, chimpanzees showed the classically described pattern of
CS depth with higher peaks at the inferior and posterior regions
Figure 3. a, 3D rendering from BrainVISA of chimpanzee brain with the CS extracted from the image to illustrate the sulcus
dimensions of length and depth along the superior–inferior plane (b) and estimated location of different motor functions based on the original studies byBailey et al. (1950)(c).
and shallower depth in the central portion. Second, with respect
to the sex-by-region interaction, post hoc analysis indicated that
males had larger CS depths at positions 4, 5, 6, 7, 8, and 20. We
also found that the covariate scanner was significant (F
(2,252)⫽
7.553, p
⫽ 0.001). The overall CS depth was lower in chimpanzees
scanned at 1.5 T (mean
⫽ 12.88, SE ⫽ 0.074) compared with
those scanned at 3 T (mean
⫽ 13.36, SE ⫽ 0.104) and 7 T
(mean
⫽ 13.17, SE ⫽ 0.135). For the CS difference scores, no
significant main effects or interactions were found.
Heritability in total CS surface area and depth
In the initial analysis, heritability estimates in overall surface area
and depth measures for the left and right hemisphere and the
average between the two measures were derived using SOLAR.
Covariates included sex, age, rearing history, and scanner. The
results are shown in
Table 2
. Significant heritability was found for
the overall, left, and right surfaces areas and average depths. Sex
and scanner were significant covariates for the surface area and
depth measures. As noted above, males had larger surface areas
and depths than females and the chimpanzees scanned at 1.5 T
had smaller surface areas and depths than chimpanzees scanned
at 3.0 T and scanned postmortem. We also performed genetic
correlations between the overall left and right surface areas and
depth measures. For surface area, significant genetic (RhoG
⫽
0.96, p
⫽ 0.021) and environmental (RhoE ⫽ 0.479, p ⫽ 0.0002)
correlations were found. Similarly, for mean depth, significant
genetic (RhoG
⫽ 0.98, p ⫽ 0.021) and environmental (RhoE ⫽
0.421, p
⫽ 0.002) correlations were found.
Heritability in CS depth from the superior to
inferior positions
In the next set of analyses, we computed the heritability estimates
for the parameterized depth measures that were computed along
Figure 4. 3D rendering of the CS. a, 3D rendering of the CS extracted from the cortical graph and oriented on a horizontal axis where the left end of the sulcus represents the superior end (y⫽0) and the right the inferior tip ( y⫽ 100). b, Sulcus parameterized to create a normalized x-/y-coordinate system with the bottom ridge of the sulcal mesh (i.e., the sulcal fundus; x ⫽ 100) and the top ridge (i.e., at the brain envelope; x⫽ 1) representing the x-axis. The end points of the sulcus where these top and bottom ridges join represent the y-axis. c, Depth measured from the brain envelope to the fundus of the sulcus along 100 sulcal length positions in a superior-to-inferior mesh surface. d, Finally, from the output text file, we can determine the maximum superior point (SP) of the CS by finding the largest depth value between positions 1–50. The maximum inferior point (IP) is represented by the largest depth value found between positions 51 to 100. The pli de passage frontoparietal moyen (PPFM) is the lowest depth value between the SP and IP positions.
Table 1. Descriptive data on CS surface area and mean depth
Scanner Females Males Mean Surface area, mm2 1.5 T 1410.39 (20.80) 1533.05 (32.49) 1417.72 (20.80) 3 T 1595.53 (32.43) 1643.26 (72.77) 1619.40 (39.87) 7 T 1580.10 (53.02) 1527.01 (48.02) 1553.56 (35.71) Mean 1528.67 (23.7) 1567.77 (31.02) Mean CS depth, mm 1.5 T 8.941 (0.100) 9.191 (0.130) 9.066 (0.083) 3 T 9.466 (0.129) 9.631 (0.290) 9.548 (0.159) 7 T 9.866 (0.211) 9.638 (0.191) 9.752 (0.142) Mean 9.424 (0.093) 9.487 (0.124)
Figure 5. Mean depth (in millimeters) averaged from both the left and right hemispheres distributed along the superior–inferior y-axis of the CS for male chimpanzees (solid square) and female chimpanzees (open circle line).
the superior–inferior plane. As before, age, sex, scanner, and
rear-ing were covariates in each analysis. The h
2estimates for each
region of the 20 regions for the left and right hemispheres, as well
as the average between the two, are shown in
Figure 6
. For the
mean CS depth at each position, significant heritability was found
at positions 3 to 8, 15, 16, and 17 (
Fig. 6
). For the left hemisphere,
significant heritability was found at positions 4 to 8 and 20. For
the right hemisphere, significant heritability was found at
posi-tions 3 to 8 as well as posiposi-tions 15, 16, and 17. Last, for the
difference scores at each CS position, none of the heritability
estimates was significant. Therefore, there was no evidence that
asymmetries in CS depth were heritable.
Brain– behavior phenotypic associations
In the next analysis, we compared the average CS depth, (R
⫹
L)/2, and asymmetry in CS depth, R
⫺ L, at positions 1–20 in
relation to sex, gesture handedness, and vocal grouping in two
ANCOVAs. For each analysis, CS position was the repeated
mea-sure and sex, gesture handedness, and vocal grouping were the
between-group factors. Age and scanner were covariates. For the
average depths, we found a significant sex-by-region interaction
(F
(17,3485)⫽ 2.176, p ⫽ 0.003). Post hoc analysis indicated that
males had larger mean depth values than females for positions
3–7 and no significant differences were found for the remaining
regions.
For the asymmetry measures, we found a significant main
effect for gesture handedness (F
(2,237)⫽ 4.117, p ⫽ 0.016) and a
significant three-way interaction between sex, vocal grouping,
and region (F
(19,4503)⫽ 1.826, p ⫽ 0.015). For the gesture
hand-edness main effect, post hoc analysis revealed that the difference
scores were significantly lower in right-handed chimpanzees
(mean
⫽ ⫺0.122) compared with ambiguously handed (mean ⫽
⫹0.304) and left-handed (mean ⫽ ⫹0.166) chimpanzees. The
mean difference scores for each position and vocal group are
shown in
Figure 7
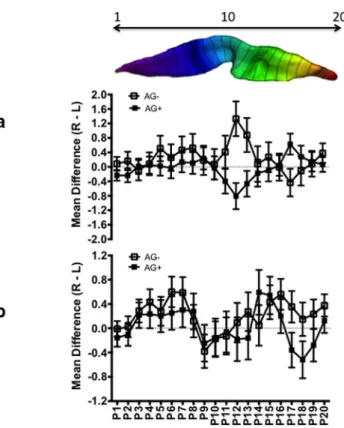
, a and b, for males and females. Post hoc
anal-ysis indicated that, in females, difference scores were significantly
more leftward in AG
⫹compared with AG
⫺individuals at
posi-tion 17. No other significant differences between AG
⫹and AG
⫺individuals were found among females. For males, AG
⫹individ-uals had significantly greater leftward difference scores at
posi-tions 12 and 13 than AG
⫺chimpanzees. In addition, at position
17 and, in contrast to females, AG
⫹individuals had significantly
greater rightward differences scores than AG
⫺chimpanzees. As
can be seen in
Figure 7
, a and b, the pattern of asymmetry differs
substantially between AG
⫹and AG
⫺individuals differ from
po-sitions 10 –19, those regions corresponding to the middle and
inferior CS.
Genetic associations between AG sound production and
CS depth
In this analysis, we tested whether the phenotypic relationship
between AG sound production and CS depth was explained by a
common set of genes underlying their expression. For this
anal-ysis, using SOLAR, we performed genetic correlations between
AG sound production and overall left and right CS surface area
and mean depth and the CS depth measures for the left and right
hemispheres at positions 4, 5, 6, 7, 8, 9, 16, 17, and 18. These CS
positions were selected because the previous analyses found these
Table 2. Heritability in overall CS surface area and depth with covariates of scanner and sex (Nⴝ 264) h2 SE p Variance Surface area Left 0.374 0.119 0.0001 0.099 Right 0.339 0.117 0.0002 0.088 Mean 0.403 0.118 0.0001 0.102 Mean depth Left 0.286 0.148 0.010 0.157 Right 0.183 0.116 0.035 0.137 Mean 0.298 0.140 0.006 0.173
Figure 6. h2estimates for positions 1–20 along the superior to inferior plane. Black triangle
is the average for the left and right hemisphere, red square is the left hemisphere, and blue circle is the right hemisphere.
Figure 7. Mean (⫾SE) CS depth asymmetry values for positions 1–20 for AG⫹and AG⫺ chimpanzees. a, Males. b, Females. On the top is a horizontal view of the CS from the superior (0) to inferior (20) position to illustrate the location of the effect of AG sound use on variation in CS depth asymmetry.
measures to be significantly heritable (see above). None of the
genetic correlations was significant.
Heritability in CS depths in AG
ⴚand AG
ⴙchimpanzees
Finally, as a means of further examining the role of genetic and
experiential factors on variation in CS depth, we performed
sep-arate heritability analyses in the AG
⫺and AG
⫹chimpanzees. We
reasoned that, if learning to produce AG sounds had some
con-sequence on the genetic determination in CS depth either for the
left or right hemisphere, then heritability estimates would be
higher in AG
⫺compared with AG
⫹chimpanzees. The results of
these analyses are shown in
Figure 8
. For the AG
⫺chimpanzees,
significant heritability in mean CS depths were found at positions
4 –11, as well as 16, 17, and 18. In contrast, in the AG
⫹sample,
significant heritability was found only at positions 4 and 5.
There-fore, heritability in average CS depth was far more robust within
the AG
⫺compared with the AG
⫹chimpanzees, particularly in
the central and inferior regions.
Discussion
Several findings were revealed in this study. First, overall CS
sur-face area and mean depth are significantly heritable in
chimpan-zees. These results are consistent with previous findings in
humans, chimpanzees, and baboons (
Kochunov et al., 2005
;
Rog-ers et al., 2007
;
Kochunov et al., 2010
;
Rogers et al., 2010
;
McKay
et al., 2013
;
Go´mez-Robles et al., 2015
) and indicate that the
development of the overall CS surface area and depth are
influ-enced by genetic factors. Notwithstanding, our findings also
show that, when considering CS depth along the superior to
in-ferior plane, significant heritability within the left and right
hemi-spheres are most pronounced in the regions superior to the
pli-de-passage, more spurious in the inferior regions, and absent in
the central region. From a comparative perspective, the pattern of
heritability and genetic correlations in CS depth along the
supe-rior to infesupe-rior plane are quite similar to the findings reported in
humans by
McKay et al. (2013)
.
A second important finding of this study revealed that
chim-panzees who produce AG sounds and those who preferentially
gesture with the right hand show larger CS surface areas than
those chimpanzees who do not produce AG sounds or who are
left-handed or ambiguously handed for manual gestures. The
results also indicate that CS depth in the inferior portion of sulcus
is greater in the left hemisphere in AG
⫹compared with AG
⫺chimpanzees, particularly among males. We believe that the
dif-ference in CS depth reported here between the AG
⫹and AG
⫺chimpanzees reflect cortical reorganization, particularly in the
inferior regions where motor control of orofacial musculature is
represented. Three sets of findings in this report support this
conclusion. First, there were no significant genetic correlations
between AG sound production and CS depth at those positions
that were heritable. Second, recall that heritability in CS depth
along the superior to inferior plane was much more robust in
AG
⫺compared with AG
⫹chimpanzees, suggesting that learning
to produce these sounds likely altered the pattern of heritability in
CS depth (
Fig. 8
). Third, the most robust association between AG
sound production and CS depth were in regions that were found
not to be heritable.
Although the most parsimonious explanation for our findings
is that AG sounds are socially learned rather than determined
exclusively by genetic factors (
Taglialatela et al., 2012
), we cannot
rule out alternative explanations. Notably, it may be the case that
differences in CS depth resulted in some chimpanzees being able
to learn to produce AG sounds, whereas others did not. Given the
design of this study, we cannot resolve these two different
expla-nations, a problem not unlike the differences in cortical
organi-zation often reported in human structure–function comparisons
between, for example, musicians and nonmusicians (
Gaser and
Schlaug, 2003
;
Li et al., 2010
) or under conditions of forced hand
use (
Klo¨ppel et al., 2010
). Notwithstanding this limitation, the
results reported here provide the first evidence of an association
between orofacial motor control and cortical organization in
nonhuman primates and therefore represent an important
find-ing (but see
Coude´ et al., 2011
). Importantly, the collective
find-ings on the neurogenomic correlates of AG sound production
provide solid additional support for the notion that their use is in
chimpanzees is under voluntary control by the emitters and AG
sounds are ultimately related to brain specialization for
commu-nication.
With respect to lateralization, we found differences between
AG
⫹and AG
⫺chimpanzees for the central and inferior CS mean
depth and this was particularly the case for males. Previous
stud-ies have reported left hemisphere asymmetrstud-ies in the production
of AG sounds in chimpanzees (
Losin et al., 2008
;
Taglialatela et
al., 2008
;
Taglialatela et al., 2011
) and the results reported here, at
least for mean depth, are consistent with these observations. It is
possible that asymmetries in facial expressions associated with
the production of AG sounds might better predict asymmetries in
the inferior CS depth; however, unfortunately, these data are not
available for the subjects in this study. This possibility should be
explored in future studies.
Regarding the sex effect of AG sound production and CS
asymmetry, it is important to note that a higher proportion of
captive male chimpanzees produce AG sounds than females (
Ta-glialatela et al., 2012
) and similar findings have been reported for
wild individuals (
Watts, 2016
). Indeed, within the sample of
chimpanzees in this study, a significantly higher proportion of
males (60%) produced AG sounds compared with females (41%)
(
2(1,240)
⫽ 5.297, p ⫽ 0.021). Therefore, the stronger association
between AG sound production and CS depth was likely
attribut-able to the fact that this communicative behavior was exhibited
more consistently in males compared with females. Recently,
Hopkins et al. (2016)
reported that the association between
mea-sures of brain asymmetry and interhemispheric connectivity also
differ between male and female chimpanzees. Males with larger
absolute brain asymmetries show reduced interhemispheric
con-nectivity compared with females. Combining these findings with
the results reported here suggest that one reason for the reported
sex difference in AG sound production and CS asymmetry is the
fact that these anatomical regions are simply more lateralized in
male compared with female chimpanzees.
Figure 8. h2estimates for positions 1–20 along the superior to inferior plane for AG⫺ (circles) and AG⫹(squares) chimpanzees.
One limitation of this study was the fact that we classified
chimpanzees into two discrete behavioral categories, AG
⫹and
AG
⫺. Indeed, it could be argued that AG sound production lies
on a continuum instead of a dichotomous scale. Certainly, there
are individual differences in the frequency of AG sound
produc-tion across chimpanzees, but the problem with trying to
charac-terize the distribution on a continuum is that there are many
subjects that do not produce any AG sounds. Therefore, there
would be a large number of individuals with a score of zero and
then some variable distribution of individuals who produce one
or more AG sounds within the context of any given experimental
paradigm. For example, in the study by
Leavens et al. (2010)
, the
communicative behavior of 110 chimpanzees was examined
dur-ing a 30 s test when a human was lookdur-ing directly at the focal
subject or a chimpanzees immediately adjacent to the focal
chim-panzee. In terms of AG sound production, 63 chimpanzees failed
to produce an AG sound in either test condition. For the
remain-ing 47 chimpanzees, AG sound production ranged from 1 to 15
occurrences. From a statistical standpoint, treating AG sound
production as a continuous variable would be challenging and
would not lend itself to correlational types of analyses due to the
skewed nature of the distribution. Therefore, the most
straight-forward and powerful approach was to simply characterize the
subjects as producing AG sounds or not (as we did in this study).
In addition, one variable that we were unable to control for
was the duration of time that chimpanzees may have been
pro-ducing AG sounds. In other words, chimpanzees may have
ac-quired the use of AG sounds at different points in life relative to
the time that MRI scans were obtained. If changes in cortical
folding and organization are attributable to the acquisition and
use of AG sounds (rather than the opposite), then the time since
the chimpanzee began using AG sounds would be an important
variable to consider. Unfortunately, longitudinal data are not
available on the acquisition of AG sounds in these two colonies of
chimpanzees, so we cannot address this issue. However, we have
found that the classification of subjects as AG
⫹or AG
⫺as
as-sessed at two time points separated by at least 7 years showed that
72% of the chimpanzees were classified in the same way.
There-fore, many of the AG
⫹subjects reliably produced these sounds
for an extended period of time before the acquisition of the MRI
scans.
In conclusion, it has been hypothesized that voluntary control
of the vocal apparatus and associated orofacial musculature was
an important step in the evolution of spoken language (
Premack,
2004
;
Lieberman, 2007
;
Fitch, 2010
). Therefore, those individuals
early in Hominin evolution who were able to develop these skills
may have enjoyed increased fitness compared with other
individ-uals who were not capable of such flexibility in their
communi-cative behavior. Indeed, data from wild chimpanzees indicate
that the use of AG
⫺-related sounds such as splutters or
“raspber-ries” has an important social function, including the promotion
of social bonds, social proximity, and reduction in tension
(
Fedurek et al., 2015
;
Watts, 2016
). The facilitation of these
in-teractions would have been particularly advantageous in
circum-stances when the hands were not available for the purposes of
producing gestures used in interspecific communication. This
scenario is consistent with the gossip hypothesis and the function
of these sounds in the context of grooming (
Dunbar, 1996
,
1998
;
Dunbar and Schultz, 2007
;
Leavens et al., 2014
). In short,
selec-tion for increasing prosocial and cooperative behaviors within the
context of grooming may have simultaneously selected for
in-creasing motor control of the vocal and orofacial musculature
needed for speech. These collective selective pressures may have
been a driving force for expansion in cortical organization and
gyrification within the human brain after the split from the
com-mon ancestor with chimpanzees.
References
Almasy L, Blangero J (1998) Multipoint quantitative-trait linkage analysis in general pedigrees. Am J Hum Genet 62:1198 –1211.CrossRef Medline
Bailey P, von Bonin G, McCulloch WS (1950) The isocortex of the chim-panzee. Urbana-Champaign: University of Illinois.
Cartmill EA, Byrne RW (2007) Orangutans modify their gestural signaling according to their audience’s comprehension. Curr Biol 17:1345–1348.
CrossRef Medline
Coude´ G, Ferrari PF, Roda` F, Maranesi M, Borelli E, Veroni V, Monti F, Rozzi S, Fogassi L (2011) Neurons controlling voluntary vocalization in the macaque ventral premotor cortex. PLoS One 6:e26822.CrossRef Medline
Coulon O, Clouchoux C, Operato G, Dauchot K, Sirigu A, Anton JL (2006) Cortical localization via surface parameterization: a sulcus-based ap-proach. Neuroimage 31:S46.
Dunbar RIM (1996) Grooming, gossip, and the evolution of language. Cambridge, MA: Harvard University.
Dunbar RIM (1998) The social brain hypothesis. Evol Anthropol 6:178 –190. Dunbar RIM, Schultz S (2007) Evolution of the social brain Science 317:
1344 –1347.CrossRef
Fears SC, Melega WP, Service SK, Lee C, Chen K, Tu Z, Jorgensen MJ, Fairbanks LA, Cantor RM, Freimer NB, Woods RP (2009) Identifying heritable brain phenotypes in an extended pedigree of vervet monkeys. J Neurosci 29:2867–2875.CrossRef Medline
Fears SC, Scheibel K, Abaryan Z, Lee C, Service SK, Jorgensen MJ, Fairbanks LA, Cantor RM, Freimer NB, Woods RP (2011) Anatomic brain asym-metry in vervet monkeys. PLoS One 6:e28243.CrossRef Medline
Fedurek P, Slocombe KE, Hartel JA, Zuberbu¨hler K (2015) Chimpanzee lip-smacking facilitates cooperative behaviour. Sci Rep 5:13460.CrossRef Medline
Fitch WT (2010) The evolution of language. Cambridge: Cambridge University.
Gaser C, Schlaug G (2003) Brain structures differ between musicians and non-muscians. J Neurosci 23:9240 –9245.Medline
Gentry E, Neumann C, Zuberbu¨hler K (2015) Bonobos modify communica-tion signals according to recipient familiarity. Sci Rep 5:16442.CrossRef
Go´mez-Robles A, Hopkins WD, Schapiro SJ, Sherwood CC (2015) Relaxed genetic control of cortical organization in human brains compared to chimpanzees. Proc Natl Acad Sci U S A 112:14799 –14804.CrossRef Medline
Hopkins WD, Cantero M (2003) From hand to mouth in the evolution of language: the influence of vocal behavior on lateralized hand use in man-ual gestures by chimpanzees (Pan troglodytes). Dev Sci 6:55– 61.CrossRef
Hopkins WD, Russell J, Freeman H, Buehler N, Reynolds E, Schapiro SJ (2005) The distribution and development of handedness for manual ges-tures in captive chimpanzees (Pan troglodytes). Psychol Sci 16:487– 493.
CrossRef Medline
Hopkins WD, Taglialatela JP, Leavens DA (2007) Chimpanzees differen-tially produce novel vocalizations to capture the attention of a human. Anim Behav 73:281–286.CrossRef Medline
Hopkins WD, Taglialatela J, Leavens DA, Russell JL, Schapiro SJ (2010) Be-havioral and brain asymmetries in chimpanzees. In: The mind of the chimpanzee (Lonsdorf EV, Ross SR, Matsuzawa T, eds), pp 60 –74. Chi-cago: University of Chicago.
Hopkins WD, Taglialatela JP, Leavens DA (2011) Do chimpanzees have vol-untary control of their facial expressions and vocalizations? In: Primate communication and human language: vocalisation, gestures, imitation and deixis in humans and non-humans (Vilain A, Schwartz J-L, Abry C, Vauclair J, eds), pp 71–90. Amsterdam: John Benjamins.
Hopkins WD, Keebaugh AC, Reamer LA, Schaeffer J, Schapiro SJ, Young LJ (2014a) Genetic influences on receptive joint attention in chimpanzees (Pan troglodytes). Sci Rep 4:3774.CrossRef Medline
Hopkins WD, Meguerditchian A, Coulon O, Bogart S, Mangin JF, Sherwood CC, Grabowski MW, Bennett AJ, Pierre PJ, Fears S, Woods R, Hof PR, Vauclair J (2014b) Evolution of the central sulcus morphology in pri-mates. Brain Behav Evol 84:19 –30.CrossRef Medline
Hopkins WD, Hopkins AM, Misiura M, Latash EM, Mareno MC, Schapiro SJ, Phillips KA (2016) Sex differences in the relationship between planum temporale asymmetry and corpus callosum morphology in
panzees (Pan troglodytes): A combined MRI and DTI analysis. Neuropsy-chologia 93:325–334.CrossRef Medline
Klo¨ppel S, Mangin JF, Vongerichten A, Frackowiak RS, Siebner HR (2010) Nuture versus nature: Long-term impact of forced right-handedness on structure of pericentral cortex and basal ganglia. J Neurosci 30:3271– 3275.CrossRef Medline
Kochunov P, Mangin JF, Coyle T, Lancaster J, Thompson P, Rivie`re D, Cointepas Y, Re´gis J, Schlosser A, Royall DR, Zilles K, Mazziotta J, Toga A, Fox PT (2005) Age-related morphology trends in cortical sulci. Hum Brain Mapp 26:210 –220.CrossRef Medline
Kochunov P, Glahn DC, Fox PT, Lancaster JL, Saleem K, Shelledy W, Zilles K, Thompson PM, Coulon O, Mangin JF, Blangero J, Rogers J (2010) Ge-netics of primary cerebral gyrification: Heritability of length, depth and area of primary sulci in an extended pedigree of Papio baboons. Neuro-image 53:1126 –1134.CrossRef Medline
Leavens DA, Hopkins WD, Bard KA (2008) The heterochronic origins of explicit reference. In: The shared mind: Perspective on intersubjectivity (Zlatev J, Racine TP, Sinha C, Itkonen E, eds), pp 187–214. Amsterdam: John Benjamins.
Leavens DA, Taglialatela JP, Hopkins WD (2014) From grasping to groom-ing to gossip: Innovative use of chimpanzee signals in novel environments supports both vocal and gestural origins theories of language origins. In: The evolution of social communication in primates (Pina M, Gontier N, eds). Switzerland: Springer International.
Leavens DA, Russell JL, Hopkins WD (2010) Multimodal communication by captive chimpanzees (Pan troglodytes). Anim Cogn 13:33– 40.CrossRef Medline
Li S, Han Y, Wang D, Wang H, Fan Y, Lv Y, Tang H, Gong Q, Zang Y, He Y (2010) Mapping surface variability of the central sulcus of musicians Cereb Cortex 20:25–33.CrossRef
Liebal K, Pika S, Call J, Tomasello M (2004) To move or not to move: how apes adjust to the attentional state of others. Interaction Studies 5:199 – 219.CrossRef
Lieberman P (2007) The evolution of human speech: Its anatomical and neural bases. Curr Anthropol 48:39 – 66.CrossRef
Losin EA, Freeman H, Russell JL, Meguerditchian A, Hopkins WD (2008) Left hemisphere specialization for orofacial movements of learned vocal signals by captive chimpanzees. PLoS One 3:e2529.CrossRef Medline
Mangin JF (2000) Entropy minimization for automatic correction of inten-sity nonuniformity. In: Mathematical Methods of Biomedical Image Analysis, pp 162–169. Hilton Head, SC: IEEE.
Mangin JF, Rivie`re D, Cachia A, Duchesnay E, Cointepas Y, Papadopoulos-Orfanos D, Collins DL, Evans AC, Re´gis J (2004) Object-based
mor-phometry of the cerebral cortex. Medical Imaging 23:968 –982.CrossRef Medline
McKay DR, Kochunov P, Cykowski MD, Kent JW Jr, Laird AR, Lancaster JL, Blangero J, Glahn DC, Fox PT (2013) Sulcus depth-position profile is a genetically mediated neuroscientific trait: description and characteriza-tion in the central sulcus. J Neurosci 33:15618 –15625.CrossRef Medline
Penfield W, Boldrey E (1936) Somatic motor and sensory representation in the cerebral cortex of man as studied by electrical stimulation. Brain 60:389 – 443.
Poss SR, Kuhar C, Stoinski TS, Hopkins WD (2006) Differential use of at-tentional and visual communicative signaling by orangutans (Pongo
pygmaeus) and gorillas (Gorilla gorilla) in response to the attentional
sta-tus of a human. Am J Primatol 68:978 –992.CrossRef Medline
Premack D (2004) Is language the key to human intelligence? Science 303: 318 –320.CrossRef Medline
Rogers J, Kochunov P, Lancaster J, Shelledy W, Glahn D, Blangero J, Fox P (2007) Heritability of brain volume, surface area and shape: an MRI study in an extended pedigree of baboons. Hum Brain Mapp 28:576 –583.
CrossRef Medline
Rogers J, Kochunov P, Zilles K, Shelledy W, Lancaster J, Thompson P, Dug-girala R, Blangero J, Fox PT, Glahn DC (2010) On the genetic architec-ture of cortical folding and brain volume in primates. Neuroimage 53: 1103–1108.CrossRef Medline
Taglialatela JP, Russell JL, Schaeffer JA, Hopkins WD (2008) Communica-tive signaling activates “Broca’s” homologue in chimpanzees. Curr Biol 18:343–348.CrossRef Medline
Taglialatela JP, Russell JL, Schaeffer JA, Hopkins WD (2011) Chimpanzee vocal signaling points to a multimodal origin of human language. PLoS One 6:e18852.CrossRef Medline
Taglialatela JP, Reamer L, Schapiro SJ, Hopkins WD (2012) Social learning of a communicative signal in captive chimpanzees. Biol Lett 8:498 –501.
CrossRef Medline
Theall LA, Povinelli DJ (1999) Do chimpanzees tailor their gestural signals to fit the attentional state of others? Anim Cogn 2:207–214.CrossRef
Wallez C, Schaeffer J, Meguerditchian A, Vauclair J, Schapiro SJ, Hopkins WD (2012) Contrast of hemispheric lateralization for orofacial move-ments between learned attention-getting sounds and species-typical vocalizations in chimpanzees: Extension in a second colony. Brain Lang 123:75–79.CrossRef Medline
Watts DP (2016) Production of grooming-associated sounds by chimpan-zees (Pan troglodytes) in Ngogo: variation, social learning and possible functions. Primates 57:61–72.CrossRef Medline