HAL Id: hal-02480072
https://hal.archives-ouvertes.fr/hal-02480072
Submitted on 14 Feb 2020
HAL is a multi-disciplinary open access
archive for the deposit and dissemination of
sci-entific research documents, whether they are
pub-lished or not. The documents may come from
teaching and research institutions in France or
abroad, or from public or private research centers.
L’archive ouverte pluridisciplinaire HAL, est
destinée au dépôt et à la diffusion de documents
scientifiques de niveau recherche, publiés ou non,
émanant des établissements d’enseignement et de
recherche français ou étrangers, des laboratoires
publics ou privés.
A NEW PROPOSED SHEPHERD MODEL OF A
LI-ION OPEN CIRCUIT BATTERY BASED ON
DATA FITTING
Hanane Hemi, Nacer K M’Sirdi, Aziz Naamane
To cite this version:
Hanane Hemi, Nacer K M’Sirdi, Aziz Naamane. A NEW PROPOSED SHEPHERD MODEL OF
A LI-ION OPEN CIRCUIT BATTERY BASED ON DATA FITTING. IMAACA 2019, Sep 2019,
Lisbonne, Portugal. �hal-02480072�
A NEW PROPOSED SHEPHERD MODEL OF A LI-ION OPEN CIRCUIT BATTERY
BASED ON DATA FITTING
Hanane Hemi(a), Nacer K M’Sirdi(b), Aziz Naamane(c)
(a)(b)(c)Aix Marseille University, CNRS, LIS, SASV, Marseille, France
(a)[email protected],(b)[email protected],(c)[email protected]
ABSTRACT
In this paper, the effect of environment parameters on the Lithium ion (Li-ion) battery behaviour is studied. In fact, the experimental database collected from a Lithium-ion battery is used to study its dynamic behaviour and then propose a dynamic battery model who can describe the relationship between the Open Circuit Voltage (OCV ), the State Of Charge (SOC) and the ambient
temperature (Ta). The proposed Shepherd model of a
Li-ion open circuit battery voltage OCV is adjusted by using the experimental database of the CALCE battery
groupCALCEand then this model is implemented and
simulated by using MATLAB/Simulink tools.
Keywords : Data fitting; Li-ion battery; LiFePO4; Open Circuit Voltage; State Of Charge; Electrical vehicle.
1. INTRODUCTION
Energy storage with the Lithium ion (Li-ion) batteries are nowadays more and more deployed in many appli-cations such in e-mobility and stationary storage. The rechargeable Li-ion in the electrical or the hybrid ve-hicles (EV/HEV) represent 72 % of the total
recharge-able Li-ion battery cell market’s value in 2022
know-made.com(2017).
In fact, Li-ion batteries technology has a high
power/energy density, with high cell voltage. In addition,
it has a high life span, and a low self discharge rateTian
et al.(2017)Waldmann et al.(2018).
For Example, in hybrid and electrical vehicles applica-tion, a Li-ion battery pack is considered as a secondary source of power, and it used to support and to reduce the fuel consumption from the primary source of power. Dur-ing a drivDur-ing cycle, Li-ion battery can assist a primary source of power during acceleration and can be charged either per it or by recovering braking energy during de-celeration. Then, it plays a significant role in the overall efficiency. It allows also to reduce the consumption of the primary power source (as for example, the consump-tion of a hydrogen in the case of a fuel cell vehicle, or the consumption of the conventional fuel in the case of the Hybrid electric-petroleum vehicles).
However, some environmental or conditions of operation
can have a negative effect on its behavior (current, volt-ages and State of Charge) and also on its life span. The influence of environmental conditions like ambient and storage system temperatures are very important factors that can help to predict its life time decrease and to pre-vent the probability of its damage and thermal runaway. Therefore, a good knowledge of the system heating and the heat transfer by the battery cell and then the battery pack, becomes crucial.
To protect battery pack from these inconveniences. A Battery Management System (BMS) has to be added to
the system. The BMS will indeed may avoid
under-voltage / over-under-voltage, short-circuit and thermal runaway of the battery pack and the then system can operates in
safe zoneCastano et al.(2015).
Modeling the behaviour of a Li-ion battery becomes then paramount to study a battery performance, depending on several external or internal conditions. In another hand, a behaviour model is useful to estimate and predict the current and future battery state variables. Its use is also interesting to manage the control for a safe battery oper-ation on the other.
In this part, we focus our study on the influence of am-bient temperature on battery performance. In particular, the impact of temperature on battery open circuit voltage (OCV ).
In fact, the ambient temperature has a significant im-pact on battery State Of charge (SOC). Then an esti-mation and / or a prediction of the battery SOC will be harder and then it will be harder too to know the optimal charge/discharge range to control of batteries. However, knowing that OCV and SOC are dependent on ambient temperature, it is important to model this dependence by studying data from experimental battery measurement. This paper is structured in three sections and a
conclu-sion.The section2. describes the experimental data and
Test Analysis. The section 3. presents and describes
the Lithium Ion battery standard OCV model equations.
The section4.presents the Lithium Ion battery Proposed
OCV Model. Section5. presents the conclusions on our
2. EXPERIMENTAL DATA AND TEST ANALY-SIS
In this paper, the A123 battery cell has been selected. This battery is a LiFePO4 battery and its database had
been proposed by the CALCE battery group CALCE
Xing et al. (2014). This choice of this type of battery is motivated by the fact that is typically used in HEV ap-plications.
The objective of this section is to present a battery data. In fact, by managing and analyzing this data, the relation-ship between the OCV , SOC at different ambiant
temper-atures (Ta) can be shown. In order to ensure this, a
low-current OCV method had been used and provided for this test.
In fact, the Low-current OCV test consist by using a small current to charge and discharge the battery and then mea-sure the battery output voltage. In this test, this output voltage is approximately equal to the OCV . This test had been performed for different ambient temperature
vary-ing from Ta = −10◦C to Ta = 50◦C with interval of
∆Ta = 10◦C.
For each temperature, in the first step, the battery had been discharged at a constant current rate of C/20 until the output voltage reach to the value of lower cut-off volt-age of 2 V . Then, in the second step, the battery had been charge using a constant current until the out put voltage reached the upper cut-off voltage of 3.6 V . These char-acteristics are given by battery manufacturer for battery
security operation. Tab.1 shows the battery
characteris-tics given by battery manufacturerA123Systems.
Table 1: Battery characteristics given by battery
manu-facturerA123Systems
Type LiFePO4
Nominal capacity 1.1 Ah
Nominal voltage 3.3 V
Upper cut-off voltage 3.6 V
Lower cut-off voltage 2 V
Maximum continuous discharge current 30 A
Fig. 1 presents the test bench for battery tests
experi-mentsHe et al.(2014). Test bench detail has given by
ReferencesCALCE He et al.(2014).
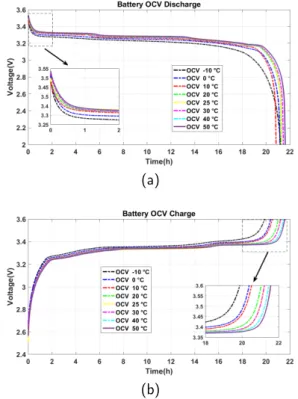
Fig.2a and Fig.2b present the OCV vs time at the
dis-charge and the dis-charge modes. As shown, the battery takes a long time to charge and discharge caused by the nature of this test (the Low-current OCV test). Also, by compar-ing OCV curves at different ambient temperatures, the time taken to charge or discharge a battery and OCV value depends on temperature.
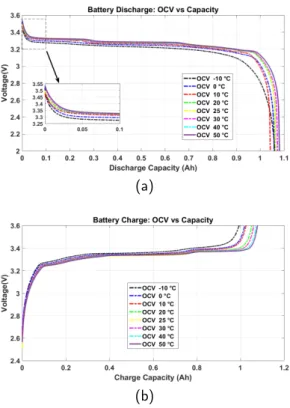
Fig.3aand Fig.3bpresent the OCV vs the Capacity at the
discharge and the charge modes. As shown in figures before, ambient temperature has an impact on battery be-havior. In fact, the relation between OCV and battery capacity in both charge and discharge modes, is affected by the temperature.
As shown, the OCV is different for each temperature. In
fact, at t = 0 s, the value of Vocis different according to
Figure 1: Test bench for battery tests experiments He
et al.(2014)
(a)
(b)
Figure 2: OCV vs time at discharge and Charge mode
temperature. In addition, the value of a couple Voc = 2 V
and battery capacity value at the lower cat-off voltage is
affected. In fact, at 50◦C the discharge capacity value is
higher comparing by lower temperatures. Also, for each
OCVcurve measured at ambient temperature, it is shown
that is has some differences. By comparing the two
tem-perature −10◦C and 50◦C, the battery behavior is
af-fected and then OCV too.
3. LITHIUM ION BATTERY STANDARD OCV
MODEL
Li-ion battery is considered as a part of the HEV system model. Therefore, to predict a HEV behavior in real time, a choice of a battery model is important for a real time
(a)
(b)
Figure 3: OCV vs Capacity at discharge and Charge mode
HEV operation, specially battery SOC for estimation and prediction BMS.
The Shepherd model consider the battery cell model composed by an internal resistance (R) and the open-circuit voltage (OCV ). This model describes the
math-ematical relationship between voltage (VBatt(t)), current
(i(t)) for a constant current discharge. Eq.1and Eq.2
rep-resent this relationshipRaszmann et al.(2017)Li and Ke
(2011).
VBatt(t) = V0− K.Q
Q− i.t.i(t) − R.i(t) (1)
OCV(t) = V0− K.Q
Q− i.t.i(t) (2)
where V0is the constant voltage (V ), Q is the maximum
capacity (Ah), i.t is the discharged capacity (Ah), K is the
polarization constant (Ah)−1and R is internal resistance.
Fig.4 shows the ideal battery curve during discharge
Raszmann et al.(2017). This figure shows that battery has tree zones. The fist one is the exponential zone. This zone presents an exponential curve of battery discharge which is described by two points: from the battery full
charge (0,Vf ull) until the couple (Qexp,Vexp). The second
zone is the nominal zone. this zone began from the end
of exponential zone until the couple (Qnom,Vnom). This
zone shows approximatively constant voltage. The latest zone is the full discharged battery zone. This zone began from the end of nominal zone until full battery discharge
(Qf ull,0). This figure is important to find the battery
pa-rameters to be used in battery equation Eq.1. However,
The Shepherd model equation does not include the expo-nential zone.
Figure 4: Ideal battery curve during dischargeGallo et al.
(2013)
To improve a battery mathematical model to fit to bat-tery charge and discharge curves, the Shepherd model
had been modified by adding some terms. Eq.3and Eq.4
show the OCV at discharge and charge modes
respec-tivelyRaszmann et al.(2017)Gallo et al.(2013)Li and
Ke(2011). If the current is positive, then the battery is
in discharge mode, Voc= Voc.Discharge, as showed in Eq.3.
If the current is negative, then the battery is in the charge
mode, Voc = Voc.Charge, as presented in Eq.4. The SOC
estimation has been given in Eq.5.
Voc.Discharge=V0− K.Q Q− i.t.i ∗ − K.Q Q− i.t.i.t + A ∗ e(−B.i.t) (3) Voc.Charge=V0− K.Q 0.1 ∗ Q − i.t.i ∗ − K.Q Q− i.t.i.t + A.e(−B.i.t) (4) SOC= 1 − 1 Q Z t 0 i(t).dt (5) A= Vf ull−Vexp (6) B= α Qexp (7)
K= β ∗ [Vf ull−Vnom+A(e(−B Qnom)− 1)]∗
Qf ull− Qnom
Qnom
R= Vnom∗ 1 − η
0.2 ∗ Qnom
(9)
V0= Vf ull+ K + R ∗ i1C−rate− A (10)
where A is the exponential voltage (V ) and also presents the amplitude of the exponential zone which is the dif-ference between the voltage of battery fully charged and
the end of the exponentiel voltage Vexpas shown in Eq.6
Raszmann et al.(2017).
Bis the exponential capacity (Ah)−1, or also called the
time constant inverse Eq.7. This parameter is calculated
from the charge capacity at the end of the exponentiel zone and also uses a constant value α. The α value is usually determined to improve the fit to a battery data Raszmann et al.(2017)Ahmed(2017).
K is the polarization constant (Ah)−1 Raszmann et al.
(2017), or also named polarizing voltage/resistance
fac-tor (V )Ahmed(2017) given in Eq.8. This parameter uses
Vf ull value and also the end of nominal zone
parame-ters (Qnom,Vnom). In Ref.Ahmed(2017), the constant β
is added to improve the fit to a battery data.
V0is the constant voltage Eq.10. This parameter describe
the battery voltage when a current is equal to zero
Rasz-mann et al.(2017)Ahmed(2017).
Ris the battery internal resistance (Ω) Eq.9. η is the
ef-ficiency of the battery and i1C−rateis the nominal current.
i∗is the filtered current (A).
Generally, parameters of Eq.3and Eq.4are determined
from battery datasheet provided by the battery manufac-turer, especially from the curve of discharge at 1 C rate. However, those parameters depends on the variation of the temperature and the battery lifetime change. There-fore, The need to study and find the relation between those parameters and temperature is important.
4. LITHIUM ION BATTERY PROPOSED OCV
MODEL
4.1. OCV Model parameter identification
The low-current test had been used on LiFePO4battery
cell to identify the relationship between OCV - SOC and
Ta. For each temperature Ta, the voltage and the SOC
data are used to fit it with the Eq.3by using data fitting,
and then find parameters of this equation. Fig.5presents
a OCV fit and measured comparison for different tem-peratures. In this step, for each temperature, the
param-eters of the Eq.3 are founded by fitting the data to the
curve. Then, seven equations for ambient temperature
from Ta = −10◦C to Ta = 50◦C had been founded.
In addition, the Mean Absolute Error (MAE), the Root Mean Squared error (RMS) and the coefficient of
deter-mination or also named R-squared (R2) are used to
eval-uate the efficiency of the fit as given in Eq.11, Eq.12and
Eq.13. The RMS error will be more sensitive to the
vari-ation of error than MAE due the fact that the calculvari-ation error is squared. In addition the R-squared will show how
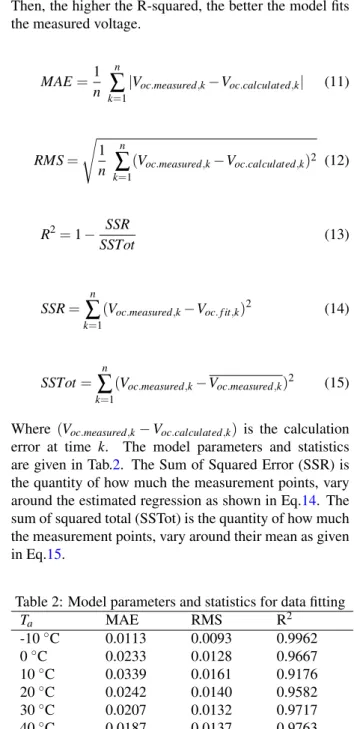
close the data measured are to the fitted regression curve. Then, the higher the R-squared, the better the model fits the measured voltage.
MAE=1 n n
∑
k=1 |Voc.measured,k−Voc.calculated,k| (11) RMS= s 1 n n∑
k=1 (Voc.measured,k−Voc.calculated,k)2 (12) R2= 1 − SSR SSTot (13) SSR= n∑
k=1(Voc.measured,k−Voc. f it,k)2 (14)
SSTot=
n
∑
k=1
(Voc.measured,k−Voc.measured,k)2 (15)
Where (Voc.measured,k− Voc.calculated,k) is the calculation
error at time k. The model parameters and statistics
are given in Tab.2. The Sum of Squared Error (SSR) is
the quantity of how much the measurement points, vary
around the estimated regression as shown in Eq.14. The
sum of squared total (SSTot) is the quantity of how much the measurement points, vary around their mean as given in Eq.15.
Table 2: Model parameters and statistics for data fitting
Ta MAE RMS R2 -10◦C 0.0113 0.0093 0.9962 0◦C 0.0233 0.0128 0.9667 10◦C 0.0339 0.0161 0.9176 20◦C 0.0242 0.0140 0.9582 30◦C 0.0207 0.0132 0.9717 40◦C 0.0187 0.0137 0.9763 50◦C 0.0190 0.01344 0.9761
The next step is to study the relationship between those parameters and temperature. For each ambient
tempera-ture Ta, the following parameters A, B, K, V0are fitted.
Fig.6 presents the exponential voltage (A) vs ambient
temperature. The equation Eq.16 results from this fit
have been chosen as a rational polynomials function. This function has a numerator polynomial and a denom-inator polynomial with a second degree. The degrees of the numerator and the denominator polynomial have been chosen to get the best curve fitting and minimum number of coefficients. The same approach has been used to find the other equations.
Eq.17presents the exponential capacity (B) wich is
0 20 40 60 80 100 SOC (%) 2 2.2 2.4 2.6 2.8 3 3.2 3.4 3.6 Voc (V) V oc at T = -10 °C Voc fit Voc measured (a) 0 20 40 60 80 100 SOC (%) 2 2.2 2.4 2.6 2.8 3 3.2 3.4 3.6 Voc (V) V oc at T = 0 °C Voc fit Voc measured (b) 0 20 40 60 80 100 SOC (%) 2 2.2 2.4 2.6 2.8 3 3.2 3.4 3.6 Voc (V) V oc at T = 10 °C Voc fit Voc measured (c) 0 20 40 60 80 100 SOC (%) 2 2.2 2.4 2.6 2.8 3 3.2 3.4 3.6 Voc (V) V oc at T = 20 °C Voc fit Voc measured (d) 0 20 40 60 80 100 SOC (%) 2 2.2 2.4 2.6 2.8 3 3.2 3.4 3.6 Voc (V) V oc at T = 30 °C V oc fit Voc measured (e) 0 20 40 60 80 100 SOC (%) 2 2.2 2.4 2.6 2.8 3 3.2 3.4 3.6 Voc (V) V oc at T = 40 °C V oc fit Voc measured (f) 0 20 40 60 80 100 SOC (%) 2 2.2 2.4 2.6 2.8 3 3.2 3.4 3.6 Voc (V) V oc at T = 50 °C Voc fit Voc measured (g)
Fig.7 presents the polarization constant (K) vs
tempera-ture. This relationship Eq.18is chosen as a rational
poly-nomials function with a first degree in numerator polyno-mial and a denominator polynopolyno-mial.
Fig.8 shows the constant voltage (V0) vs temperature.
This relationship Eq.19is also chosen as a rational
poly-nomials function. The numerator and denominator are a third and second degree polynomial respectively.
-10 0 10 20 30 40 50 Temperature (°C) 0.14 0.15 0.16 0.17 0.18 0.19 0.2 0.21 0.22 0.23 Voltage (V) A vs Temperature curve fit
Figure 6: Exponential voltage A vs temperature
-10 0 10 20 30 40 50 (°C) 0.015 0.02 0.025 0.03 0.035 0.04 (Ah -1) K vs Temperature curve fit
Figure 7: Polarization constant K vs temperature
A(Ta) = p1Ta2+ p2Ta+ p3 T2 a+ q1Ta+ q2 (16) B(Ta) = p1 (17) K(Ta) = p1Ta+ p2 Ta+ q1 (18) V0(Ta) = p1Ta3+ p2Ta2+ p3Ta+ p4 T2 a + q1Ta+ q2 (19) -10 0 10 20 30 40 50 (°C) 3.27 3.275 3.28 3.285 3.29 3.295 3.3 3.305 (V) E vs temperature curve fit
Figure 8: Constant voltage V0vs temperature
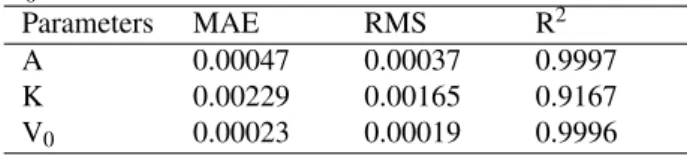
Table 3: Model parameters and statistics for A, K, and
V0
Parameters MAE RMS R2
A 0.00047 0.00037 0.9997
K 0.00229 0.00165 0.9167
V0 0.00023 0.00019 0.9996
Those parameters performance resulting from fitting had
been evaluated by using MAE, RMS and R2as shown in
Tab.3.
The new equation of OCV is given in Eq.20. This
equa-tion highlights the relaequa-tionship between the OCV , SOC, and Ta. Voc.Discharge(i.t,t, i∗, Ta) = V0(Ta) − K(Ta).Q Q− i.t .i ∗ −K(Ta).Q
Q− i.t .i.t + A(Ta) ∗ e (−B.i.t)
(20)
4.2. Validation of the proposed OCV model
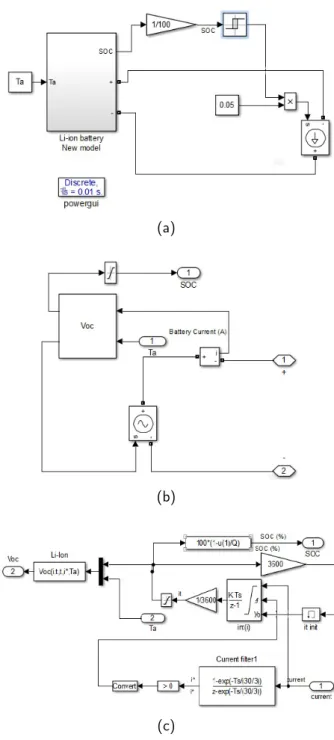
The battery model shown in Fig.9 is used to
simu-late the proposed OCV model. In this case, the MAT-LAB/Simulink software and SimPowerSystems toolbox software packages is used for validation tests. As
men-tioned in section2., the test used in this simulation is the
Low-current OCV test. In fact, it consist by using a small current to charge and discharge the battery.
In this case, the current used to discharge a battery is
equal to 0.05 A as shown in Fig.9a. Therefore, the output
voltage measured is approximately equal to VBatt = Voc
as presented in Fig.9b. The OCV equation (Eq.20) is
im-plemented as shown in the Fig.9c.
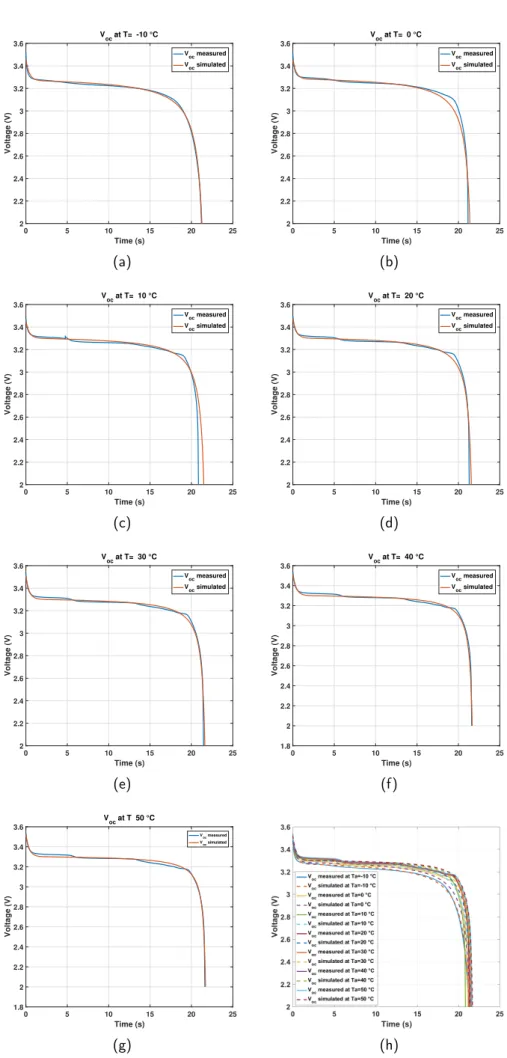
Fig.10 shows the OCV vs time measured and
simu-lated comparison for different temperatures. In addition,
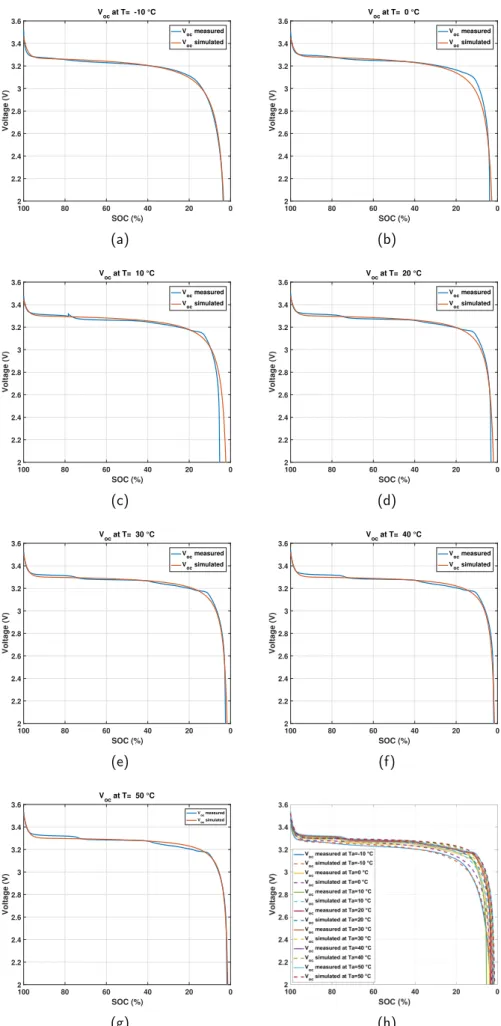
Fig.11shows the OCV vs SOC measured and simulated
comparison for different temperatures.
sim-(a)
(b)
(c)
Figure 9: Battery model
ulations and measurements for ambient temperatures
−10 ◦C, 20 ◦C, 30◦C, 40◦C, and 50 ◦C. However
for ambient temperature 0◦C (Fig.10band Fig.11b) and
10◦C (Fig.10cand Fig.11c), it is shown that the error
is larger at the end of the discharge mode. Fig.10hand
Fig.11hpresent OCV vs time and OCV vs SOC measured
and simulated comparison respectively for all the ambi-ent temperatures.
5. CONCLUSIONS
In this paper, we have proposed and compared the stan-dard and the proposed OCV model. The first one is a Shepherd mathematical model modified and the second one is a proposed model based on a Shepherd
mathemat-ical model modified with the ambient temperature effect included to the model. The model has been fitted by us-ing the experimental database of a LiFePO4 battery
pro-vided from the CALCE battery groupCALCE. Also, the
Low-current OCV test is used in this paper. In fact, this test consist to use a small current to charge and discharge the battery and then measure the battery output voltage. Therefore, the output voltage measured is approximately equal to VBatt= Voc.
The proposed model of a battery has been implemented and simulated by using MATLAB/Simulink tools. The first step of this paper was to analyze a LiFePO4 database and find a relationship between OCV , SOC and
ambient temperature Ta. In this case, a data fitting had
been used to fit a data to a curve. In addition, MAE, RMS
and R2have been used to evaluate the efficiency of the
fit. In fact, the fit results presents a small error between the OCV fitted and measured for the different ambient
temperatures from Ta = −10◦C to Ta = 50◦C.
The second step was to validate the proposed OCV model by simulation. Therefore, the simulation results have allowed to indicate small error between the OCV mea-sured and simulated for the different ambient
tempera-tures. However, for the ambient temperature 0 ◦C and
10◦C, the error is higher mostly in the end of the
dis-charge mode.
In the next work, this model will be improved by reduc-ing this error and also usreduc-ing other tests to study the com-plete battery system including the internal components. ACKNOWLEDGMENT
The author would like to thank Professor Michael
Pecht, from the CALCE battery group for
sharing their experimental data and exchanges
to let us use them for the model validation.
“CALCE:Center for Advanced Life Cycle Engineering” https://web.calce.umd.edu/batteries/index.h
REFERENCES
A123Systems, (). A123 systems high power lithium
ion apr18650m1a datasheet. https://www.
batteryspace.com/prod-specs/6612.pdf.
Ahmed M., (2017). Modeling lithium-ion battery charg-ers in plecs .R
CALCE, (). Center for advanced life cycle
engineer-ing. https://web.calce.umd.edu/batteries/
index.html.
Castano S., Gauchia L., Voncila E., and Sanz J., (2015). Dynamical modeling procedure of a li-ion battery pack suitable for real-time applications. Energy Conversion and Management, 92:396–405.
Gallo D., Landi C., Luiso M., and Morello R., (2013). Optimization of experimental model parame-ter identification for energy storage systems. Energies, 6 (9):4572–4590.
0 5 10 15 20 25 Time (s) 2 2.2 2.4 2.6 2.8 3 3.2 3.4 3.6 Voltage (V) V oc at T= -10 °C Voc measured Voc simulated (a) 0 5 10 15 20 25 Time (s) 2 2.2 2.4 2.6 2.8 3 3.2 3.4 3.6 Voltage (V) V oc at T= 0 °C Voc measured Voc simulated (b) 0 5 10 15 20 25 Time (s) 2 2.2 2.4 2.6 2.8 3 3.2 3.4 3.6 Voltage (V) V oc at T= 10 °C Voc measured Voc simulated (c) 0 5 10 15 20 25 Time (s) 2 2.2 2.4 2.6 2.8 3 3.2 3.4 3.6 Voltage (V) V oc at T= 20 °C Voc measured Voc simulated (d) 0 5 10 15 20 25 Time (s) 2 2.2 2.4 2.6 2.8 3 3.2 3.4 3.6 Voltage (V) V oc at T= 30 °C V oc measured Voc simulated (e) 0 5 10 15 20 25 Time (s) 1.8 2 2.2 2.4 2.6 2.8 3 3.2 3.4 3.6 Voltage (V) V oc at T= 40 °C V oc measured Voc simulated (f) 0 5 10 15 20 25 Time (s) 1.8 2 2.2 2.4 2.6 2.8 3 3.2 3.4 3.6 Voltage (V) V oc at T 50 °C Voc measured Voc simulated (g) (h)
0 20 40 60 80 100 SOC (%) 2 2.2 2.4 2.6 2.8 3 3.2 3.4 3.6 Voltage (V) V oc at T= -10 °C Voc measured Voc simulated (a) 0 20 40 60 80 100 SOC (%) 2 2.2 2.4 2.6 2.8 3 3.2 3.4 3.6 Voltage (V) V oc at T= 0 °C Voc measured Voc simulated (b) 0 20 40 60 80 100 SOC (%) 2 2.2 2.4 2.6 2.8 3 3.2 3.4 3.6 Voltage (V) V oc at T= 10 °C Voc measured Voc simulated (c) 0 20 40 60 80 100 SOC (%) 2 2.2 2.4 2.6 2.8 3 3.2 3.4 3.6 Voltage (V) V oc at T= 20 °C Voc measured Voc simulated (d) 0 20 40 60 80 100 SOC (%) 2 2.2 2.4 2.6 2.8 3 3.2 3.4 3.6 Voltage (V) V oc at T= 30 °C V oc measured Voc simulated (e) 0 20 40 60 80 100 SOC (%) 2 2.2 2.4 2.6 2.8 3 3.2 3.4 3.6 Voltage (V) V oc at T= 40 °C V oc measured Voc simulated (f) 0 20 40 60 80 100 SOC (%) 2 2.2 2.4 2.6 2.8 3 3.2 3.4 3.6 Voltage (V) V oc at T= 50 °C Voc measured Voc simulated (g) (h)
He W., Williard N., Chen C., and Pecht M., (2014). State of charge estimation for li-ion batteries using neural network modeling and unscented kalman filter-based error cancellation. International Journal of Electrical Power & Energy Systems, 62:783–791.
knowmade.com, (2017). e-mobility: the new eldorado
for li-ion batteries. https://www.knowmade.com/
e-mobility-new-eldorado-li-ion-batteries/.
Li S. and Ke B., (2011). Study of battery modeling us-ing mathematical and circuit oriented approaches. In: Power and Energy Society General Meeting, 2011 IEEE, IEEE, 1–8.
Raszmann E., Baker K., Shi Y., and Christensen D., (2017). Modeling stationary lithium-ion batteries for optimization and predictive control. In: Proceedings of the 2017 IEEE Power and Energy Conference at Illi-nois (PECI), Champaign, IL, USA, 23–24.
Tian Y., Li D., Tian J., and Xia B., (2017). State of charge estimation of lithium-ion batteries using an optimal adaptive gain nonlinear observer. Electrochimica Acta, 225:225–234.
Waldmann T., Hogg B.I., and Wohlfahrt-Mehrens M., (2018). Li plating as unwanted side reaction in commercial li-ion cells–a review. Journal of Power Sources, 384:107–124.
Xing Y., He W., Pecht M., and Tsui K.L., (2014). State of charge estimation of lithium-ion batteries using the open-circuit voltage at various ambient temperatures. Applied Energy, 113:106–115.