HAL Id: hal-03016156
https://hal.archives-ouvertes.fr/hal-03016156
Submitted on 20 Nov 2020HAL is a multi-disciplinary open access archive for the deposit and dissemination of sci-entific research documents, whether they are pub-lished or not. The documents may come from teaching and research institutions in France or abroad, or from public or private research centers.
L’archive ouverte pluridisciplinaire HAL, est destinée au dépôt et à la diffusion de documents scientifiques de niveau recherche, publiés ou non, émanant des établissements d’enseignement et de recherche français ou étrangers, des laboratoires publics ou privés.
Influence of hydrodynamic connectivity on the genetic
structure and gene flow of the common pandora Pagellus
erythrinus
Anna Rita Rossi, Paolo Colangelo, L. Berline, Elisa Angiulli, Giandomenico
Ardizzone, Chiheb Fassatoui, Luciana Sola
To cite this version:
Anna Rita Rossi, Paolo Colangelo, L. Berline, Elisa Angiulli, Giandomenico Ardizzone, et al.. Influence of hydrodynamic connectivity on the genetic structure and gene flow of the common pandora Pagellus erythrinus. Hydrobiologia, Springer, 2019, 834 (1), pp.103-117. �10.1007/s10750-019-3914-y�. �hal-03016156�
1
Influence of hydrodynamic connectivity on the genetic structure and
1
gene flow of the common pandora Pagellus erythrinus 2
3
Anna Rita Rossi1, Paolo Colangelo1, 5,*, Léo Berline2, Elisa Angiulli1, 4
Giandomenico Ardizzone3, Chiheb Fassatoui4, Luciana Sola1 5
6
1 Department of Biology and Biotechnology “C. Darwin”, Sapienza University of Rome, 7
via Borelli 50, 00161 Rome, Italy
8
2 Aix-Marseille Univ, Univ Toulon, CNRS, IRD, MIO UM 110, Mediterranean Institute of 9
Oceanography, Marseille, France
10
3 Department of Environmental Biology, Sapienza University of Rome, viale 11
dell’Università 32, 00185 Rome, Italy
12
4 Ecosystems and Aquatic Resources Research Unit (UR13AGRO1), National Agronomy
13
Institute of Tunisia (INAT), University of Carthage, Charles Nicolle Avenue 43, 1082
14
Tunis, Tunisia
15
5 National Research Council, CNR-IRET, Via Salaria km 29.300, 00015 Monterotondo 16 (Rome), Italy. 17 18 * Corresponding author: 19 Paolo Colangelo 20
National Research Council, Via Salaria km 29.300, 00015 Monterotondo (Rome), Italy.
21
c/o
22
Department of Biology and Biotechnology “C. Darwin”, Sapienza University of Rome, via
23
Borelli 50, 00161 Rome, Italy
24 e-mail: paolo.colangelo@uniroma1.it 25 Telephone: +390649918122 26 Fax: +39 06 4457516 27 28
Running title: Genetic structure of common pandora
29
Manuscript Click here to
access/download;Manuscript;Manuscript_MinorRev241218.do
2
ABSTRACT
30
Many marine organisms have complex genetic patterns that cannot be easily 31
resolved by data analysis on spatial distribution of variability usually 32
applied in population genetic studies. We propose an analytical framework 33
to evaluate the role of dispersal during early life stages that considers the 34
actual hydrodynamic connectivity in the Mediterranean Sea, as a factor 35
shaping the population structure of demersal fishes. To this purpose, and to 36
test different scenarios of gene flow, genotypes of individuals of Pagellus 37
erythrinus sampled at 12 sites in the central Mediterranean Sea were 38
analyzed at ten microsatellite loci. The results show the lack of genetic 39
structure in western Mediterranean basin and a pattern of gene flow that 40
deviates from an isolation by distance model. The observed gene flow 41
estimates appear to be scale-dependent. At local scale, it is likely the result 42
of multifactorial components whereas at a larger scale it is mainly driven by 43
the sea currents, directly influencing dispersal of larvae between sites not 44
reachable by adult movements. Our results stress the importance of a 45
quantitative analysis of potential early life stage dispersal in any study 46
focusing on the population structure of fishes with a long larval stage. 47
48
KEYWORDS: demersal, dispersal, marine fishes, microsatellite, Sparidae, 49
oceanic circulation 50
3
INTRODUCTION
51
Because of the absence of evident and pronounced physical barriers, the 52
marine environment has long been considered an open environment with 53
high potential species dispersal that prevents population subdivision (Hauser 54
& Carvalho, 2008). However, many studies have provided evidence 55
contrary to this hypothesis, i.e. the existence of pronounced population 56
structures even on a limited spatial scale in vagile species (Knutsen et al., 57
2003; Ovenden at al., 2004; Palero et al., 2008; Ciannelli et al., 2010), 58
indicating a substantial gap between expectation and observation in marine 59
population genetics (Hedgecock & Pudovkin, 2011). Indeed, both biotic 60
(including dispersal ability in different life stages, i.e. adults, juveniles, 61
larvae and eggs) and abiotic (historical and oceanographic) factors 62
components contribute to shape the genetic structure of marine species. 63
Among the biotic factors that are related to dispersal ability, the existence of 64
a pelagic larval phase is considered to play a key role in population 65
connectivity and to be the primary dispersal phase in benthic, demersal and 66
most coastal marine species (Cowen & Sponaugle, 2009). As an example 67
planktonic larval duration (PLD), i.e. the amount of time that pelagic larvae 68
spend in the open sea before settlement, was supposed to be a good 69
predictor of the species’ population connectivity and structure. However 70
discordant results were obtained among taxa when this hypothesis was 71
tested (see Bohonak, 1999; Jones et al., 2009; Weersing & Toonen, 2009; 72
Kelly & Palumbi, 2010; Riginos et al., 2011; Modica et al., 2017; Nanninga 73
& Manica, 2018). 74
These evidences, and the absence of correlation between 75
PDL/dispersal/genetic structure in multispecies studies reveals the 76
4 complexity of the factors affecting population connectivity. Weersing & 77
Toonen (2009) suggested that “larval biology of individual species, not 78
PLD, is likely the primary determinant of realized dispersal”. This is 79
congruent with the idea that factors other than PLD drive population 80
connectivity (Félix-Hackradt et al., 2013) and define the distribution range 81
of fishes (Macpherson & Raventos, 2006; Robitzch et al., 2016; Faillettaz et 82
al., 2018). As an example, within the Mediterranean Sea the effect of 83
oceanographic discontinuities, like currents and fronts, on genetic 84
differentiation is not homogenous on different species, and depends on their 85
life history traits (Pascual et al., 2017). Even more, in coral reef species, 86
larval biology is crucial in connectivity; it determines both the high 87
percentages of local self-recruitment (Swearer et al., 1999; Almany et al., 88
2007), or the high levels of genetic connectivity across large geographic 89
scales (Horne et al., 2013; Simpson et al., 2014). 90
As far as the abiotc factors are concerned, oceanographic processes (often 91
not properly considered in studies on fish population genetics) can greatly 92
influence, or even determine, the connectivity of marine populations (White 93
et al., 2010; Schunter et al., 2011; Simpson et al., 2014). Therefore, 94
quantitative analyses of hydrodynamic connectivity, i.e. the exchange of 95
particles due to coastal and oceanic circulations at different spatial and 96
temporal scales, may represent a useful framework to interpret the current 97
genetic exchange patterns of a given species (Mitarai et al., 2009; White et 98
al., 2010; Berline et al., 2014). This, in turn, can provide useful information 99
to optimize management of commercially important fishes (Berry et al., 100
2012). 101
5 To date, a number of studies have effectively incorporated hydrodynamic 102
connectivity in population genetic research on various marine organisms, 103
using hydrodynamic models as proxy of passive dispersal. On this base 104
different models of seascape connectivity have been developed with the 105
main aims to (a) correlate historical and contemporary patterns of dispersal 106
among populations (see Riginos & Liggins, 2013 for a review), (b) 107
recognize common patterns related both to egg type, larval features and 108
dispersal pathways (White et al., 2010; Crandall et al., 2012; Liggins et al., 109
2016; Faillettaz et al., 2018), and (c) identify the biological and physical 110
drivers that shape genetic diversity (Simpson et al., 2014; Davies et al., 111
2015; Liggins et al., 2016). These studies suggested that, at ecological time 112
scales, larval dispersal can show high variance and probably cover smaller 113
spatial scales than reported (Crandall et al., 2012) and that, in co-distributed 114
reef fishes, seascape features are better predictors of spatial genetic patterns 115
than dispersal traits (Liggins et al., 2016). Despite the application of a 116
variety of approaches (Jones et al., 2009), marine dispersal kernels remain 117
still largely undescribed. Here we tested the role of hydrodynamic 118
connectivity - (with different scenarios of gene flow) in determining the 119
observed pattern of the population genetic structure of a demersal fish, the 120
common pandora Pagellus erythrinus L. 1758. 121
The common pandora is a commercially important benthopelagic sparid fish 122
that inhabits inshore waters of the continental shelf of the northeastern 123
Atlantic Ocean, from Norway to Guinea-Bissau, and the Mediterranean and 124
Black Sea (Bauchot & Hureau, 1986); it is present up to 200-300 m but 125
most commonly at 20-100 m and occasionally at 100-200 m (Busalacchi et 126
al., 2014). No catch in the 200-800 m stratum has been reported by the 127
6 international bottom trawl survey in the Mediterranean (MEDITS, 2001). 128
The common pandora is a protogynous hermaphroditic fish that reproduces 129
during late spring and summer (Valdés et al., 2004), when adults migrate 130
from coastal waters to spawn in the open sea; trophic migration, in the 131
opposite direction, occurs in summer-autumn (Županović & Jardas, 1989). 132
Eggs and larvae are pelagic; the median larval stage lasts 44 days and larvae 133
are distributed offshore (>1 mile) (Macpherson & Raventos, 2006). The 134
species has a high commercial value and its catch has increased in the last 135
30 years, particularly along the North African coast of the Mediterranean 136
Sea (FAO, 2018). It is also a candidate for marine fish aquaculture in the 137
Mediterranean Sea, and a small-scale production already exists in Greece 138
(Klaoudatos et al., 2004). 139
Previous mtDNA data (Angiulli et al., 2016) identified three sympatric 140
mitochondrial lineages in specimens collected at 15 sites in the 141
Mediterranean Sea and one in the Atlantic Ocean. The three lineages 142
probably originated from isolation and divergence processes and then came 143
into secondary contact during the Middle and Late Pleistocene glacial and 144
interglacial cycling (Angiulli et al., 2016). Within the central Mediterranean 145
Sea, their distribution does not show any evident geographic pattern, 146
suggesting high connectivity even across the putative boundaries between 147
the biogeographic sectors proposed in the investigated area (Villamor et al., 148
2014), and between the two Tunisian sites where previous gene enzyme 149
electrophoresis analyses reported genetic differentiation (Fassatoui et al., 150
2009, 2011). The frequency distribution of mtDNA lineages across sampling 151
sites suggested a more limited matrilinear gene flow only between the 152
Mediterranean Sea and the Atlantic Ocean. 153
7
According to the idea that nuclear loci should usually provide greater
154
resolution of genetic structure than mtDNA (Angers & Bernatchez, 1998),
155
the main goal of this study was to analyze the present fine-scale population 156
structure and connectivity of P. erythrinus within the Mediterranean Sea and 157
to clarify the contribution of dispersal at different life history stages to 158
delineate this structure. For this purpose, we analyzed the genetic variation 159
at 10 microsatellite loci screened in specimens collected at 12 of the 16 160
sampling sites examined by mtDNA analysis (Angiulli et al., 2016). We 161
focused on the Italian and Tunisian sites and estimated the hydrodynamic 162
connectivity in the central Mediterranean Sea using a Lagrangian approach. 163
We assumed that (a) adult common pandora occupy bottoms of the 164
continental platform and are likely unable to move between sites separated 165
by deep stretches of sea, implying that their possible migration routes are 166
limited by the depth; (b) that eggs and larvae occupy superficial waters, as 167
larvae of Sparidae in the Mediterranean Sea are mainly concentrated in the 168
upper 10 m of the water column (Sabatés and Olivar, 1996). Thus, when 169
connectivity exists between two sites separated by a deep stretch of sea (> 170
300 m in depth), we might expect that it is due to pelagic larval migration of 171
early life history stages. 172
With this premise and on the base of the information derived from a 173
Lagrangian model of hydrodynamic connectivity, we tested different gene 174
flow scenarios in a Bayesian framework. In this way we aimed to determine
175
whether the identified genetic structure (i) can be attributed mainly to the 176
active dispersal capabilities of adults or (ii) is mainly shaped by early life 177
history dispersal between pairs of sites due to the effects of hydrodynamic 178
connectivity, or (iii) might be the result of both. 179
8 180
181
MATERIALS AND METHODS
182 183
Sampling and microsatellite genotyping
184
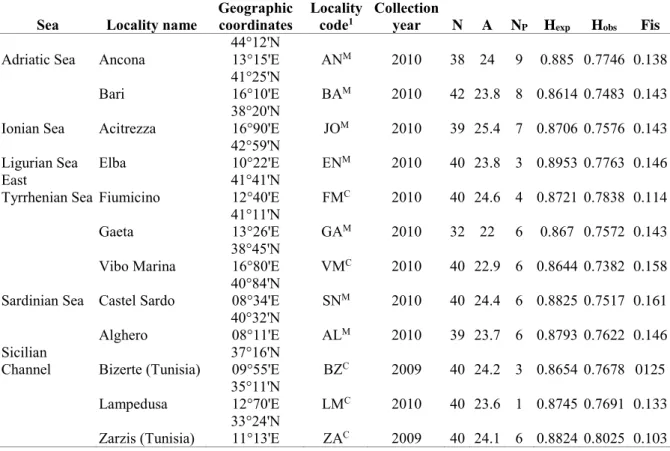
Common pandora adults (Standard Length > 13 cm) were collected from 12 185
sites along the Italian and Tunisian coasts in the Mediterranean Sea (Table 1, 186
Fig 1). The samples were collected during MEDITS (Mediterranean 187
International Trawl Survey, Bertrand et al., 2002) fishery research surveys 188
or were obtained from commercial fishing landings. 189
Pectoral fin clips were removed and preserved in 96% ethanol at 4°C. 190
Voucher specimens were deposited in the Ichthyology Collection of the 191
Department of Biology and Biotechnology of Sapienza University of Rome 192
(ICDBB 970-974). Genomic DNA was extracted according to the procedure 193
of Aljanabi & Martinez (1997) and then used as a template in polymerase 194
chain reactions (PCR) for 10 microsatellite loci expressly isolated for 195
Pagellus erythrinus (MS2, MS3, MS4, MS6, Ramsak et al., 2003) or for 196
other sparids (SL7, SL17, SL26, SL29 and SL33, Chopelet et al., 2009; 197
PbOviD102, Piñera et al., 2006). Loci were amplified in two multiplex 198
reactions in a total volume of 10 µl containing 1 µl of 10x buffer, 0.3 µl of 199
MgCl2 (50 mM), 0.2 µl of dNTP (2.5 mM), 0.1 µl of each primer (100 µM), 200
0.07 µl of BIOTAQTM DNA polymerase and 10-100 ng of DNA template. 201
The PCRs were performed in a Thermocycler T1 (Biometra, Göttingen, 202
Germany) with an initial denaturation of 2 min at 94°C, followed by 40 203
cycles of 94°C for 30 s, a locus-specific annealing temperature (for each 204
primer as described by the above-mentioned authors) for 45 s and 72°C for 205
9 30 s and a final extension at 72°C for 5 min. PCR products were run on 206
6.5% denaturing polyacrylamide gel using a LI-COR DNA 4200 automated 207
sequencer (LI-COR Biosciences, Cambridge, UK). Allele sizes were 208
screened using GENE-IMAGE v4.05 software (Scanalytics, Fairfax, VA, 209
USA). Approximately 10% of the samples (50 individuals) were re-scored at 210
all 10 microsatellite loci to ensure repeatability. 211
212
Data analysis
213
Genetic variability and differentiation
214
Allele frequencies, expected and observed heterozygosity (Hexp and Hobs), 215
average number of alleles (A), number of private alleles (NP) and allelic 216
richness (AR) were estimated per locus and per sampling site using 217
GENEPOP v3.4 (Raymond & Rousset, 1995) and FSTAT v2.9.3.2 (Goudet,
218
2001) software. Deviation from Hardy-Weinberg equilibrium (HWE) and
219
linkage disequilibrium were tested for each locus and pairs of loci
220
respectively, and for sampling site. Statistical significance of both analyses
221
was calculated with the Markov Chain Monte Carlo (MCMC) method using
222
104 permutations, 5x10³ dememorization steps and 500 batches. Sequential 223
false discovery rate (FDR) correction for multiple tests was applied for the 224
HWE tests and for the linkage disequilibrium significance because of the 225
large number of tests involved (Benjamini & Hochberg, 1995). 226
The occurrence of putative null alleles, large allele drop-out and scoring 227
errors was evaluated using MICROCHECKER (Van Oosterhout et al., 228
2004). Moreover, the frequency of null alleles was tested using the
229
Expectation Maximization algorithm of Dempster et al., (1977),
230
implemented in FreeNA software (Chapuis & Estoup, 2007).
10 The presence of loci under selection was evaluated by the coalescent 232
approach (Beaumont & Nichols, 1996) and by both a global outlier test, 233
implemented in LOSITAN (Antao et al., 2008), and the hierarchical method 234
of Excoffier et al. (2009), using the software ARLEQUIN v3.5 (Excoffier & 235
Lischer, 2010). The LOSITAN analyses were performed under the infinite 236
allele model (IAM) and the stepwise mutation model (SMM) with 95x103 237
permutations and 99% confidence interval, while the ARLEQUIN analyses
238
were carried out under a hierarchical island model with 5x10⁴ coalescent 239
simulations. 240
Genetic differentiation between samples was tested by FST (Weir &
241
Cockerham, 1984) and RST (Slatkin, 1995) using ARLEQUIN v3.5 and
242
RSTCALC v2.1 (Goodman, 1997) respectively, and the significance of
243
pairwise values was calculated with the MCMC method using 104
244
permutations, 5x10³ dememorization steps and 500 batches. Sequential false 245
discovery rate (FDR) correction for multiple tests was applied. 246
The simulation-based program POWSIM v4.1 (Ryman & Palm, 2006) was 247
used to assess the statistical power of the 10 microsatellite loci to detect 248
various levels of divergence among sampling sites. The simulations were
249
performed using different combinations of Ne (effective population size) and
250
t (time of divergence) leading to FST values in the range 0.005-0.010. The
251
tested values of FST and Ne were selected according to the estimated values
252
from data of this study (see Results section). The statistical power of the
253
dataset was evaluated using Chi-squared and Fisher’s exact tests. The
254
estimate of power was reported as the proportion of significant outcomes
255
(p<0.05) after 1000 replicates.
256
The correlation between least cost geographic distances and the genetic 257
11 distances, calculated as the FST/(1- FST), was analyzed with a Mantel test,
258
using the software R statistical environment (R Development Core Team, 259
2011). Least cost distances among pairs of sites were calculated using the 260
function shortest Path implemented in the “gdistance” package (van Etten, 261
2017). In order to obtain a least cost distance, we allowed connection only 262
through areas covered by sea, preventing connection across a land surface. 263
264
Cluster analysis
265
Bayesian cluster analysis implemented in STRUCTURE 2.3 (Pritchard et 266
al., 2000) was used to estimate the number of genetic clusters (K) within the 267
dataset.Mean and variance of log likelihoods of the number of clusters for 268
K=1 to K=12 (the number of sampling sites) were inferred from multilocus 269
genotypes using the MCMC method. Twenty replicates for each set of 270
values of K with 1.5x10⁶ iterations (burn-in period of 1x10⁵ iterations) were 271
performed under the admixture ancestry model and the assumption of 272
correlated allele frequencies among samples (Falush et al., 2003). 273
In addition to STRUCTURE, discriminant analysis of principal components 274
(DAPC; Jombart et al., 2010) was used to detect the best number of genetic 275
clusters using the function find.cluster. The correct number of clusters (K) 276
was determined by testing K values from 1 to 12. Different clustering 277
solutions were then compared using Bayesian Information Criterion (BIC). 278
Subsequently DAPC was performed (the first 100 PC scores, which account 279
for 80% of the total cumulative variance, were retained) to evaluate the 280
percentage of posterior correct assignments. Both K-means and DAPC were 281
implemented in the R package adegenet v1.3-1 (Jombart, 2008; Jombart & 282
Ahmed , 2011). 283
12 284
Hydrodynamic model
285
A Lagrangian approach was used to quantify hydrodynamic connectivity. 286
We define Oceanic distances (OD) as the mean connection time (MCT) 287
taken by particles to connect two sites. The dispersal of a large ensemble of 288
passive particles by the oceanic circulation was modeled using currents 289
from a multiannual realistic ocean model simulation covering the whole 290
Mediterranean basin. Particles were released in the surface layer (0-100 m) 291
where eggs and larvae are generally found (Klimogianni et al., 2004 and 292
references therein). For each pair of square sub-regions of 50 km per side, 293
the time needed to go from one sub-region to the other (by the particles) was 294
computed. The average time to connect site pairs found in a specific sub-295
region provides a measure of the oceanic distance. The resulting MCT 296
matrix is asymmetric since the time required by a particle to go from site 297
“a” to site “b” is not equal to the time to go from “b” to “a”. Details of the 298
method and how to calculate MCT can be found in Berline et al. (2014). 299
Here we only consider MCT below 200 days, a time window that includes 300
the embryonic and larval phases as well as the early juvenile stage. The 301
pairwise hydrodynamic connectivity was then used to propose different 302
dispersal scenarios of gene flow (see below). 303
304
Gene flow and hydrodynamic connectivity
305
Gene flow within the Mediterranean Sea was estimated using a coalescent 306
based approach implemented in MIGRATE-N v3.6 (Beerli & Felsenstein, 307
2001; Beerli, 2006), and alternative migration hypotheses (Beerli & 308
Palczewski, 2010) were tested. 309
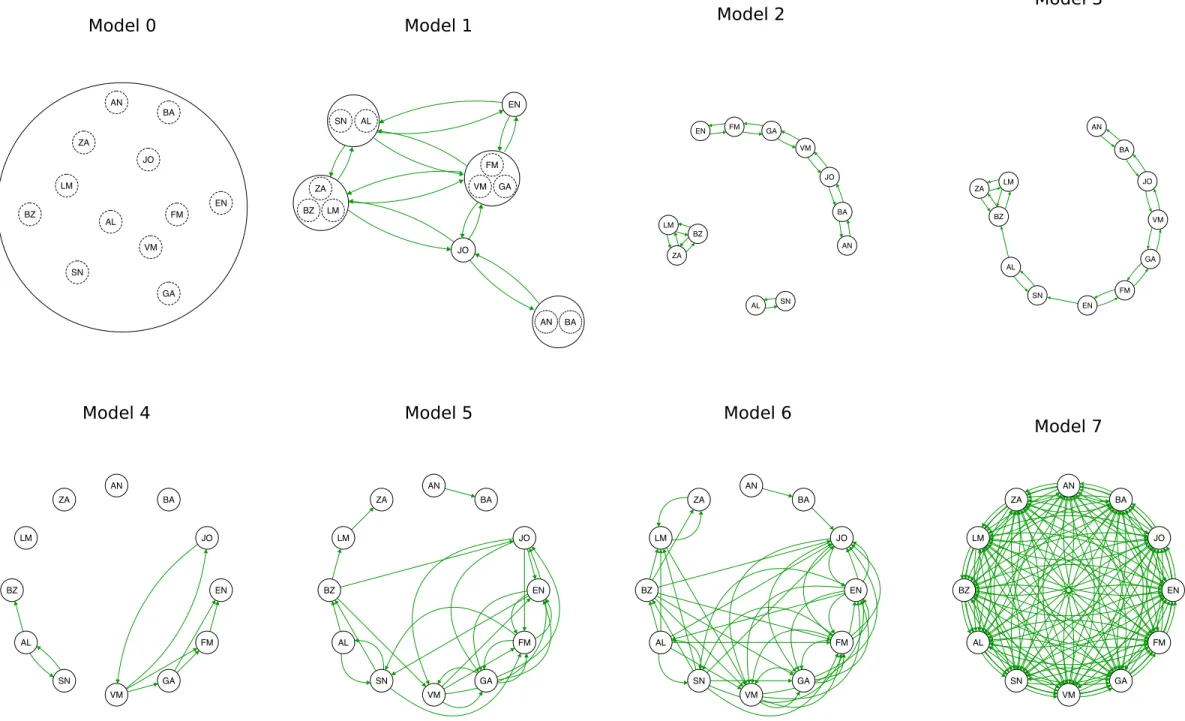
13 Complete panmixia (Fig. 2, Model 0: all the sampled specimens belong to a 310
unique large panmictic unit) was tested versus seven alternative migration 311
models (Fig. 2, Models 1-7). The evaluated scenarios allowed us to test 312
alternative population structures and migration dynamics (adults and early 313
life history dispersal) along different routes. 314
In the first migration model (Fig. 2: Model 1), sampled populations were 315
pooled according to their geographic sea origin: Ligurian Sea, Tyrrhenian 316
Sea, Sea of Sardinia, Sicilian Channel, Ionian Sea, Adriatic Sea. Migration 317
rates were allowed to be bi-directional between pairs of adjacent seas. All 318
the successive models considered the sampled geographic populations as 319
distinct genetic units, whereas migration rates among them were evaluated 320
according to different schemes. Indeed, in the second migration model (Fig. 321
2: Model 2) the gene flow was considered a bi-directional stepping stone 322
process related to active dispersal of P. erythrinus. Thus, the gene flow was 323
estimated only between sites whose distances and path could be covered by 324
adult migration routes along coastlines or across sea stretches less than 300 325
m deep. 326
This model allowed us to identify three groups of sites that can exchange 327
migrants (Fig. 2: Model 2). In the subsequent model (Fig. 2: Model 3) we 328
extended the previous model by considering additional early life history 329
dispersal routes mediated by sea currents. On the basis of oceanic distances 330
(see hydrodynamic connectivity) we identified two routes that allowed us to 331
connect the three groups of Model 2, thus allowing a potential continuous 332
exchange of genes across the sampled sites. In more detail we identified the 333
two unidirectional routes (EN->SN and AL->BZ) that allowed an early life 334
history dispersal between the three groups of units with the shortest period 335
14 (112 and 91 days respectively). These migration routes, identified on the 336
basis of the oceanic distances, are congruent with the oceanic circulation 337
known for the area (I.I.M., 1982; Millot & Taupier-Letage, 2005; Berline et
338
al., 2014). In Models 4, 5 and 6 (Fig. 2) only a main effect of early life 339
history gene flow, mediated by oceanic circulation, was considered. In these 340
three models, different thresholds were used to calculate which localities are 341
connected by sea currents respectively up to 100, 150 and 200 days. In these 342
models, migration routes could be uni-directional because in some cases the 343
adopted time thresholds allowed a particle to go from one locality to another 344
but not vice versa. Finally, a further model (Fig. 2: Model 7) was tested 345
considering all the sampled populations as independent genetic units; bi-346
directional migration was possible among all pairs of sampling sites. 347
Initially, a number of preliminary runs, using all sites and assuming a full 348
migration matrix, was performed to identify the best parameters for the 349
search. Identification of the optimal MCMC parameters was done until 350
consecutive runs produced overlapping results and the estimated values for 351
all the parameters showed a normal distribution (i.e. no double peaks and 352
narrow intervals). The search parameters were then adopted for all the 353
models tested. Initial migration (M) parameters were estimated using FST.
354
Default MIGRATE-N priors were used for all the models. For each model 355
two independent multiple MCMCs were run for 1000000 steps, sampling 356
every 100 steps. For each MCMC chain the first 10000 trees were discarded 357
and a static heating scheme was adopted (4 chains with temperatures: 358
1000000, 3, 1.20, 1). For each analysis the effective sample size (ESS) was 359
evaluated and it was found to be much higher than 1000 for all the 360
parameters in all the models tested, with the only exception for the most 361
15 complex model (n=144 parameters) showing seven parameters with an ESS 362
slightly lower than 1000. The marginal likelihood of each model, as 363
obtained by Bezier approximation, was used to calculate the model 364
probability, estimated by dividing each marginal likelihood by the sum of 365
the marginal likelihoods of all used models. 366
367
RESULTS
368
In total, 470 common pandora individuals from 12 sampling sites (Table 1)
369
were screened for 10 microsatellite loci. The 50 DNA samples that were
370
amplified and scored twice produced identical results in each trial.
371 372
Genetic variability
373
Genetic variability parameters vary considerably among the 10 loci (Online
374
resource 1): MS6 is the locus with the lowest number of alleles (14 distinct
375
alleles, A= 6.4), while MS2 is the most variable (83 distinct alleles,
376
A=35.6). Private alleles (65) constitute 14% of the total alleles (464), 377
ranging from 7.8% at locus SL17 to 35.3% at locus SL33. The number of
378
alleles per sampling site is medium/high and quite homogeneously
379
distributed across samples (A ranges from 22 to 25.4, Table 1). Private 380
allele distribution across sites ranges from 0.42% at sampling site LM to 381
3.75% at AN. Levels of mean Hobs are similar among all samples, ranging 382
from 0.748 to 0.802, but lower than the Hexp(Table 1). 383
Significant departures from HWE were observed in 50 of 120 locus/site 384
combinations after FDR correction (Online resource 2). MS2 and SL33 are 385
the most affected loci (Online resource 2). All deviations are characterized 386
by heterozygote deficit, and according to MICROCHECKER half of them 387
16 are associated with the presence of putative null alleles, whose frequencies 388
in each locus are not uniformly distributed across different sampled 389
populations (Online resource 2). According to this, the deviation from HWE 390
due to heterozygote deficit observed in our dataset cannot be simply 391
explained by a widespread presence of null alleles but rather as the result of 392
a combination of factors including other biological processes (e.g. 393
inbreeding and/or the Wahlund effect). Indeed, heterozygote deficit and 394
positive FIS are also observed when data are calculated for each population 395
(data not shown). The different components that act on heterozygote deficit 396
cannot be easily discerned by a multilocus data analysis (Dharmarajan et al., 397
2013). Carlsson (2008) demonstrated that the occurrence of null alleles 398
could only slightly affect the assignment test and FST estimation. Moreover, 399
a conservative approach of discarding loci deviating from HWE 400
expectations could eliminate informative markers and thus affect the 401
inferences on biological phenomena derived from the data (Dharmarajan et 402
al., 2013). According to these considerations and to the non-uniform 403
frequency distribution of null alleles across different populations, we 404
retained one of the two most affected loci, MS2, in the analysis; the other 405
one, SL33, was excluded from the genetic structure analysis as it is also 406
under selection (see below).
407
No linkage disequilibrium was detected for each pair of loci (585 pairwise 408
comparisons) by the FDR method. 409
410
Population structure
411
The POWSIM analysis showed that the combination of microsatellite loci
412
and sample sizes rendered a statistical power sufficient to detect a low level
17
of differentiation. In fact, about 95% (χ2) and more than 90% (Fisher’s) of
414
the tests where the Ne/t combination led to FST = 0.0010 and 100% (both χ2
415
and Fisher’s) of the tests where Ne/t led to a FST value of ≥0.0025 were
416
statistically significant (Online resource 3). The FST values were significant
417
for all loci with the exception of PbOviD102. The global outlier test
418
revealed directional selection at one locus, SL33, using both LOSITAN (p <
419
0.01) under IAM and SMM models and ARLEQUIN (p<0.001). These
420
results suggested that SL33 is under positive selection, and for this reason
421
this locus was eliminated from subsequent analyses.
422
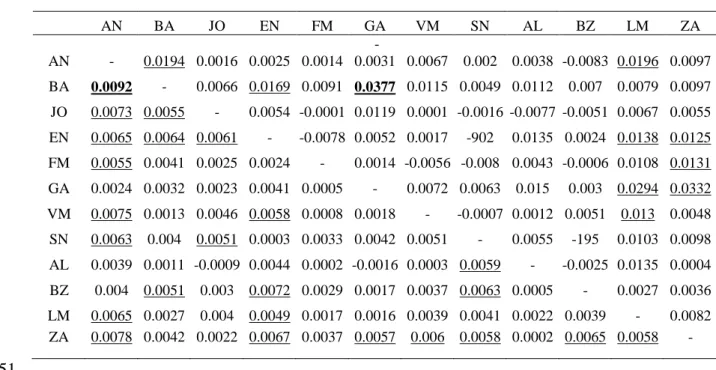
Multilocus FST among all samples = 0.00395 (p<0.001). Multilocus pairwise
423
estimates of FST and RST are reported in Table 2. Only two pairwise
424
comparisons were found to be significant after FDR correction, AN-BA and
425
GA-BA, for FST and RST, respectively.
426
The Mantel test applied to all sampling sites revealed the absence of
427
correlation between genetic distances, expressed as FST/(1- FST), and
428 geographic distances (z=231132.8, p=0.175). 429 430 431 Cluster analysis 432
Cluster analyses by means of STRUCTURE identified, among the 12 tested 433
K, the greatest posterior probability value at K = 1, i.e. a single genetic 434
cluster. 435
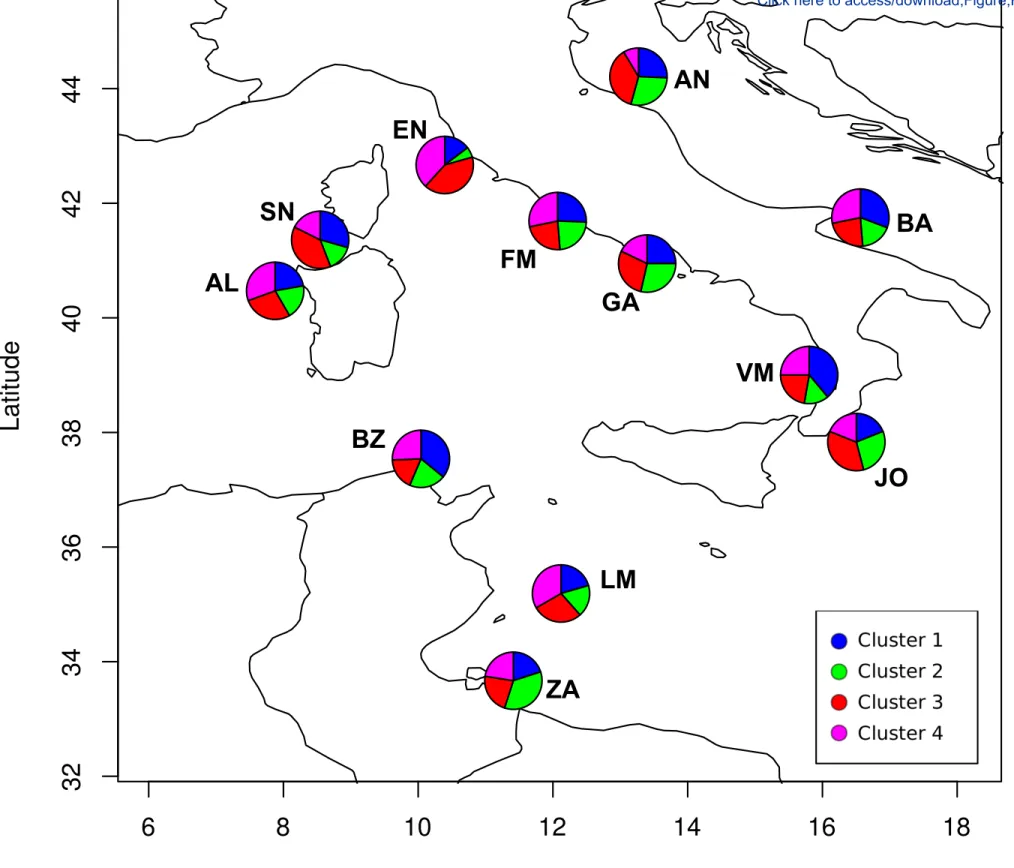
In contrast, according to BIC the best number of clusters inferred by the k-436
means analyses within the Mediterranean Sea sites is four, and DAPC 437
provided >0.96% of posterior correct group assignments. The four genetic 438
clusters can be easily distinguished by the first two discriminant axes, and 439
18 each includes a different number of individuals (n=112, 110, 93 and 121 440
respectively for cluster 1, 2, 3 and 4). All four clusters are not related to 441
specific geographic areas and were found at all the sampling sites (Fig. 3,
442
Online resource 4). Frequency of cluster across the twelve sites is not 443
significantly different according to chi-square test (p=0.08) 444
445
Gene flow and hydrodynamic connectivity 446
Lagrangian model returns that only 59 possible connections (versus a total 447
of 144 hypothetical ones) can occur within the threshold of 200 days. 448
The MCTs range between a maximum of 199 days and a minimum of 53 449
days, with an average of 134 days. Shortest MCT were found between 450
Sardinian (SN-AL) and Tyrrhenian sites (GA-FM, FM-EN) as well as 451
between Jonian and southern Tyrrhenian sites (JO-VM). 452
As expected, the largest MCTs were found between sites located in different 453
sea basins. For every pair of sites, a strong asymmetry exists between the 454
two directions of transport (Online resource 5). 455
Among the different migration models, according to the marginal 456
likelihoods, the highest support (relative probability, P=1) was obtained for 457
Model 3 (Online resource 6). All the estimated migration rates (M) show 458
narrow 95% confidence intervals with density distributions following a 459
normal distribution. Migration rates between pairs of sites are scattered 460
across a wide range of values and are summarized in Fig. 4a and b. 461
Estimated migration rates are almost symmetrical between all pairs of sites, 462
with the exception of FM<->EN and LM<->ZA (Fig 4a). The estimated 463
migration rates between pairs of sites (EN->SN and AL->BZ) that cannot be 464
reached by adult P. erythrinus are comparable or even higher than those 465
19 observed between geographically adjacent pairs of sites that can be reached 466
by adult dispersal. Very low migration rates were observed among a few 467
sites and particularly characterized Adriatic (AN, BA) and Ionian (JO) sites. 468 469 DISCUSSION 470 Population structure 471
Our results highlight a lack of spatial population structure in the common
472
pandora, similar to what observed in other Mediterranean demersal species
473
(Schunter et al., 2011; Franchini et al., 2012). Partial inconsistencies among 474
results obtained by the different analysis/programs employed could derive 475
from the different assumptions on which the various methods rely, such as a 476
priori grouping of individuals or their assumed pure/mixed ancestry. As an 477
example, simulated data show that below FST = 0.1, STRUCTURE is unable 478
to correctly identify the number of subpopulations, providing false certainty 479
regarding the K (Latch et al., 2006).
480
STRUCTURE suggests potential panmixia in the common pandora whereas 481
this scenario, that consider random genetic exchange among individuals and 482
population with the same probability, is rejected by the MIGRATE-N model 483
comparison. The k-means clustering and DAPC methods identify four 484
different genetic clusters (Online resource 4), which however are spread
485
across all sites and thus fail to identify a spatial structuring of genetic
486
diversity. A previous mtDNA sequence analysis of the same samples within 487
the Mediterranean Sea depicted a similar pattern characterized by the 488
absence of a spatial genetic structure (Angiulli et al., 2016). Due to their 489
different mutation rates and uni- or bi-parental inheritance, mitochondrial
490
DNA and microsatellites usually provide different sensitivities at different 491
20 temporal scales. Mitochondrial DNA is more suitable to record signatures of 492
historical processes (Avise, 2000), related to the last few million years. 493
Microsatellites perform better in unraveling contemporary and recent 494
processes, i.e. occurring in the last 10 thousand years (Hewitt, 2004). The 495
advance of combining of the two kind of markers has been proved in marine 496
fishes (Limborg et al., 2012), although sometimes they can yield different 497
results, i.e. identify, different numbers of subpopulations (Durand et al., 498
2013; Lemos et al., 2005; Sala-Bozano et al., 2009; Silva et al., 2014). In the 499
common pandora mtDNA and microsatellites provide similar pattern of 500
genetic diversity with differentiated genetic clusters, occurring in sympatry. 501
This pattern could be explained by group differentiation due to vicariance 502
events, with the groups subsequently entering into secondary contact once 503
the disappearance of putative barriers permitted complete connectivity in the 504
Mediterranean basin. 505
506
Impact of hydrodynamic connectivity on gene flow pattern
507
Knowledge of the influence of hydrodynamic patterns on population 508
connectivity of many Mediterranean species is still scarce, whereas it could
509
be particularly important for the study of the genetic structure of demersal
510
fishes. In these species, adults are usually associated with benthonic
511
environments and, although capable of long-distance dispersion, are limited
512
in crossing deep sea stretches, that act as natural barriers. As a consequence,
513
long-range dispersal cannot be attributed to adult movements alone, but
514
rather also to what occurs during the earliest ontogenetic stages, when eggs
515
and larvae are dispersed by sea currents.
516
We employed an analytical method that allowed us to gain insight into the
21
gene flow and connectivity among common pandora populations. We tested
518
different scenarios in which we assumed a different role of passive and
519
active dispersal in determining the observed population structure in the
520
western Mediterranean Sea. Our model selection approach suggests a 521
scenario in which the gene flow over long distances is due to dispersal of 522
eggs and larvae by oceanic currents, whereas at a small scale can effectively 523
be affected by adult’s movement. This scenario agrees with what we know 524
about the biology of this species. Thus, it is likely that gene flow between 525
neighboring sites (on the same coast or connected by a body of water less 526
than 300 m deep) can occur by active movement of adults, even though a 527
contribution by sea currents to the gene flow among neighboring sites 528
cannot be completely ruled out. We tried to determine the potential 529
contribution of adult and larval migration over short distances by assessing 530
the influence of both oceanic and geographic distances on the estimated 531
mean gene flow in the best-supported migration scenario of Model 3. 532
Therefore, our results suggest that over long distances hydrodynamic 533
connectivity and gene flow in the common pandora are affected by dispersal 534
of eggs and larvae, and thus directly by oceanic circulations, gyres and 535
barriers present within the Mediterranean Sea (Limborg et al., 2012). On the 536
other hand, over short distances, it is likely that a mixed contribution by sea 537
currents, adult movements and/or other biophysical phenomena determines 538
the exchange among populations. As an example, recently simulated
539
scenarios on other sparids showed that larval behavior could actually affect
540
connectivity: swimming abilities of just few cm s−1, at the end of the pelagic
541
phase, can impact on the rate of recruitment and change connectivity
542
patterns at regional scale (Faillettaz et al., 2018).
22 All these phenomena act at different scales determining a lack of spatial 544
genetic structure. Further studies are necessary for a generalization of this 545
connectivity pattern to other demersal fishes, but it is important to stress that 546
a similar pattern of genetic structure was reported in the same geographic 547
area for another sparid, the coastal S. aurata (Franchini et al., 2012), which 548
has a comparable long-lasting larval stage (about 50 days). 549
Finally, it is important to frame the excess of homozygotes observed in the
550
sampled populations within the gene flow scenario supported by our
551
analyses. Under a scenario of weak population structure and extensive gene
552
flow (as confirmed by FST and MIGRATE-N analyses), a high proportion of
553
heterozygoses at most of the sampled loci is expected. On the other side, a
554
recent study on the evolutionary consequences of alternative sex change
555
pathways by Benvenuto et al. (2017) demonstrated a reduction of the
556
effective population in protogynous fishes and also reported a reduction of
557
heterozygotes in P. erythrinus. Further data indicate that biophysical
558
phenomena can cause a long-term aggregation of larval fish siblings during
559
dispersal, causing a deviation from Hardy-Weinberg proportions in samples 560
containing a high proportion of related individuals (Ottmann et al., 2016). 561
Thus, in P. erythrinus the extensive gene flow could be compatible with an 562
excess of homozygotes, considering an effective low number of breeders or 563
other phenomena that allow the passive dispersal of large numbers of 564 siblings. 565 566 567 Conclusion 568
A quantitative method that evaluates the effect of hydrodynamic 569
23 connectivity on gene flow can be a powerful tool for an understanding of the 570
population genetics and dynamics of demersal fishes. Our seascape genetic 571
analyses in the common pandora allowed us to elucidate population 572
dynamics and dispersal patterns, confirming the usefulness of genetic 573
approaches in testing predictions about transport mechanisms in the sea 574
(Selkoe et al., 2016). Our results suggest that gene flow across the central 575
Mediterranean Sea in the common pandora, and likely in other demersal 576
fishes, is extremely complex and driven by a combination of factors acting 577
at different scales, including movements of both adults and eggs and larval 578
migration. The complex pattern detected in the central Mediterranean Sea
579
suggests that in fish population genetic studies, hydrodynamic connectivity
580
estimates can help not only to understand the distribution of genetic 581
diversity but also to study dispersal patterns of demersal fishes. Moreover,
582
clarifying the interactions between hydrodynamic connectivity and
583
population genetics could provide useful information for fisheries
584
management and for the better design of marine protected areas (Andrello et
585 al., 2015) 586 587 ACKNOWLEDGEMENTS 588
We thank the MEDITS coordinators and all of our colleagues for their
589
invaluable help with sample collection, specifically Maria Teresa Spedicato
590
and Giuseppe Lembo, COISPA (Bari); Angelo Cau, Dept. of Life and
591
Environmental Sciences, Cagliari University; Corrado Piccinetti, Dept. of
592
Biological, Geological and Environmental Sciences, Bologna University;
593
Angelo Tursi, Dept. of Biology, Bari University; Fabio Fiorentino, Coastal
594
Marine Environment Institute, Mazara del Vallo and Mohamed Salah
24
Romdhane, INAT/Université de Carthage, Tunisia. Financial support for
596
this work was provided by Sapienza University of Rome, Sapienza Projects
597
2014, grant C26A143AL3
25 599
REFERENCES
600 601
Aljanabi, S. M. & I. Martinez,1997. Universal and rapid salt extraction of
602
high quality genomic DNA for PCR-based techniques. Nucleic Acids
603
Research 25:4692–4693.
604
Almany, G. R., M. L. Berumen, S. R. Thorrold, S. Planes & G. P. Jones, 605
2007. Local replenishment of coral reef fish populations in a marine 606
reserve. Science 316: 742-744. 607
Andrello, M., M. N. Jacobi, S. Manel, W. Thuiller & D. Mouillot, 2015. 608
Extending networks of protected areas to optimize connectivity and 609
population growth rate. Ecography 38:273–282. 610
Angers, B. & L. Bernatchez, 1998. Combined use of SMM and non-SMM
611
methods to infer fine structure and evolutionary history of closely related
612
brook charr (Salvelinus fontinalis, Salmonidae) populations from
613
microsatellites. Molecular Biology and Evolution 15:143–159
614
Angiulli, E., L. Sola, G. Ardizzone, C. Fassatoui & A. R. Rossi, 2016. 615
Phylogeography of the common pandora Pagellus erythrinus in the 616
central Mediterranean Sea: sympatric mitochondrial lineages and genetic 617
homogeneity. Marine Biology Research 12:4-15. 618
Antao, T., A. Lopes, R. J. Lopes, A. Beja-Pereira & G. Luikart,2008.
619
LOSITAN: a workbench to detect molecular adaptation based on a
Fst-620
outlier method. BMC Bioinformatics 9:323.
621
Avise, J. C., 2000. Phylogeography. The history and formation of species. 622
Harvard University Press: Cambridge, MA. 623
Bauchot, M. L. & J. C. Hureau,1986. Sparidae. In: Whitehead PJP, Bauchot
624
ML, Hureau JC, Nielsen J, Tortonese E (eds), Fishes of the north-eastern
26
Atlantic and the Mediterranean, UNESCO, Paris. Vol 2: 883-907.
626
Beaumont, M. A. & R. A. Nichols,1996. Evaluating loci for use in the
627
genetic analysis of population structure. Proceedings of the Royal
628
Society of London B: Biological Sciences 263:1619-1626. 629
Beerli, P., 2006. Comparison of Bayesian and maximum likelihood
630
inference of population genetic parameters. Bioinformatics 22:341–345.
631
Beerli, P. & J. Felsenstein, 2001. Maximum likelihood estimation of a
632
migration matrix and effective population sizes in n subpopulations by
633
using a coalescent approach. Proceeding of the National Academy of
634
Science USA 98:4563–4568. 635
Beerli, P. & M. Palczewski, 2010. Unified framework to evaluate panmixia
636
and migration direction among multiple sampling locations. Genetics 637
185:313–326 638
Benjamini, Y. & Y. Hochberg,1995. Controlling the false discovery rate: a 639
practical and powerful approach to multiple testing. Journal of the Royal 640
Statistical Society: Statistical methodology 57: 289–300. 641
Benvenuto, C., I. Coscia, J. Chopelet, M. Sala-Bozano & S. Mariani, 2017. 642
Ecological and evolutionary consequences of alternative sex change 643
pathways in fish. Scientific Reports| 7: 9084 644
Berline, L., A. M. Rammou, A. Doglioli, A. Molcard& A. Petrenko, 2014. A 645
Connectivity-Based Eco-Regionalization Method of the Mediterranean 646
Sea. PLoSONE 9:e111978. 647
Berry, O., P. England, D. Fairclough, G. Jackson& J. Greenwood, 2012. 648
Microsatellite DNA analysis and hydrodynamic modelling reveal the 649
extent of larval transport and gene flow between management zones in an 650
27 exploited marine fish (Glaucosoma hebraicum). Fisheries Oceanography 651
21: 243-254. 652
Bertrand, J., L. Gil de Sola, C. Papaconstantinou, C. Relini & A. 653
Souplet,2002. The general specifications of the MEDITS surveys. 654
Scientia Marina 66:9–17. 655
Bohonak, A. J., 1999. Dispersal, gene flow, and population structure. The 656
Quarterly Review of Biology 74: 21-45. 657
Busalacchi, B., T. Bottari,D. Giordano, A. Profeta & P. Rinelli, 2014. 658
Distribution and biological features of the common pandora, Pagellus 659
erythrinus (Linnaeus, 1758), in the southern Tyrrhenian Sea (Central 660
Mediterranean). Marine Research 68:491–501 661
Carlsson, J., 2008. Effects of microsatellite null alleles on assignment
662
testing. Journal of Heredity 99: 616–623.
663
Chapuis, M. P. & A. Estoup,2007. Microsatellite null alleles and estimation
664
of population differentiation. Molecular Biology and Evolution
24:621-665
631. 666
Chopelet, J., S. Helyar, B. Mann, & S. Mariani, 2009. Novel polymorphic 667
microsatellite loci for the ptotogynous hermaphrodite slinger sea bream 668
(Chrysoblephus puniceus, Sparidae). Molecular Ecology Research 669
9:1223–1226. 670
Lorenzo Ciannelli, L., H. Knutsen, E. M. Olsen, S. H. Espeland, L. Asplin,
671
A. Jelmert, J. A. Knutsen and N. C. Stenseth, 2010. Small-scale genetic
672
structure in a marine population in relation to water circulation and egg
673
characteristics. Ecology 91: 2918–2930.
674
Cowen, R. & S. Sponaugle, 2009. Larval dispersal and marine population
675
connectivity. Annual Review of Marine Science 1:443–466.
28
Crandall, E. D., E. A. Treml & P. H. Barber, 2012. Coalescent and
677
biophysical models of stepping-stone gene flow in neritid snails.
678
Molecular Ecology 21: 5579–5598
679
Davies, S. W., E. A. Treml, C. D. Kenkel & M. V. Matz, 2015. Exploring the 680
role of Micronesian islands in the maintenance of coral genetic diversity 681
in the Pacific Ocean. Molecular Ecology 24: 70–82. 682
Dempster, A. P., N. M. Laird, & D. B. Rubin,1977. Maximum likelihood
683
from incomplete data via the EM algorithm. Journal of the Royal 684
Statistical Society: Statistical methodology 39:1-38. 685
Dharmarajan, G., W. S. Beatty & E. R. Olin Jr, 2013. Heterozygote 686
deficiencies caused by a Wahlund effect: Dispelling unfounded 687
expectations. The Journal of Wildlife Management 77: 226–234. 688
Durand, J. D., H. Blel, K. N. Shen, E. T. Koutrakis &B. Guinand, 2013. 689
Population genetic structure of Mugil cephalus in the Mediterranean and 690
Black Seas: a single mitochondrial clade and many nuclear barriers. 691
Marine Ecology Progress Series 474:243–261. 692
Excoffier, L. & H. E. L Lischer,2010. Arlequin suite ver 3.5: a new series of
693
programs to perform population genetics analyses under Linux and
694
Windows. Molecular Ecology Resources 10:564-567.
695
Excoffier, L., T. Hofer & M. Foll,2009. Detecting loci under selection in a
696
hierarchically structured population. Heredity 103:285–298.
697
Faillettaz, R., C. B. Paris & J. O. Irisson, 2018. Larval fish swimming 698
behavior alters dispersal patterns from marine protected areas in the 699
north-western Mediterranean Sea. Frontiers in Marine Science 5:97. 700
Falush, D., M. Stephens & J. K. Pritchard, 2003. Inference of population 701
structure using multilocus genotype data: linked loci and correlated allele 702
29 frequencies. Genetics 164:1567–1587.
703
FAO, 2018. FishStat plus. Capture production 1950-2012, Aquaculture 704
production 1950-2016. Available from
705
http://www.fao.org/fishery/statistics/software/fishstatj/en Accessed
706
March 2018.
707
Fassatoui, C., E. Mdelgi & M. S. Romdhane, 2009. A preliminary
708
investigation of allozyme genetic variation and population structure in
709
common pandora (Pagellus erythrinus, Sparidae) from Tunisian and
710
Libyan coasts. Ichthyological Research 56:301-307. 711
Fassatoui, C., E. Mdelgi& M. S. Romdhane, 2011. Short-term temporal 712
genetic investigation of two populations of Pagellus erythrinus 713
(Linnaeus, 1758, Sparidae) from Western and Eastern Mediterranean 714
basins off the Tunisian coast. Marine Biology Research 7:147–158. 715
Faurby, S. P. H. Barber,2012. Theoretical limits to the correlation between 716
pelagic larval duration and population genetic structure. Molecular 717
Ecology 21: 3419–3432. 718
Félix-Hackradt, F. C., C. W. Hackradt, Á. Pérez-Ruzafa & J. A. García-719
Charton, 2013. Discordant patterns of genetic connectivity between two
720
sympatric species, Mullus barbatus (Linnaeus, 1758) and Mullus
721
surmuletus (Linnaeus, 1758), in south-western Mediterranean Sea. 722
Marine Environmental Research 92:23-34.
723
Franchini, P., L. Sola, D. Crosetti, V. Milana& A. R. Rossi, 2012. Low 724
levels of population genetic structure in the gilthead seabream, Sparus 725
aurata, along the Italian coasts. ICES Journal of Marine Science 69:41-726
50. 727
Galarza, J. A., J. Carreras-Carbonell, E. Macpherson, M. Pascual, S. 728
30 Roques, G. F. Turner & C. Rico,2009. The influence of oceanographic 729
fronts and early-life-history traits on connectivity among littoral fish 730
species. Proceedings of the National Academy of Science USA
731
106:1473–1478. 6 732
Goodman, S. J., 1997. RSTCALC: A collection of computer programs for
733
calculating unbiased estimates of genetic differentiation and determining
734
their significance for microsatellite data. Molecular Ecology 6:881-885.
735
Goudet, J., 2001. FSTAT, a program to estimate and test gene diversities and 736
fixation indices (version 2.9.3). Institute of Ecology, University of 737
Lausanne, Lausanne, Switzerland 738
Hauser, L, & J. R. Carvalho, 2008. Paradigm shifts in marine fisheries 739
genetics: ugly hypotheses slain by beautiful facts. Fish and Fisheries 740
9:333–362. 741
Hedgecock, D. & A. Pudovkin, 2011. Sweepstakes reproductive success in 742
highly fecund marine fish and shellfish: a review and commentary. 743
Bulletin of Marine Science. 87: 971–1002. 744
Hewitt, G. M., 2004. The structure of biodiversity – insights from molecular 745
phylogeography. Frontiers in Zoology 1:4. 746
Horne, J. B., L. van Herwerden, S. Abellana & J. L. McIlwain, 2013. 747
Observations of migrant exchange and mixing in a coral reef fish 748
metapopulation link scales of marine population connectivity. Journal of 749
Heredity 104: 532–546. 750
I.I.M. Istituto Idrografico della Marina 1982 Atlante delle correnti 751
superficiali dei mari italiani 3068. 752
Jombart, T., 2008. Adegenet: a R package for the multivariate analysis of 753
genetic markers. Bioinformatics 24:1403−1405. 754
31 Jombart, T. & I. Ahmed, 2011. Adegenet 1.3-1: new tools for the analysis of 755
genome-wide SNP data. Bioinformatics 27:3070-1. 756
Jombart, T., S. Devillard & F. Balloux, 2010. Discriminant analysis of 757
principal components: a new method for the analysis of genetically 758
structured populations. BMC Genetics 11:94. 759
Jones, G. P., G. R. Almany, G. R. Russ, P. F. Sale, R. S. Steneck, M. J. H. van 760
Oppen & B. L. Williset, 2009. Larval retention and connectivity among 761
populations of corals and reef fishes: history, advances and challenges. 762
Coral Reefs 28: 307–325. 763
Kelly, R. P. & S. R. Palumbi, 2010. Genetic structure among 50 species of 764
the northeastern Pacific rocky intertidal community. PLoS One. 2010 Jan 765
7;5:e8594. 766
Klaoudatos, S. D., G. Iakovopoulos & D. S. Klaoudatos, 2004. Pagellus 767
erythrinus (common pandora): a promising candidate species for 768
enlarging the diversity of aquaculture production. Aquaculture 769
International 12:299–320. 770
Klimogianni, A., G. Koumoundouros, P. Kaspiris & M. Kentouri, 2004. 771
Effect of temperature on the egg and yolk-sac larval development of 772
common pandora, Pagellus erythrinus. Marine Biology 145: 1015–1022. 773
Knutsen, H., P. E. Jorde, C. Andre& N. C. Stenseth, 2003. Fine-scaled 774
geographic population structuring in a highly mobile marine species: the 775
Atlantic cod. Molecular Ecology 12:385–39. 776
Latch, E. K., G. Dharmarajan, J. C. Glaubitz& O. E. Rhodes, 2006. Relative 777
performance of Bayesian clustering software for inferring population 778
substructure and individual assignment at low levels of population 779
differentiation. Conservation Genetics 7:295–302. 780
32 Lemos, A., A. I. Freitas, A. T. Fernandes, R. Goncalves, J. Jesus & C. 781
Andrade, 2006. Microsatellite variability in natural populations of the 782
blackspot seabream Pagellus bogaraveo (Brünnich, 1768): a database to 783
access parentage assignment in aquaculture. Aquaculture Research 784
37:1028–1033. 785
Liggins, L., E. A. Trem, H.P. Possingham & C. Riginos, 2016. Seascape 786
features, rather than dispersal traits, predict spatial genetic patterns in co-787
distributed reef fishes. Journal of Biogeography 43: 256–267. 788
Limborg, M. T., R. Hanel, P. V. Debes, A. K. Ring, C. André, C. S. 789
Tsigenopoulos & D. Bekkevold, 2012. Imprints from genetic drift and 790
mutation imply relative divergence times across marine transition zones 791
in a pan-European small pelagic fish (Sprattus sprattus). Heredity 792
109:96-107. 793
Macpherson, E. & N. Raventos, 2006. Relationship between pelagic larval
794
duration and geographic distribution of Mediterranean littoral fishes.
795
Marine Ecology Progress Series 327:257–265. 796
MEDITS Biological Report 2001 available at
797
http://www.sibm.it/SITO%20MEDITS/principaleprogramme.htm).
798
Millot, C. & I. Taupier-Letage, 2005. Circulation in the Mediterranean Sea.
799
In: Saliot A (ed.) The Mediterranean Sea Vol 5k of Handbook of
800
Environmental Chemistry. Springer: Berlin. p 29–66.
801
Mitarai, S., D. A. Siegel, J. R. Watson, C. Dong, C. & J. C. McWilliams, 802
2009. Quantifying connectivity in the coastal ocean with application to 803
the Southern California Bight. Journal of Geophysical Research 114: 804
C10026. 805
Modica, M.V., V. Russini, G. Fassio & M. Oliverio, 2017. Do larval types 806
33 affect genetic connectivity at sea? Testing hypothesis in two sibling 807
marine gastropods with contrasting larval development. Marine 808
Environmental Research 127 92e101 809
Nanninga, G. B. & A. Manica, 2018. Larval swimming capacities affect 810
genetic differentiation and range size in demersal marine fishes.Marine 811
Ecology Progress Series 589: 1–12. 812
Ovenden, J. R., J. Salini, S. O’Connor & R. Street, 2004. Pronounced 813
genetic population structure in a potentially vagile fish species 814
(Pristipomoides multidens, Teleostei;Perciformes; Lutjanidae) from the 815
East Indies triangle. Molecular Ecology 13: 1991–1999. 816
Palero, F., P. Abello, E. Macpherson, M. Gristina & M. Pascual, 2008. 817
Phylogeography of the European spiny lobster (Palinurus elephas): 818
influence of current oceanographical features and historical processes. 819
Molecular Phylogenetics and Evolution 48:708–717. 820
Pascual, M., B. Rives, C. Schunter & E. Macpherson,2017. Impact of life 821
history traits on gene flow: A multispecies systematic review across 822
oceanographic barriers in the Mediterranean Sea. PLoSONE 823
12:e0176419. 824
Piñera, J. A., D. Bernardo, G. Blanco, E. Vazquez &J. A. Sanchez, 2006. 825
Isolation and characterization of polymorphic microsatellite markers in 826
Pagellus bogaraveo, and cross-species amplification in Sparus aurata 827
and Dicentrarchus labrax. Molecular Ecology Notes 6:33–35. 828
Pinet, P. R., 2009. Invitation to Oceanography, 5th edn. Jones and Bartlett 829
Publishers, Burlington, MA, USA. 830
Piry, S., G. Luikart & J. M. Cornuet,1999. BOTTLENECK: a computer 831
program for detecting recent reductions in the effective population size 832
34 using allele frequency data. Journal of Heredity 90:502–503.
833
Pritchard, J. K., M. Stephens, P. Donnelly,2000. Inference of population 834
structure using multilocus genotype data. Genetics 155:945–959. 835
Ramsak, A., F. Garoia, I. Guarniero, P. Mannini& F. Tinti,2003. Novel 836
polymorphic microsatellite markers for the common pandora (Pagellus 837
erythrinus). Molecular Ecology Notes 3:553–555. 838
Raymond, M. & F. Rousset,1995. An exact test for population 839
differentiation. Evolution 49:1280-1283. 840
R Development Core Team, 2011. R: A language and environment for 841
statistical computing. R Foundation for Statistical Computing, Vienna, 842
Austria ISBN 3-900051-07-0, URL http://www.R-project.org 843
Riginos, C., K. E. Douglas, Y. Jin, D. F. Shanahan, & E. A. Treml, 2011. 844
Effects of geography and life history traits on genetic differentiation in 845
benthic marine fishes. Ecography 34: 566-575. 846
Riginos, C. & L. Liggins, 2013. Seascape genetics: populations, individuals, 847
and genes marooned and adrift. Geography Compass 7: 197–216. 848
Robitzch, V. S. N., D. Lozano-Cortés, N. M. Kandler, E. Salas & M. L. 849
Berumen, 2016. Productivity and sea surface temperature are correlated 850
with the pelagic larval duration of damselfishes in the Red Sea. Marine 851
Pollution Bulletin 105: 566–574. 852
Ryman, N. & S. Palm, 2006. POWSIM: a computer program for assessing
853
statistical power when testing for genetic differentiation. Molecular 854
Ecology Notes 6:600–602.
855
Sabatés, A. & M. P. Olivar, 1996. Variation of larval fish distributions 856
associated with variability in the location of a shelf-slope front. Marine 857
Ecology Progress Series 135: 11–20. 858