HAL Id: tel-01803721
https://tel.archives-ouvertes.fr/tel-01803721
Submitted on 30 May 2018HAL is a multi-disciplinary open access archive for the deposit and dissemination of sci-entific research documents, whether they are pub-lished or not. The documents may come from teaching and research institutions in France or abroad, or from public or private research centers.
L’archive ouverte pluridisciplinaire HAL, est destinée au dépôt et à la diffusion de documents scientifiques de niveau recherche, publiés ou non, émanant des établissements d’enseignement et de recherche français ou étrangers, des laboratoires publics ou privés.
Performance measurement of mobile manipulators
Roger Bostelman
To cite this version:
Roger Bostelman. Performance measurement of mobile manipulators. Robotics [cs.RO]. Université Bourgogne Franche-Comté, 2018. English. �NNT : 2018UBFCK003�. �tel-01803721�
UNIVERSITY OF BURGUNDY
U.F.R. SCIENCES ET TECHNIQUES
THESIS
presented by
Roger BOSTELMAN
to obtain the degree of
DOCTOR OF THE UNIVERSITY
Specialty : COMPUTER SCIENCE
PERFORMANCE MEASUREMENT
OF MOBILE MANIPULATORS
Présentée le 16 mars 2018, devant le Jury composé de:
Prof. Lionel ROUCOULES, ENSAM Aix-en-Provence, Rapporteur (Président)
Prof. Rochdi MERZOUKI, Polytech Lille, Rapporteur
Prof. Abdelaziz BOURAS, University Lyon 2, Examinateur
Frédéric SEGONDS, Maître de Conférences ENSAM Paris, Examinateur Prof. Sebti FOUFOU, Université de Bourgogne, Directeur de Thèse Prof. Dominique MICHELUCCI, Université de Bourgogne, Coencadrant
Abstract
An advanced approach to flexible manufacturing is to move robotic manipulators, using an AGV or mobile robot, called mobile manipulators, between workstations. The use of mobile manipulators can be advantageous in a number of situations. It can result in cost savings when a single mobile manipulator can be used to replace several stationary manipulators. However, mobile manipulators are “a relatively young discipline within robotics.” An extensive literature review of the research leading to commercial mobile manipulators and mobile robots was performed. The performance measurement of mobile manipulators, including a mobile base with an onboard robot arm, is virtually non-existent. However, mobile manipulators are beginning to appear in manufacturing, healthcare, and possibly other industries and therefore, a method to measure their performance is critical to both manufacturers and users of these relatively complex systems. Measurements of mobile manipulators performing standard tasks (poses and motions) are also non-existent except for simply ensuring that the task has been more or less completed. The task chosen for this thesis is assembly due to its requirement for relatively precise system posing.
Performance test methods have lagged behind safety test methods for mobile manipulators which is progressing towards development of a new safety standard in the US. Metrics for safety and performance of mobile manipulators include many areas, such as: safe operation, task completion, time to complete the task, quality, and quantity (i.e., accuracy and repeatability, respectively) of tasks completed. Prior to industrial acceptance and standards development for mobile manipulators, users of these new systems will expect manufacturers to provide real performance data to guide their procurement and assure suitability for given application tasks. Due to the relatively high cost to procure and setup motion tracking systems to measure systems performance, an alternative method for use by manufacturers and users is ideal. A new test method concept that uses an artifact, called the Reconfigurable Mobile Manipulator Artifact (RMMA), is described in this thesis and compared to an optical tracking system that was used as ground truth for the RMMA and mobile manipulator.
System modeling the mobile manipulator system, components, and the associated measurements can help to improve the understanding of these relatively complex systems. Systems Modeling Language (SysML) was chosen and used throughout this thesis because of SysML has reusable software modules for structure, behavior, requirements and parametrics off the mobile manipulator. The models describe the many aspects of measuring mobile manipulator performance also as new research area. The models were evaluated through experiments on an example mobile manipulators’ components and the entire system. SysML was used to describe the theoretical basis of the performance through propagation of uncertainty where mathematical equations are also modeled.
A use case is modeled and described where the concepts researched to measure mobile manipulator performance are applied to a manufacturing implementation. The simplistic nature of the measurement process using the RMMA can be directly applied to today’s manufacturing processes, and extended beyond the contributions of this research to other even more complex measurement needs. The research is also discussed to even apply to cross-industry test methods for exoskeletons worn by humans.
Résumé
Une approche avancée de la fabrication flexible consiste à déplacer les manipulateurs robot entre les postes de travail, en utilisant un véhicule autonome ou un robot mobile, appelé manipulateurs mobiles. L'utilisation de manipulateurs mobiles peut être avantageuse dans plusieurs situations. Par exemple, cette utilisation peut entraîner des économies de coûts lorsqu'un seul manipulateur mobile est utilisé pour remplacer plusieurs manipulateurs stationnaires. Cependant, les manipulateurs mobiles sont «relativement jeune dans la robotique». Une étude approfondie a été réalisée sur les travaux de recherche qui ont menée au développement de manipulateurs mobiles commerciaux. Cependant, la mesure de la performance des manipulateurs mobiles, y compris une base mobile avec un bras de robot à bord, est pratiquement inexistante. Les manipulateurs mobiles commencent à paraître dans les secteurs de la fabrication, de la santé et éventuellement d'autres industries et, par conséquent, une méthode pour mesurer leur performance est essentielle pour les fabricants et les utilisateurs de ces systèmes relativement complexes. Les mesures des manipulateurs mobiles exécutant des tâches classiques (poses et déplacements) sont également inexistantes, sauf pour s'assurer que la tâche a été plus ou moins complétée. Pour ce travail de thèse, nous nous concentrons sur les manipulateurs mobile exécutant une tâche d’assemblage. Cette tâche est choisie car elle exige un système de pose très précis.
Les méthodes de mesure de performances des manipulateurs mobiles n’ont pas connu les mêmes avancées que les méthodes de test de sécurité qui progressent vers le développement d'une nouvelle norme de sécurité aux États-Unis. Les mesures pour la sécurité et les performances des manipulateurs mobiles incluent de nombreux domaines, tels que: l’usage sécurisé, l'achèvement de la tâche, le temps nécessaire pour compléter la tâche, la qualité (en terme de précision) et la quantité (en terme de répétabilité) des tâches réalisées. En attendant l’adoption des manipulateurs par l’industrie et le développement des normes appropriées, les utilisateurs de ces nouveaux systèmes s'attendront à ce que les fabricants fournissent des données de performance réelles pour guider leurs choix d’investissement et assurer l'adéquation pour les tâches à réaliser. En raison du coût relativement élevé pour l’achat et la mise en place d’un outil de suivi mouvements pour mesurer les performances des manipulateurs mobiles, il est nécessaire de proposer une méthode alternative pour les fabricants et les utilisateurs. En effet, nous avons conçu et mis en œuvre une nouvelle de méthode de test qui utilise un composant, appelé Reconfigurable Mobile Manipulator Artifact (RMMA). Cette méthode est décrite dans cette thèse et comparée à un système de suivi optique.
La modélisation des composants, des mesures associées, et du flux d’informations d’un système de manipulation mobile peut aider à mieux comprendre ces systèmes relativement complexes. Le langage de modélisation des systèmes (SysML) a été choisi et utilisé tout au long de cette thèse pour représenter le système manipulateur mobile. Le choix de SysML est motivé par le fait qu’il offre des modules logiciels réutilisables pour représenter la structure, le comportement, les exigences et les paramètres du manipulateur mobile. Les modèles ont été évalués à travers des expériences sur un exemple de composants de manipulateurs mobiles et l'ensemble du système. SysML a été utilisé pour décrire la base théorique de la performance par propagation de l'incertitude où les équations mathématiques sont également modélisées.
Un cas d'utilisation est modélisé et décrit où les outils que nous avons développé pour mesurer la performance du manipulateur mobile sont appliqués dans un contexte de fabrication. La nature simpliste de la méthode de mesure proposée, qui utilise le RMMA, permet son application directe aux processus de fabrication actuels et son extension pour mesurer des processus encore plus complexes. L’application de la méthode proposées à d’autres domaines est également discutée.
Table of Contents
List of Tables ... 9
List of Figures ... 10
1. INTRODUCTION ... 15
1.1. Motivation for Performance Measurement of Mobile Manipulators ... 15
1.2. Overview of Current Performance Measurements ... 17
1.3. Challenges of Measuring Performance of Mobile Manipulators ... 24
1.4. Structure of the Document ... 28
2. RELATED WORK ... 30
2.1. Mobile Manipulator Research ... 30
2.2. Experimental Applications ... 31
2.3. Planning and control... 35
2.3.1. Unified Motion ... 35 2.3.2. Trajectory Planning ... 36 2.3.3. Configuration Optimization ... 36 2.3.4. Multiple Tasks ... 37 2.3.5. Stability ... 37 2.3.6. Obstacle Avoidance ... 38 2.3.7. Outdoor Use ... 39 2.3.8. Miscellaneous ... 39 2.4. Performance Measurements ... 40 2.4.1. Calibration ... 40 2.4.2. Standards ... 42
2.4.3. Artifacts to Evaluate Performance ... 42
2.4.4. Robot Performance Measurement ... 43
2.4.5. Mobile Robot Performance Measurement ... 44
2.4.6. Mobile Manipulator Performance Measurement ... 45
2.5. Conclusions ... 46
3. SYSTEM MODELING AND MEASUREMENT ... 49
3.1. System Modeling... 49
3.2. Measurement Systems ... 51
3.2.1. Optical Tracking Measurement System Model ... 51
3.3. Measurement Systems Uncertainty ... 59
3.3.1. Optical Tracking System ... 59
3.3.1.1. OTS manufacturer calibration process ... 59
3.3.1.2. Measuring the OTS ... 59
3.3.1.3. Wall movement... 66
3.3.1.4. Missing data ... 67
3.3.2. RMMA... 67
3.3.2.1. Machining tolerances ... 68
3.3.2.2. Reflector types ... 68
3.3.2.3. Registration orientation uncertainty ... 76
3.3.2.4. RMMA movement ... 76
3.4. Conclusions ... 77
4. MOBILE BASE ... 80
4.1. Mobile Base Models... 83
4.1.1. Mobile Base ... 83
4.1.2. Tests ... 84
4.2. Mobile Base Calibration... 86
4.2.1. Facility-Reflector Calibration ... 86
4.2.2. AGV Calibration... 88
4.3. Navigation Performance Evaluation ... 97
4.3.1. Navigation Experiments ... 98
4.3.2. Performance Analysis and Results ... 99
4.3.3. Recommended Test Method ... 108
4.4. Docking Performance Evaluation ... 108
4.4.1. AGV Docking ... 108
4.4.2. Mobile Robot Docking ... 111
4.5. Mobile Base Stability ... 114
4.5.1. AGV Stability ... 114
4.5.2. Mobile Robot Stability ... 115
4.5.3. Obstacle Detection and Avoidance ... 117
4.6. Conclusions ... 119
5. MANIPULATOR ... 121
5.1. Models ... 121
5.1.2. Tests ... 122
5.1. Manipulator Performance ... 123
5.2. Manipulator-to-Mobile Base Measurement ... 130
5.2.1. Manual calibration method ... 131
5.2.2. Calibration using Ceres Solver ... 133
5.2.3. Closed-Form Solutions ... 137
5.3. Conclusions ... 139
6. MOBILE MANIPULATOR PERFORMANCE MEASUREMENT ... 141
6.1. Models ... 141
6.2. Methods ... 145
6.2.1. Manipulator Base Positioning ... 145
6.2.1.1. Static Control ... 147
6.2.1.2. Index Control ... 147
6.2.2. Mobile Manipulator Registration ... 157
6.2.3. Experiments and Results ... 160
6.2.3.1. Experiment 1 - Static + Fine Circular Search ... 160
6.2.3.2. Experiment 2 – Static + Fine Square Search ... 167
6.2.3.3. Experiment 3 – Index + Bisect with Fine Square Search ... 168
6.2.3.4. Experiment 4 – Index + Bisect with Fine Square Search ... 171
6.2.3.5. Experiment 5 – Index + Bisect with Fine Square Search ... 171
6.2.3.6. Experiment 6 – Index + Bisect with Fine Square Search ... 172
6.2.3.7. Mobile Manipulator Performance Data ... 173
6.2.3.8. Experiment 7 - Visual Method ... 175
6.2.3.9. Time Correspondence Between Systems ... 177
6.3. Propagation of Uncertainty ... 179
6.4. Performance Measurement of Mobile Manipulators Use Case ... 184
6.5. Conclusions ... 186
7. THESIS CONTRIBUTIONS AND FUTURE WORK ... 189
7.1. Summary of Thesis Contributions ... 189
7.2. Beyond This Thesis ... 193
7.2.1. Non-horizontal RMMA Performance Measurement of Mobile Manipulators 193 7.2.2. Dynamic Performance Measurement of Mobile Manipulators ... 193
7.2.4. Cross-Industry Test Methods – Wearable Robots ... 194 8. BIBLIOGRAPHY ... 196
L
IST OFT
ABLESTable 1. Metrics and the corresponding numbered measurement systems to measure mobile manipulator
performance where the systems used to measure mobile manipulator performance may be constrained by the measurement system. Boxes marked with an “x” indicate utility in performance measurements, while boxes highlighted in yellow or red indicate limited or no utility, respectively toward measuring the specified metrics.
... 21
Table 2. Metrics and the corresponding numbered measurement systems to measure mobile manipulator performance where the systems used to measure mobile manipulator performance are not constrained by the measurement system. ... 22
Table 3. Experimental results for two trials to test the OTS dynamic uncertainty. ... 62
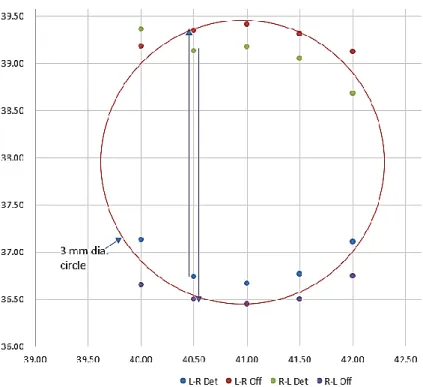
Table 4. Data from the laser retroreflector scanning a 3 mm diameter Orafol AC1000 reflector. ... 72
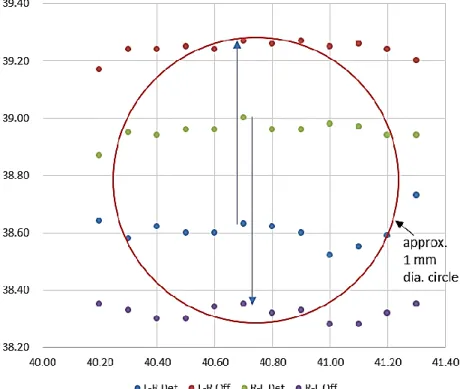
Table 5. Data from the laser retroreflector scanning a 1.07 mm diameter Orafol AC1000 reflector... 73
Table 6. Aperture openings above the Orafol AC1000 reflector showing the laser retroreflector detection or no detection. ... 76
Table 7. GT measured distances, with respect to the GT origin, of the RMMA movement ... 77
Table 8. Statistical uncertainty (in mm) of the AGV navigating circle paths without adjusting the AGV’s origin or rotation. ... 103
Table 9. Statistical uncertainty (in mm) of the AGV navigating circle paths after adjusting the AGV’s origin and rotation. ... 103
Table 10. Statistical uncertainty (in mm) of the AGV navigating square paths after adjusting the AGV’s origin and rotation. ... 104
Table 11. Docking performance results for a mobile robot base showing commanded versus manipulator controller displayed uncertainties. X and Y are in mm and Theta is in degrees. ... 112
Table 12. Ground truth measured distances, with respect to the ground truth origin, showing the AGV movement when stopped beside the RMMA and while the laser retroreflector attempts to detect RMMA reflectors. ... 115
Table 13. Universal Robot UR10 Specifications ... 125
Table 14. Approximate maximum drift in mm for the 60 measurements shown in Figure 65. ... 128
Table 15. Results of repeatability uncertainty for the square pattern of manipulator stop points performed onboard the AGV. ... 130
Table 16. Difference (in mm) of the commanded AGV versus AGV tracked data for the AGV stop point beside the RMMA. ... 162
Table 17. Uncertainty (in mm) in the distance between the RMMA origin and the AGV origin in the RMMA plane. ... 163
Table 18. Actual reflector point locations and mean mobile manipulator positions when the laser retroreflector detected the reflector for the remaining 32 times as compared to each reflector center. ... 164
Table 19. Pass/Fail and dwell time results for detecting the reflector without a search. ... 165
Table 20. Manipulator tool center point positional repeatability uncertainty, as logged by the manipulator and logged by the OTS, when the laser retroreflector detected the reflector for the remaining 32 times. ... 166
Table 21. Test results of the mobile manipulator accessing the RMMA from various Stop Points (see Figure 4) and various AGV poses. The gray rectangle in the center of the Stop Points map shows the approximate RMMA square and circle pattern locations. ... 170
Table 22. Mobile manipulator registering to the RMMA using the bisect search method. ... 172
L
IST OFF
IGURESFigure 1. (a) SysML package diagram showing the mobile manipulator and measurement system structure. (b) Mobile manipulator and measurement systems used for this thesis. (c) SysML block diagram of mobile
manipulator components and interconnections. ... 28
Figure 2. Timeline of mobile manipulator development. ... 32
Figure 3. EL-E mobile manipulator ... 34
Figure 4. Graphical depiction of the Stanford Assistant Mobile Manipulators (SAMM) carrying a pipe. ... 34
Figure 5. Meka M1 Mobile Manipulator. ... 35
Figure 6. NIST Robot Calibrator. ... 41
Figure 7. Graphic of the NIST mobile manipulator artifact showing (a) adjustable height table with multiple geometric patterns of tapped holes and (b) flat (top/bottom), concave (inside edge), convex (outside edge) patterns of holes for mounting reflectors or laser retroreflectors and designed to mount into circular or sinusoidal shapes. ... 43
Figure 8. SysML internal block diagram showing the optical tracking measurement system structure. ... 52
Figure 9. RMMA CAD drawing showing fiducials mounted in a double-curved pattern, as well as showing circle, multiple squares, and triangular patterns. ... 54
Figure 10. (a) Mobile manipulator beside the horizontal RMMA configuration and CAD models of (b) vertical (c) and overhead RMMA configurations. (d) Dimensioned drawing of RMMA. ... 55
Figure 11. (a) Angled “surface connectors” for “fid-refl-reducer-fixed” (left-foreground) showing 15⁰ incremental markings attached to the RMMA. (b) Inset of (a) showing relative axes with respect to the RMMA edge to the square-base of the angled fiducial adapter. Other vertically-mounted “fid-refl-reducer-fixed” are shown in the background. (c) “fid-refl-reducer” attached to the RMMA and (d) “fid-refl-reducer” components. ... 56
Figure 12. Laser retroreflector sensor (yellow and black) and sensor assembly attached to a robot adapter. Spherical OTS markers are also shown attached to the laser retroreflector, robot, tool-mount, and the AGV (background). (b) Collimator dimensions and laser retroreflector measurement distances and offsets. ... 56
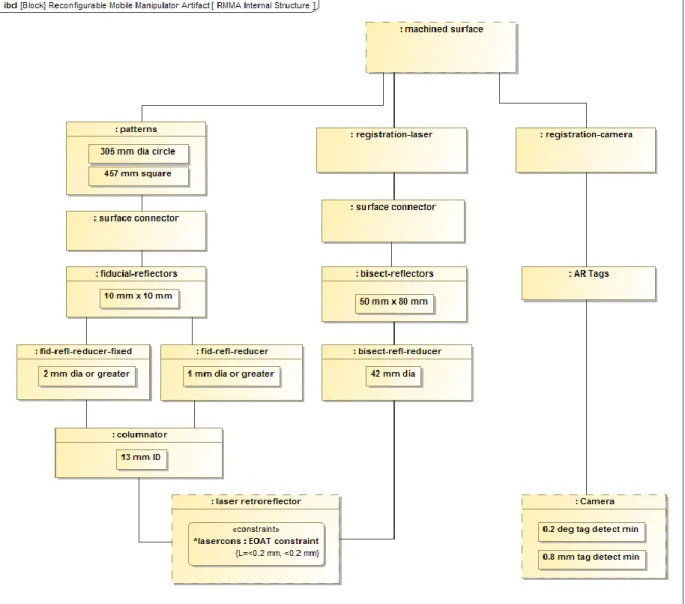
Figure 13. SysML internal block diagram showing the reconfigurable mobile manipulator artifact (RMMA) structure. ... 58
Figure 14. OTS calibration method used to calibrate the OTS: (a) coverings for all reflective surfaces and objects, (b) reference frame located on the floor. ... 60
Figure 15. OTS calibration artifact (see inset) and placed on the floor for static measurement. ... 61
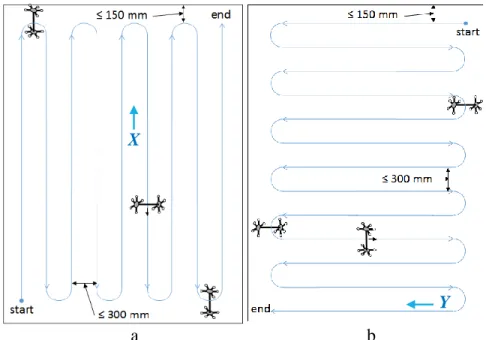
Figure 16. (a) Forward-back (aligned with the X axis) and (b) side-to-side (aligned with the Y axis) paths and dimensions for moving the artifact in a test space. ... 62
Figure 17. The artifact (shown with axes on the bar centroid) orientations with respect to the path: (a) perpendicular to the path segments in the plane of motion, (b) perpendicular to the path segments and normal to the plane of motion, and (c) in-line with the path segments in the plane of motion. ... 62
Figure 18. Sample data plot of the X and Y tracked paths of the artifact center. ... 62
Figure 19. Histogram plots of the 99.7th percentile data shown in Table 1 for (a) Length from Trial 1, (b) Length from Trial 2, (c) Angle from Trial 1 and (d) Angle from Trial 2. The Gaussian distribution (red) is shown for comparison. ... 66
Figure 20. Laser tracker measuring a laboratory, outside-wall, mount (a) that supports an optical tracking system camera. On the right is the (b) inside-wall mount that was measured. ... 66
Figure 21. Laser tracker data from measurement of two camera mounts supporting optical tracking system cameras inside the laboratory on (a) an outside block wall and (b) an inside block wall. The horizontal axis is in sample points and the vertical axis is in mm. ... 67
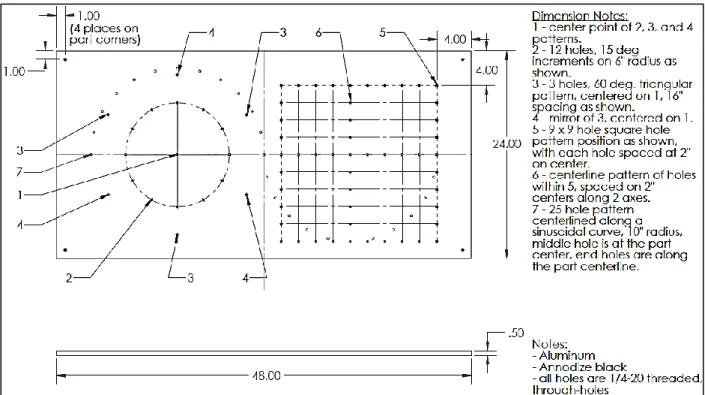
Figure 22. RMMA computer aided design drawing provided to a machinist to make the part. Dimensions are shown in inches. ... 68
Figure 23. Photos showing various reflectors, (a) not illuminated and (b) illuminated with flash, that were tested with the laser retroreflector. ... 69
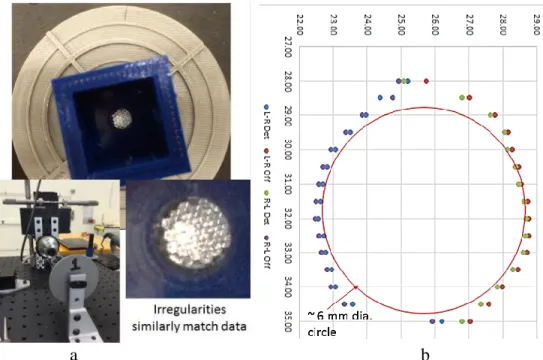
Figure 24. (a) Micrometer-driven, X-Y stage with laser retroreflector mounted horizontally. (b) Laser retroreflector shining on an example reflector being tested. (c) Non-illuminated, 6 mm diameter, honeycomb reflective tape being tested. (d) Plotted data from a raster scan of the reflector using the X-Y stage. ... 71
Figure 25. (a) Setup (lower left), reflector within the 3D printed reflector cover (top), close-up of the reflector, and (b) results of testing a micro-reflector with the micrometer X-Y stage where the graph in (b) was rotated
attempting to match the rotation of the close-up reflector photo. ... 71
Figure 26. Plotted data from the laser retroreflector mounted to a micrometer X-Y stage used to scan a 3 mm diameter Orafol AC1000 reflector. ... 73
Figure 27. (a) Experimental setup of the laser retroreflector mounted to a micrometer X-Y stage and the aperture within a 3D printed (gray) housing. (b) Close-up of the aperture and housing. (c) The aperture removed from the housing and beneath a scale and 1.07 mm drill bit. (d) Close-up of the aperture showing an oval shape. ... 75
Figure 28. Plotted data from the laser retroreflector mounted to a micrometer X-Y stage used to scan a 1.07 mm diameter Orafol AC1000 reflector. ... 75
Figure 29. Graphic of possible orientation uncertainty when the reflector center is not detected. ... 76
Figure 30. GT data points relative to the GT system origin (in mm) of the RMMA movement over time (in minutes), shown by the varying colors, while the manipulator moves. ... 77
Figure 31. AGV with onboard manipulator behind an autonomous mobile robot (foreground) and the RMMA between the vehicles. ... 81
Figure 32. SysML internal block diagram of the mobile base (AGV) and subcomponents. ... 84
Figure 33. High-level diagram of the AGV control and monitoring applications used in this thesis. ... 84
Figure 34. SysML block definition diagram of mobile manipulator tests that depend on performance of the mobile base. ... 86
Figure 35. a) AGV reflector illuminated by flash, b) novel AGV reflector cover (left) and repeatable marker pose apparatus (RMPA) parts (right), and c) AGV reflector with cover and RMPA attached. A third, randomly placed marker is mounted to the wall (right) since a minimum of 3 markers are required for OTS measurement of the reflector. The OTS markers could be replaced by laser tracker retroreflectors or other measurement system markers. ... 87
Figure 36. Current AGV calibration method showing (a) an onboard laser, (b) an initial laser spot position, and (c) a moved-AGV laser spot position on a piece of paper taped to the wall. The difference in lateral motion is shown in (c). ... 89
Figure 37. Marking out toe-in angle on a sheet of paper. ... 92
Figure 38. Path deviation is measured relative to a tape measure stretched between start and end points marked on the floor (a) AGV at start point (b) AGV at mid-point showing deviation from straight path. ... 93
Figure 39. Crabbing is measured as the AGV moves past a fixed reference point (a) measuring from front of vehicle to corner of table (b) measuring from back of vehicle to table corner. ... 94
Figure 40. Actual distance traveled is measured using a tape measure on the floor with ruler used as a reference point on the vehicle. ... 96
Figure 41. (a) NIST metrology bar used to measure ground truth system uncertainty. (b) Commanded AGV paths. ... 98
Figure 42. (top) Test setup showing the AGV traversing a path and cameras mounted to walls and (bottom) virtual multi-camera system display of the cameras, AGV, and relative workspace. ... 100
Figure 43. Graphed data of the distance uncertainty for the AGV lab. The orange straight line, circle, and rounded square depict the approximate size and location for AGV tests. ... 101
Figure 44. Example reconfigurable apparatus for navigation tests for various AGV sizes. ... 101
Figure 45. Ground Truth (red) and AGV (green) data of the straight-line path tests. Scales for X and Y axes are in meters where the X axis has been expanded to clearly show the AGV performance as compared to OTS measurement. The blue line represents the commanded path from pt 1 to pt 2 and back moving in the forward and reverse directions as shown. ... 102
Figure 46. OTS (blue) and AGV (green) data of the 3 m diameter circle path tests for AWS steering. ... 103
Figure 47. OTS (blue) and AGV (green) data of the 3 m square path tests for AWS steering. ... 104
Figure 48. AGV navigation test setup. ... 106
Figure 49. (a) B56.5 test piece (black cylinder) used to define safety laser edge (note red emergency stop light (within the red circles) is on), (b) barrier (black) painted wood panel, blue lines spaced at 2 cm, and spherical reflector for ground truth system, (c) AGV emergency stopped, as noted by the red/yellow light, upon detection of barriers during a test. ... 107
Figure 50. Example graphical results of navigation tests showing ground truth data of: (a) test 8 vehicle path and emergency stopped vehicle (red circle) when a wall was detected, (b) test 1 path, and (c) test 1 path data from (b) zoomed in to show (red, green, and blue) data points from three runs. ... 108 Figure 51. (a) Example docking test method using various AGVs (e.g., 1 and 2 for AGV unit load tray table
docking, 3 for fork and tugger AGV docking). “a” and “b” are fixed points in space (e.g., contact or non-contact sensor locations in space). Approach vectors and sensor point spacing and locations are variable. (b) Fork-type AGV docking with a docking apparatus. ... 109 Figure 52. (a) Map of commanded segments and stop points and (b) stop point uncertainty of a single AGV point for each location in (a) averaged over 5 runs. ... 110 Figure 53. Experimental mobile robot docking setup showing grids (see close-up taped to the floor next to the
RMMA and at each of six docking positions (one is beneath the inset). ... 112 Figure 54. (a) Screenshot of an example vehicle pose taken during the docking experiment showing the floor grid
and docking test point apparatus. (b) Top view of the camera, docking test points, and grids. ... 113 Figure 55. Example showing location 6 grid results of the mobile base docking experiment. Note the points marked
on the grid indicating the varying repeatability at this location. ... 113 Figure 56. Ground truth data points relative to the ground truth system origin (in mm) of the stationary AGV
movement over time (in minutes), shown by the varying colors, while the manipulator moves. ... 115 Figure 57. Photos (a, c, e) and OTS screenshots (b, d, f) of the three manipulator poses during the mobile robot static movement. ... 117 Figure 58. Plot of Lynx movement vs time when the mobile robot is stationary and the onboard manipulator moves
from stow to a near point to the vehicle and then to an extended reach point. ... 117 Figure 59. Obstacle avoidance test resulting pose points marked on a floor grid. ... 118 Figure 60. SysML internal block diagrams of the physical manipulator (Robot arm) subcomponents. ... 122 Figure 61. SysML block definition diagram of mobile manipulator tests that depend on performance of the
manipulator. ... 123 Figure 62. Example test end effector from ISO 9283. ... 124 Figure 63. Example test cube and paths within the cube from ISO 9283. Tests performed in this thesis use the lower left Plane 3 configuration and test to the outer perimeter and points shown in red. ... 125 Figure 64. (a) Illuminated markers from camera flash (green lines show manipulator motion pattern) and (b) OTS
screenshot of the manipulator and ground truth square pattern of markers. (b) The EOAT rigid body centroid was snapped to marker 1 after (c) the laser retroreflector was aligned (red dot on marker) to marker 1 of the ground truth square pattern of markers. (d) Manipulator motion trajectories (black lines) between the four, square pattern stop points. ... 127 Figure 65. Plots of OTS data results from 15 repeatability measurements at each corner of the square pattern for
manipulator (a) pose 1, (b) pose 2, (c) pose 3, and (d) pose 4. ... 128 Figure 66. (a) Plotted OTS data from 60 measurements, 15 at each corner of a square pattern. The angled offset
shows the misalignment of the manipulator base to the AGV, as well as the performance uncertainty of the manipulator since all angles are not the same. (b) Example offset for pose 1 to pose 2 trajectory that is
subtracted from the offset measurement as in Table 15 “Arctangent of offset”. ... 129 Figure 67. Mobile manipulator (green) positions relative to the RMMA (gray) selected for manual calibration of
manipulator (blue) mounting offset. ... 132 Figure 68. Position and orientation of AGV relative to the RMMA from manually collected calibration data. ... 135 Figure 69. Docking locations used for automated data collection and system evaluation. ... 136 Figure 70. (blue) AGV position along x-axis, normalized to the first sample, x(1); (red) the mean of the normalized
x value from x(1) to x(n). ... 137 Figure 71. SysML activity diagram showing the flow of activities for mobile manipulator performance
measurement. ... 143 Figure 72. SysML sequence diagram of mobile manipulator performance measurement using the RMMA. ... 144 Figure 73. CAD models of the RMMA-2 shown in the (a) vertical and (b) horizontal configurations. (c)
Manufactured RMMA-2 shown in an approximately 20⁰ tilted configuration and near the RMMA-1
Figure 74. (a) CAD model of the AGV segments (paths) (blue lines) and stop points (black dots on paths), and approximate locations of AGV wall-mounted reflectors (green circles with X’s) used for navigation. (b) AGV stop locations corresponding to the CAD model, point numbers corresponding to the transport structure point, and vehicle orientations at each stop location (with reference frame above the table). The left straight-to-right turn path beginning at the unmarked home triangle was not used for these tests. ... 149 Figure 75. Transport Structure program designed using NDC8 Systems Application Designer Program and used to
control the AGV to the 10 poses shown in Figure 76 and along the segments and to stop points shown in Figure 74 (a)... 150 Figure 76. Ten different AGV poses for testing mobile manipulator performance. ... 152 Figure 77. Example of the large motions that the AGV was programmed to perform (view left to right and top to
bottom), in this case moving from the home position to docking with the RMMA at pose #2. ... 154 Figure 78. SysML internal block diagrams of the control software components. ... 155 Figure 79. Example manipulator control log file and highlighted timestamped data line that corresponds with the
AGV and OTS log files. ... 156 Figure 80. Example OTS log file and highlighted timestamped data line that corresponds to the AGV and
manipulator control log files. ... 156 Figure 81. Generic, parameterized search strategies for peg-in-hole insertion include the walking stochastic search
(A), the spiral search (B), and the raster search (C). ... 158 Figure 82. (a) Square spiral search with numbers at each step. [239] (a) Example square step search pattern drawing.
The pattern begins with the yellow arrow dotted end and ends when the reflector is detected with the red arrow search step. ... 159 Figure 83. High level reference frame drawing showing the system components and bisect search concept. ... 160 Figure 84. Static test configuration showing the mobile manipulator beginning the performance measurements. The
manipulator test pattern is shown with red dashed lines between four vertices of a 457.20 mm square. ... 161 Figure 85. Screen capture from the OTS showing the AGV, manipulator, and the RMMA. ... 162 Figure 86. Comparison of the nominal (blue) and measured (red) poses of the registration artifact reflectors after the
first search repetition. The expected positions for 𝑝2 through 𝑝4 are updated based on the measurements of the prior target locations. ... 163 Figure 87. (a) GT data of time at each of four locations in Run 1 for 33 times over approximately 10 min as
expressed by the color bar. (b) Close-up showing the first spiral search at location 1 beginning Run 1 and no search detect (inset) at location 1 for the remaining 32 times. ... 164 Figure 88. Circular search pattern over two different sized fiducials: (left) 2 mm diameter and (right) 6.2 mm
diameter. The center gray represents the fiducial, the blue represents the fiducial cover with center hole, and the dark gray represents the collimator. Red lines are drawn at the two marked radii depicting arc step lengths. ... 167 Figure 89. Experimental setup of the RMMA for the Bisect with Fine Search Method. ... 169 Figure 90. RMMA showing circle and square patterns of fiducials for the mobile manipulator to index between. . 169 Figure 91. Highlighted (white) AGV- and robot-mounted markers and AGV wall-mounted reflectors. Two robot
link markers were used, one is shown and one on the opposite side of the link (not shown). Robot base markers were not included in Tests 1 and 2. ... 174 Figure 92. OTS markers located on the bisect reflector, circle pattern fiducial, and square pattern fiducial locations
of the RMMA measured for use as ground truth. The associated bisect reflectors and fiducials and lying next to their respective mounting locations. ... 174 Figure 93. Screen shots of OTS rigid bodies developed for the (a) AGV and robot and (b) the RMMA... 175 Figure 94. ARToolkit average absolute error versus perpendicular camera position with respect to the target. ... 177 Figure 95. Screen shot of time offset between a local computer clock and a GPS-locked NTP time server over the
course of 24 hours to establish a baseline approximation of the synchronization precision. ... 178 Figure 96. Example time correspondence across the robot, OTS, and AGV files output from the Time
Correspondence program. ... 179 Figure 97. Drawing showing the uncertainty propagation for performance measurement of a mobile manipulator. 180 Figure 98. SysML package diagram showing the mobile manipulator and RMMA components that add to
Figure 99. SysML block definition diagram applying equation 15 showing the constraints for the AGV, Manipulator Base, and EOAT that reference to the World constraint. ... 183 Figure 100. SysML parametric diagram showing the uncertainty propagation for a mobile manipulator. ... 184 Figure 101. SysML use case diagram of an optical tracking system (green tasks) in parallel with the RMMA (yellow
tasks) used to measure performance of a mobile manipulator as may be found in a production facility during operation. The addition on the three blue head actors were required during research and are not required for a production case. ... 185 Figure 102. (a) Gazebo simulation snapshot of the Marquette dynamic mobile manipulator performance
measurement. Note the sinusoidal markers on the ground. (b) Snapshot of the spiral search evaluation using the proof-of-concept platform towards dynamic mobile manipulator performance measurement by Marquette University. (c) Plotted trajectory of the end effector as observed by the optical tracking system in an
experiment. ... 194 Figure 103. Graphics of a human wearing arm exoskeletons (red) testing its performance using the RMMA for
precision assembly applications when the RMMA is in (a) horizontal, (b) vertical-low, (c) vertical-high, and (d) overhead-angled configurations. ... 195
1. INTRODUCTION
Industry is making increasing use of robotics for material transport and processing. These robotic systems make use of many innovative sensing technologies [1][2][3][4] and control techniques [5][6][7][8] to improve their versatility and agility. The traditional approach to flexible manufacturing is to use mobile robots to transport materials [7][9] between workstations containing stationary robotic manipulators [5]. Another approach is to move the robotic manipulators between the workstations [10] using an automatic guided vehicle (AGV). This configuration is referred to, as in this thesis, as a mobile manipulator. The use of mobile manipulators can be advantageous in a number of situations. It can result in cost savings when a single mobile manipulator can be used to replace several stationary manipulators. The use of mobile manipulators is also useful in cases where the item being worked on is too large to be easily moved. Throughout this paper the term manipulator will refer to the robotic manipulator arm mounted on the mobile base, and the mobile base will be referred to as the AGV, or in some cases a mobile robot which is typically more autonomous than an AGV. The combination is referred to as a mobile manipulator.
The performance measurement of mobile manipulators, including a mobile base with an onboard robot arm, is virtually non-existent. However, mobile manipulators are beginning to appear in manufacturing, healthcare, and possibly other industries and therefore, a method to measure their performance is critical to both manufacturers and users of these relatively complex systems. Modeling the mobile manipulator can help to reduce the understanding of system complexity and is an overarching computer science theme to this thesis research. Additionally, this thesis: presents the challenges of measuring performance of mobile manipulators; discusses research that defines appropriate methods to measure performance of these systems; and simplifies the measurement method with a novel approach using artifacts to be extended to standard test methods and even measurement beyond mobile manipulators to exoskeletons worn by humans. Section 1.1 states the motivations for performance measurement of mobile manipulators. Section 1.2 provides an overview of the current performance measurements that have occurred for these systems. Section 1.3 presents the challenges related to measuring performance of mobile manipulators as most are currently non-existent. Finally, Section 1.4 presents the structure of this document and briefly describes the proposed approach to address these problems.
1.1.
Motivation for Performance Measurement of Mobile
Manipulators
The importance and popularity of research toward mobile robots and mobile manipulators (robotic arms on mobile bases) has grown in recent years [11]. This emphasis on research and development has also spiked in recent years due to advances in technology that have enabled broad use of automation and robotics while simultaneously reducing costs. In general, mobile manipulators have been more recently researched and are now becoming commercial tools for industrial use [12][13][14]. In research, considerations have focused on the coordination of movements of the robot and the base to perform tasks since redundant degrees of freedom (DoF) are created by adding the moving base. However, measurements of mobile manipulators performing standard tasks (poses and motions) are non-existent except for simply ensuring that the task has been more or less completed. Safety test methods for mobile manipulators is beginning in the research [15] and is progressing towards development of a new safety standard in the US [16]. Performance
test methods have lacked the same research push. Although mobile manipulators have been researched for use in many areas including marine [17], undersea [18], agriculture [19], and space [20] applications, this thesis mainly focuses on manufacturing, specifically assembly operations, and industrial applications where measurements are performed inside a facility. However, similar performance measurement methods, such as using artifacts described throughout this thesis, could potentially be applied to mobile manipulators used in other industries as well. As shown above, the application of mobile manipulators can be vast and measuring their performance across all applications could appear to be unending. Therefore, it is important for this thesis research to narrow the focus and pose a specific case study to set the context. As assembly is a relatively new and difficult application for mobile manipulators, this shall be the task.
The case study for this thesis therefore includes:
• repeatedly measuring any mobile manipulator to perform assembly tasks, • a fixtureless mobile base,
• a rapid, non-contact measurement test method for in-situ use,
• a relatively inexpensive measurement system for vast adoption by manufacturers and users. Associated with this case study is the fact that mobile manipulators must, for example, navigate (e.g., path plan, be controlled, remain stable, etc.) to and dock with an assembly station. Hence, to be thorough, this thesis covers metrics and measurement systems that are useful for all aspects of the case study, including the mobile manipulator components, mobile base, and manipulator. An example mobile manipulator consists of a six DoF robot arm mounted onboard a wheeled base (e.g., AGV or mobile robot) with two translational and one rotational DoF in the horizontal plane for a total of nine DoF [21]. Some mobile manipulators have more or fewer DoF and may also be equipped with vertical axis motion control of the robot arm base. Holonomic and non-holonomic are frequently used terms throughout mobile robot research to describe system kinematics. Mobile manipulator control can range from manual teleoperation to full autonomy (i.e., an operator or facility management system controls the mobile manipulator using typically high level remote commands to the onboard controller with no direct operator interface).
Two motivations for this thesis research are therefore, mobile manipulator metrics to measure and the measurement system and/or method to do so. Metrics for safety and performance of mobile manipulators include many areas, such as: safe operation, task completion, time to complete the task, quality, and quantity of tasks completed. Inherent in “quality” and “quantity” are the mobile manipulator accuracy and repeatability, respectively. These metrics not only include task completion but also focus on how well and how many times the task was completed.
Prior to industrial acceptance and standards development for mobile manipulators, users of these new systems will expect manufacturers to provide real performance data to guide their procurement and assure suitability for given application tasks. Robot performance measurements typically include the difference in position and orientation (pose), of the end of arm tooling (EOAT) from the commanded robot pose. Without tested measurement methods to ensure mobile manipulator performance, system users must rely on manufacturers specifications that may or may not be valid. Ground truth measurement, used to compare to a system-under-test (SUT), or the mobile manipulator in this case, is “evaluated with respect to a device whose accuracy is well-known and at least one order of magnitude higher than that of the device to be evaluated.” [22]
Ground truth measurement using motion tracking systems provides static and dynamic and relatively accurate robot joint, segment, or tool point position information, enabling comparisons with the commanded pose. Review of robot, mobile robot, and mobile manipulator performance measurement research shows that use of motion tracking systems is a relatively new technique for performance evaluation within the research community. However, assurance from these tracking systems also requires that their accuracy meets or exceeds the ground truth, order of magnitude requirement. Therefore, another motivation is to ensure that the motion tracking system is acceptable as a ground truth system and moreover, that it can be used to measure the performance of mobile manipulators.
Due to the relatively high cost to procure and setup motion tracking systems to measure a SUT performance, an alternative method for use by manufacturers and users is ideal. Machined artifacts are not typically used to measure complex systems such as mobile manipulators and rather only sub-components, such as only the robot arm. However, a novel approach is presented in this thesis proving that artifacts can possess the tolerances and system measurement required of ground truth systems while being an order of magnitude higher in accuracy (i.e., less uncertainty) than the SUT. Should the artifact be feasible for such measurements, measurements cost could be dramatically lower, implementation could be much simpler, and a variety of use case scenarios could be tested. Also noted is that the artifacts could potentially be even less expensive to produce through additive manufacturing (i.e., three-dimensional (3D) printing).
1.2.
Overview of Current Performance Measurements
Metrics
This section includes references that suggest metrics and benchmarks as being useful and yet lacking in robotics. However, as will be shown, the many metrics and the test methods are lacking that describe and test the functionality of mobile manipulators, including the mobile base and robot arm (manipulator) that makeup a mobile manipulator. Albus [23] wrote: “A major barrier to the development of intelligent systems is the lack of metrics and quantifiable measures of performance. There cannot be a science of intelligent systems without standard units of measure. There are few benchmarks or standardized tests wherein performance can be compared.”
Benchmarks play an important role in various aspects. Some see it related to roadmaps where benchmarks may guide developments and make progress in the right directions measurable. Another important aspect is the relation to standards [24]. Benchmarks are the framework leading to standards and alternatively, standards can foster the requirement for benchmarks in a field. This section describes the metrics for mobile manipulators and research that has occurred in this area. Besides the development of a three-dimensional, statistical, evaluation framework for performance measurement of robotic systems [25] dated 1998, the majority of references date research in this area within only the last 14 years (i.e., 2002 – 2016) implying that there is a relatively new thrust in measuring robot performance.
Here are eleven examples from mobile robot and mobile manipulator researchers in references [26] through [36], dating relatively recently from 2002, citing usefulness to directly compare measured results, as well as how the results are obtained (i.e., test methods). Mobile robot navigation is a highly researched robotics challenge and one of the key capabilities for robot autonomy. Navigation techniques have become more and more reliable, but evaluation mainly focuses on individual navigation components (i.e., mapping, localization, and planning) using
datasets or simulations. As an example, performance measures are often neglected in the mobile robot navigation research for applications such as: vacuuming, surface coating, and systematic foraging. In 2002, Wong et al. [26] presented two metrics for measuring performance of robot coverage (i.e., volume accessed by the robot) tasks and applied them to a real robot coverage experiment: percentage of coverage and distance traveled by the robot. The study found that the percentage of coverage is a good performance indicator if physical limitations of the robot are considered. On the other hand, distance traveled alone is a poor indicator because it completely ignores the amount of area (mobile base plus onboard manipulator) covered by the mobile manipulator. In 2014, Sprunk et al. [27] defined an experimental protocol to evaluate the whole navigation system, deployed in a real environment. To ensure repeatability and reproducibility of experiments, their benchmark protocol provided detailed definitions and controls for the environment dynamics (i.e., variations in different environments). They defined standardized environments and introduced the concept of a reference robot to allow comparison between different navigation systems at different experimentation sites. Wong and Sprunk references established one or more metrics (e.g., work volume) and benchmarks (e.g, navigation repeatability/reproducibility), respectively, and therefore begin to uncover measurement aspects that can be applied to mobile manipulators.
Ioan et al. [28] focused on mobile manipulator motion planning and wrote that the robotics community is seeing a growing awareness of the difficulty to compare, in a rigorous quantitative way, the many research results obtained from many different robotic application areas. Further towards comparison of results, Bonsignorio et al. [29] focused on the issues raised by the replication/reproducibility of results. They suggest that one aspect of these results is “a cornerstone of any scientific methodology,” versus being “a basic prerequisite to compare different methods for common problems” previously proposed. In 2003, Jacoff et al. [30] discussed the development and proliferation of metrics in the form of robot test arenas that provide tangible, realistic, and challenging environments for mobile robot researchers interested in (teleoperated) search and rescue applications and other unstructured environments. The concept of test arenas with defined apparatus’ or artifacts may also apply to mobile manipulator performance evaluation for industrial environments.
Lampe and Chatila [31] simulated an approach to qualify robot autonomy by measuring robot performance in completing a task as compared to the robot environment complexity. Steinfeld et al. [32] attempted to identify common metrics for task-oriented, human-robot interaction (HRI). HRI can also pertain to mobile manipulators where it is expected that future smart manufacturing systems will work collaboratively with humans. More recently, specific aspects of robot measurements were considered for smart manufacturing implementation. Two examples were in mobile robots used for welding and in dynamic pose estimation, both of which are critical to also consider for mobile manipulator use. Welding requires process validation prior to use in the manufacturing process. However, there is a lack of industry standards for mechanized or robotic welding that can impede the introduction of mobile robotic welding systems in the market place. There is also a lack of generalized fitness measures that gauge the suitability of mobile robot topologies or dimensional designs to a set of tasks and can be used in the design or verification process. Canfield et al. [33] proposed such a metric and demonstrated its use in evaluating mobile robot designs for welding tasks. Similarly, Eastman et al. [34] reported that an unsolved but important problem in intelligent manufacturing is dynamic pose estimation under complex environmental conditions, i.e., tracking an object’s pose as it moves in an environment with uncontrolled lighting and background. This is a central task in robotic perception, and a robust,
highly-accurate solution would be of use in a number of manufacturing applications.
As an example of metrics suggested in research for mobile manipulators, Ilnicki and Zadarnowska [35] researched the problem of defining performance measures of doubly non-holonomic mobile manipulators. Results consisted of a definition of the following local performance characteristics: the dexterity ellipsoid, the local dexterity, the energy efficiency, and the motion efficiency. Accuracy and repeatability, two common metrics considered in robotics, were described in [36]. Here, Shiakolas et al., identified the factors that affect accuracy and repeatability and developed an error tree. They established what they term the “degree of influence” that qualitatively assesses the relative contribution of each kinematic parameter variation to the accuracy and repeatability of rigid manipulators. However, these two metrics are only part of the overall performance criteria of mobile manipulators.
A common ‘metrics and test methods are needed’ theme was described in references [26] through [36], although each was described referring to only one or more metrics. Based on these few metrics and listed from the writers past research in robotics for industrial use, several other metrics are defined when considering performance of mobile manipulators where the importance of each metric is determined by the commanded task:
• time/task duration – the time for the mobile manipulator to complete a commanded task • distance traveled – the distance that the mobile manipulator has traveled
• repeatability - the variation in measurements taken of the mobile manipulator with the same conditions per trial
• accuracy - the amount that a mobile manipulator measurement conforms to the correct value • task completion/effectiveness – how successful the mobile manipulator is in performing a
commanded task
• efficiency - the ratio of the expected mobile manipulator performance to the total performance.
• dexterity – the agile or nimble performance of a mobile manipulator • autonomy – independent control performance of the mobile manipulator • stability – the firmly established performance of the mobile manipulator
• obstacle detection and avoidance - the ability of the manipulator, mobile base or combined system to perceive and avoid objects in the environment
• exploration of unknown environments - the ability of the manipulator, mobile base or combined system to perceive and navigate the environment that is not currently within the system’s map
Measurement Systems
Given the above metrics to consider for mobile manipulators, a survey of performance measurement systems to achieve these metrics as a ground truth tool is therefore necessary. Some examples of metrology methods for measuring performance of mobile manipulators, with technologies used to access parts or assemblies in manufacturing processes, include: physical contact using a touch probe [37], cameras detecting fiducials [38][39], laser interferometry [40][41], theodolites [42] and coordinate measuring arms [43]. An example uncertainty (position accuracy) for the camera calibration system in [39] was 0.1 mm and 0.2 mm for 650 mm and 950 mm target distances, respectively. Metrology methods in accordance with ISO 9283 [44] for
manipulator-only measurement include, mainly, path accuracy and repeatability, and are listed above, which inherently include: overshoot, drift, exchangeability, reorientation, posing time, static compliance, and deviations scoped in the standard.
Contact and non-contact sensors are readily available to measure various aspects of machine performance and are listed below. Each measurement system is numbered and listed in Table 1 and Table 2 where their suggested usefulness in measuring performance of mobile manipulators based on the metrics is also shown. Table 1 shows the usefulness to measure mobile manipulator performance where the systems used to measure mobile manipulator performance “may be constrained” by the measurement system and Table 2 shows the measurement “not constrained” by the measurement system. Not-constrained means only the distance, not the accuracy measurement capability which could also be affected by a minimal distance measurement capability. The “x” means usefulness in measuring performance, the yellow box means that the system has little use in measurement, and the red box means that the system cannot measure performance of the metric. Some limitations are also cited below for measurement systems to measure unconstrained performance of mobile manipulators.
1. Touch probes: contact measurement of positioning systems (e.g., computer numerical controlled machine backlash error measurement) [45].
[limitations may occur from touch probe measurement distance and digital vs. variable response]
2. Wireless indoor position measurement systems: three typical location estimation schemes - triangulation, scene analysis, and proximity performance comparisons include: accuracy, precision, complexity, scalability, robustness [46].
3. Tools for mechanical design and performance evaluation of robots: Dynamics-based local performance evaluation of manipulator global, open- or closed-chain, and alternative dexterity, link and joint deflections, acceleration radius, elasto-static performance (i.e., robot response to applied loads), and elasto-dynamic performance (i.e., link and moments of inertia) [47]. 4. Perception sensing systems: six DoF position and motion capture measurement systems,
typically used to track people or other objects, are currently being used for assessing static [48] and dynamic [49] robot performance.
5. Motion tracking camera systems:
a) using passive fiducial targets [50] affixed to the subjects being tracked with sub-millimeter accuracy;
b) using active fiducial targets [51] affixed to the subjects being tracked;
c) two camera opto-electronics measuring system tracks the 3D location of infrared light emitting diodes (LEDs) attached to a robot with resolution of approximately 0.01 % and absolute accuracy of 0.05 % [39].
6. Active camera mounted on a pan/tilt platform: image mapping is used to align images of different viewpoints so that static camera motion detection could be applied. The system extracts moving edges from dynamic images [52].
7. Acoustic and inertial motion tracking systems: obtain two types of measurements, acoustic and inertial, associated with the motion of a body and used extensively for measuring performance of robot systems [53][54].
measurement system, used extensively to measure robot performance. System use examples are:
[limitations may occur from complex or high-speed motions breaking the line-of-sight beam] a) Real-time 3D static and dynamic positioning accuracy of a robot end-effector at 12.5 μm
–50 μm and wrist orientations to within 2 s of arc [41];
b) LTS used with a vision system for six DoF, dynamic, real-time robot measurement for high-accuracy straightness measurement, precision leveling, and absolute distance metrology [55][56];
c) LTS with an automatic routine to reinsert calibrated parameters into robot/machine calibration tables to improve system accuracy to approximately 10 µm or higher [57]. 9. Multiple sensors:
a) Two lasers: static and dynamic 3D performance measurement using two laser beams to track an optical target attached to the robot end-effector, where target position coordinates are estimated using triangulation [58].
b) LTS, a laser interferometer system, and a telescopic metrology bar: an LTS and the laser interferometer system are used to measure linear errors along a linear path of motion and angular errors about axes orthogonal to the path of motion, and a telescopic metrology bar is a low‐cost, high‐precision tool for assessing the static and dynamic positioning performance of industrial robots [59].
[limitations may occur from complex or high-speed motions breaking the line-of-sight beam] 10. Laser diode with a position-sensitive detector: a non-linear, coupled, and measurement-based dynamic system model, a Lyapunov-type controller based on the deflection feedback to measure the tip oscillations and regulate the endpoint of the flexible robot [60].
[limitations may occur for dexterity measurement since manipulator endpoint (i.e., three DoF, not six DoF) is measurement]
11. Indoor global positioning system (iGPS): multiple rotating, angled, laser scanners detect the triangulated position of transmitters with measurement accuracy of approximately 200 μm [61][62].
Table 1. Metrics and the corresponding numbered measurement systems to measure mobile manipulator performance where the systems used to measure mobile manipulator performance may be constrained by the measurement system. Boxes marked with an “x” indicate utility in performance measurements, while
boxes highlighted in yellow or red indicate limited or no utility, respectively toward measuring the specified metrics.
Table 2. Metrics and the corresponding numbered measurement systems to measure mobile manipulator performance where the systems used to measure mobile manipulator performance are not constrained by
the measurement system.
If it is considered that measurement systems not marked in red (i.e., 2 through 7, 9a, and 11) are appropriate tools for measuring the metrics listed in Table 2, then a closer look is required to narrow which measurement system is ideal for performance measurement of mobile manipulators. In near future smart manufacturing, a more flexible, automated environment is expected where mobile manipulators will be ideal tools. This advanced scenario is already being considered as a priority research area to minimize risk to manufacturers and users [63]. Specifically, a chosen task for measurement, therefore, is the advanced application of mobile manipulators used for assembly (see thesis case description in section 1.2) – a task that currently utilizes only workers, fixtured parts in relatively expensive jigs, and fixed robots typically in relatively expensive workcells. Given the system-under-test (mobile manipulator), the assembly task, will therefore be considered to choose the appropriate ground truth performance measurement system. Each of the measurement systems in the tables above are considered for performance measurement of mobile manipulators used in assembly applications towards an ideal measurement system:
➢ # 2 (Wireless indoor position measurement systems): As described in [46], “the high accuracy measurements in wireless networks may be limited by shadowing, by multipath reflections arriving from misleading directions, or by the directivity of the measuring aperture” and this system is not listed in the sub-millimeter range requirements for assembly (e.g., 0.5 m – 50 m accuracy in most indoor environments). As mobile manipulators would create shadows and cause multipath situations, and continuous sub-millimeter measurement is required, this measurement system is not valid for performance measurement ground truth of mobile manipulators for the thesis case.
➢ # 3 (Tools for mechanical design and performance evaluation of robots): In this case, they limited their scope to stationary, serial-linked robots, not on mobile systems with metrics of acceleration radius, static performance (i.e., robot response to applied loads), and elasto-dynamic performance (i.e., link and moments of inertia). Hence, this measurement system is not valid for performance measurement ground truth of mobile manipulators for the thesis case. # 4 (Perception sensing systems - standards) and 5 (Motion tracking camera systems -
research): This system is ideal for performance measurement of mobile manipulators since
markers are small, the system has a high update rate (currently up to 240 Hz), accuracy is proven with a new artifact presented in this thesis (section 4.1.2) and camera viewing can be setup for any configuration of mobile manipulator application. The differences in 4 and 5a versus 5b and 5c are that active individual targets [51] provide complications due to battery size and battery positioning and active frame targets [39] are cumbersome for measuring small system components (e.g., EOAT with respect to an assembly target). Therefore, measurement systems described in #4 and #5a are considered the most appropriate measurement system for this thesis.
➢ # 6 (Active camera mounted on a pan/tilt platform) This approach only measures from one vantage point requiring new system setup at each reconfigured system pose. Additionally, off-angles can contribute to accuracy measurement where early research in [52] provided an initial compensation for angular errors down to 3⁰ - a relatively large error when the camera is perhaps one to several meters away from the assembly area. Hence, this measurement system is not valid for performance measurement ground truth of mobile manipulators for the thesis case.
➢ #7 (Acoustic and inertial motion tracking systems) High accuracy acoustic measurement can be disrupted in manufacturing environments due to ambient noise. “Typical drawbacks are latency, update rate, and sensitivity to ultrasonic noises in the environment.” [53] Also, drift from inertial systems (e.g., gyros) also cause absolute measurement uncertainty. Hence, this measurement system is not valid for performance measurement ground truth of mobile manipulators for the thesis case.
➢ # 9a (Multiple sensors: Two lasers): Although potentially high accuracy, beams are broken as the system moves from one pose to another and loses tracking capability. Additionally, each laser measures range and azimuth of a single point where both position and orientation
measurements are required to fully characterize the SUT. Hence, this measurement system is not valid for performance measurement ground truth of mobile manipulators for the thesis case. ➢ # 11 (Indoor global positioning system - iGPS) Although potentially high accuracy, receivers are very large to place onto the EOAT and assembly. Hence, this measurement system is not valid for performance measurement ground truth of mobile manipulators for the thesis case. Motion tracking systems (i.e., # 4 and #5) that use perception (i.e., cameras and markers) are therefore defined as the ideal performance measurement ground truth tool for mobile manipulators.
1.3.
Challenges of Measuring Performance of Mobile
Manipulators
The case study for this thesis is in repeatedly measuring mobile manipulators to perform assembly tasks from a fixtureless base using a rapid, non-contact measurement test method. Associated with this case study, however, is the fact that mobile manipulators must, for example, navigate (path plan, be controlled, remain stable, etc.) and dock with an assembly station. Hence, to be thorough, this thesis covers metrics and measurement systems that are useful for all aspects of the case study, including the mobile manipulator components, mobile base, and manipulator.
The shortcomings of existing research are that there have been relatively minimal performance measures considered for robots and mobile robots with regards to industrial applications where few measures have been published for mobile manipulators. As stated in section 1.2, measures are deeply influenced by the task, the environment, and their specific representation. In 2007, Zadarnowska and Tchon [64] noted that there are challenges in the performance evaluation of mobile manipulators and they considered the controllability of its theoretical configuration. They stated: “It seems that this area has not been explored systematically in the literature.” For example, they reference motion generation, coordinated tasks, locomotion, and manipulation, kinematics to drive design, and trajectory planning. In section 2, example planning and control will be discussed where the literature only describes the proposed control concepts and reports results from simulation or physical systems as either having worked or not worked. In other words, there has been no generic measurement technique or test method to compare various mobile manipulator control methods performance nor to compare many of the other metrics described in section 1.2 to the case at hand. This leaves much room for development of an ideal solution for performance measurement of mobile manipulators, a main thrust of this thesis research, where the solution, as suggested by the author, must:
A. Be reconfigurable to measure a variety of mobile manipulator poses; B. Measure the performance of any mobile manipulator;
C. Be cost effective to manufacturers and users;
The solution suggests reconfigurability as a key point for representing the many assembly situations that occur in industry. Measuring the mobile manipulator performance is the key thrust of the research. And as with solution A, the cost effectiveness of a viable solution will no doubt allow increased adoption by manufacturers and users of mobile manipulators.
The challenges of measuring the performance of mobile manipulators for use in assembly and other applications are therefore:
1. To model the subcomponents-through-the entire system, system and propagation of uncertainties, and use cases applicable to any mobile manipulator;
2. To measure a ground truth system to ensure that it is capable of measuring static and dynamic performance of the mobile manipulator and its subcomponents to at least one order of magnitude better than their manufacturer specifications;
3. To use the ground truth system to measure subcomponents of a mobile manipulator, namely the mobile base and the onboard robot arm (manipulator), to determine their uncertainties; 4. To use the ground truth system to measure a mobile manipulator as a combined system (i.e.,
mobile base with onboard manipulator) to determine their uncertainties;
5. To develop an ideal solution for measuring the performance of mobile manipulators and to develop a performance measurement test method for manufacturers and users;
6. To simultaneously measure, using a ground truth system, the mobile manipulator performance and the relative pose of the ideal solution that can cost-effectively replace the ground truth system.
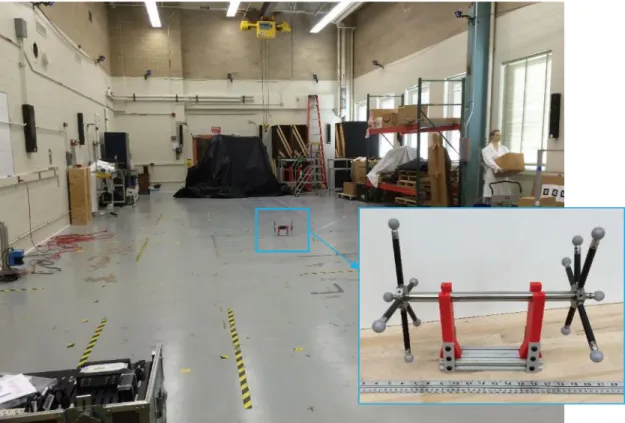
Based on these challenges, the models and systems shown in Figure 1 were developed and used where Figure 1 (a) shows a Systems Modeling Language (SysML) package diagram of the systems that are detailed in this thesis. Figure 1 (b) shows a photo of the systems and Figure 1 (c) shows a SysML model block diagram of the mobile manipulator which breaks out the components of each system and the interconnections. These diagrams and the concepts within these diagrams and photo will be discussed further and referred to within this thesis.
b optical tracking system cameras (4 of 13) GPS antenna manipulator RMMA (showing circle pattern) AGV
c
Figure 1. (a) SysML package diagram showing the mobile manipulator and measurement system structure. (b) Mobile manipulator and measurement systems used for this thesis. (c) SysML block
diagram of mobile manipulator components and interconnections.
1.4.
Structure of the Document
In addition to this introductory chapter, this thesis manuscript is organized into six other chapters and a conclusion. As briefly discussed in section 1.3, system modeling is a part of an ideal solution for measuring performance of mobile manipulators since there can be many types of mobile manipulators. Systems Modeling Language (SysML) was used to develop generic models describing the mobile manipulator software and hardware, system uncertainties, use case, as well