HAL Id: halshs-00371984
https://halshs.archives-ouvertes.fr/halshs-00371984
Submitted on 31 Mar 2009
HAL is a multi-disciplinary open access archive for the deposit and dissemination of sci-entific research documents, whether they are pub-lished or not. The documents may come from teaching and research institutions in France or
L’archive ouverte pluridisciplinaire HAL, est destinée au dépôt et à la diffusion de documents scientifiques de niveau recherche, publiés ou non, émanant des établissements d’enseignement et de recherche français ou étrangers, des laboratoires
Cooperation and Competition in Intergenerational
Experiments in the Field and in the Laboratory
Gary Charness, Marie Claire Villeval
To cite this version:
Gary Charness, Marie Claire Villeval. Cooperation and Competition in Intergenerational Experiments in the Field and in the Laboratory. The American Economic Review, 2009, 99 (3), pp. 956-978. �halshs-00371984�
Cooperation and Competition in Intergenerational Experiments in
the Field and the Laboratory
Gary Charness and Marie Claire Villeval
June 22, 2008
Abstract: There is economic pressure towards the postponement of the retirement age, but employers are still reluctant to employ older workers. We investigate the comparative behavior of juniors and seniors in experiments conducted both onsite with the employees of two large firms and in a conventional laboratory environment with students and retirees. We show that seniors are no more risk averse than juniors and are typically more cooperative; both juniors and working seniors respond strongly to competition. The implication is that it may be beneficial to define additional incentives near the end of the career to motivate and retain older workers. Keywords: Age, performance, diversity, stereotypes, cooperation, competition, inter-generational games, experiments.
JEL Classifications: A13, B49, C91, C93, J14, J18, J38, J70
Contact: Gary Charness, Department of Economics, University of California, Santa Barbara, 2127 North Hall, Santa Barbara, CA 93106-9210. E-mail: [email protected]. Web page: http://www.econ.ucsb.edu/~charness. Marie Claire Villeval, GATE, CNRS, University of Lyon, 93, Chemin de Mouilles, 69130, Ecully, France, and IZA, Germany. E-mail: [email protected]. Web page: http://www.gate.cnrs.fr/perso/villeval/.
The authors are greatly indebted to GAMBRO and to RENAULT TRUCKS for their collaboration in this research. The authors are grateful to M. Le Boulaire, A.L. Ruis Belles, P. Guittet, P. Arnaud, L. Dugros, L. Vidon, M.F. Roger-Dalbert and G. Géry, for their help. We thank Kathryn Shaw and participants at the 1st EWEBE workshop in
Valencia and at a seminar at the Aarhus School of Business for their comments. We thank R. Zeiliger for programming the experiment and M. Bouamoud, S. Teyssier and I. Vialle for research assistance. This research was supported by grants from MiRe-DREES at the French Ministry of Social Affairs and from the ACI-INTERSHS
1. INTRODUCTION
The population of most developed societies is ‘graying’. In many societies workers are still retiring at an early age and the replacement generation of young workers is small.1 The
growing constraints on the funding of pension systems are such that this creates pressure towards the postponement of the age of retirement. However, many employers are reluctant to employ older employees, notably because these are believed to be less productive while better paid than juniors. As mentioned in Stephanie Kovalchik, Colin Camerer, David Grether, Charles Plott, and John M. Allman (2005), there is indeed a common belief that ability and performance declines with aging (also see Ellen M. Peters, Melissa L. Finucane, Donald G. MacGregor, and Paul Slovic, 2000). The tension between this belief and seniority-based wage policies plays against the employment of seniors, leading to discrimination against the hiring or the employment of seniors (Marc Bendick, Lauren E. Brown, and Kennington Wall, 1999; Peter A. Riach and Judity Rich, 2006).2
The importance of negative stereotypes about seniors (Todd. D. Nelson, 2002) was highlighted in a recent OECD report (OECD, 2006). Survey results show that even in Sweden, where the participation rate of seniors is highest, half of all employers believe that seniors are less flexible and willing to change. A survey in the United States reveals that employers believe that seniors are more reliable and determined than juniors, but less willing to learn. Another survey indicates that the lower adaptability to technical change is the most common reason
1 The labor-force participation rate for employees between the ages of 50 and 64 was only 53% in France and
Germany in 2003, 67% in the U.S.A., 68% in Japan and 74% in Sweden (OECD, 2006).
2In a survey conducted in the United States in 2002, two-thirds of employees between 45 and 75 years of age report having witnessed or personally suffered from age discrimination in their company (OECD, 2006). This seems to be particularly true for females: in a labor-market experiment, Joanna Lahey (2005) finds that a younger female worker is more than 40% more likely to be offered an interview than an older female worker.
French employers state for not employing people over the age of fifty (Olivier Monso and Magda Tomasini, 2003).
To date, economists have focused more on the macro-economic dimensions of aging for the future of pension systems and on its micro-economic implications on the labor market than on its behavioral implications. Yet, a behavioral analysis of the impact of aging on decision-making may help in understanding how firms (and governments) can deal with the major issues mentioned above. In this paper, we investigate three dimensions of worker behavior that seem highly relevant for the success of modern organizations. Two of these are emphasized in Casey Ichniowski, Kathryn Shaw, and Jon Gant (2003): attitudes concerning cooperation in teams and attitudes concerning competition. Both cooperation and competition are traits that are valuable in a versatile and productive worker – there are times when each will serve the firm’s purposes. A third dimension concerns the willingness to take risks; if seniors resist the risks that may be involved in innovation, for example, this could lead to a negative influence on firm performance.
In the experimental literature, one’s attitude concerning cooperation is often measured by the analysis of contributions in public-good games. On the one hand, since we typically observe a decay of cooperation over time in these games due to conditional cooperation, we might expect experience to lead seniors to be less cooperative. On the other hand, public-goods provision in the workplace typically occurs in an environment where punishment (and even reward) is feasible. Since experimental evidence suggests that the possibility of punishment tends to lead to sustained cooperation (Ernst Fehr and Simon Gächter, 2000), so that seniors may well have had
more experience that cooperation pays off, we might instead expect seniors to be more cooperative.3
For its part, one’s attitude concerning competition may be approached experimentally by the analysis of participants’ choices with competitive and non-competitive payment schemes. If age reduces one’s willingness to compete, we should observe that older people systematically select less competitive incentives than juniors. Alternatively, we can hypothesize that older people have better judgment and self-knowledge and are more conditional than juniors in their selection of incentives and their attitude towards competition.
Another issue is the relationship between age heterogeneity and team performance, since prolonging the duration of workers’ careers is likely to increase the heterogeneity of the workforce. Barton H. Hamilton, Jack A. Nickerson, and Hideo Owan (2003) find that teams with more heterogeneous ability levels are more productive, whereas demographic heterogeneity, in terms of ethnicity, gender, and age, has a negative impact on productivity. However, there are other studies in the literature showing that firms who have either a very homogenous or a very heterogeneous age structure perform less well than those who have a moderate degree of age dispersion (Christian Grund and Niels Westergård-Nielsen, 2005). Thus, a secondary focus of our paper is to investigate whether the levels of cooperation and competition, which condition performance, are influenced by the age composition of teams. Greater age diversity may improve performance in joint production if cooperation is lower when teams are age-homogenous. This requires us to test whether people cooperate more when teamed with the same age group or in mixed groups. Similarly, greater age diversity in teams may improve
3 Indeed, William T. Harbaugh, Kate S. Krause, and Steven J. Liday (2003) find that children are more selfish than
performance if both the attraction and the strength of competitive incentives are increased by this diversity.
To address these issues, we consider experimentally the comparative behavior of juniors (under 30) and seniors (over 50) in novel subject pools. First, we conduct experiments with employees at two large French firms at their work sites. Second, we conduct a conventional laboratory experiment, where we invite students and retirees. The laboratory experiment allows us to extend the age dispersion in the observations and to make comparisons between the working and non-working populations, as only students have no work experience. Our experiments consist of a public-goods (or team-production) game in which we vary whether participants are informed about the generation composition of their three-person groups, and a real-effort task in which individuals can choose a piece-rate pay scheme or can elect to compete against a counterpart for a higher pay rate if successful (but a lower pay rate if unsuccessful). We also ask people for their preferences with respect to generation composition at the end of the public-goods (team-production) experiment. Finally, we use a simple decision-making task to elicit each individual’s degree of financial risk aversion. While we recognize that these games and tasks are imperfect proxies for important choices in real-world firms, we nevertheless feel that they offer some useful insights to appreciate the value of employing seniors that cannot be approached by standard survey methods.
To clarify our contribution, this paper is one of the first attempts to tackle the important issue of the interactions between workers of different age groups with both laboratory and artefactual field experiments. Our study is part of a recent trend in experimental economics to move beyond the student population to explore the robustness of findings. We explore the issue of the attitudes towards cooperation and competition across a work environment and a laboratory
environment, and we bring both students and retirees together in a laboratory. In addition, we provide new results on the impact of generation on the level of cooperation and on the degree of competitiveness. We also examine how people react towards information about the generation of team members and by showing how the willingness to cooperate and to compete is affected by the generation of the group members.
Our results show first that seniors are more cooperative than juniors, in the sense of making more contributions to team production. Second, we see no evidence at all that seniors are more risk averse in financial decisions. Third, seniors react to incentives and the competitiveness of the environment about as strongly as juniors. These three results are found in both the field and laboratory environments. Finally, we observe beneficial effects in the field from having working groups in which there is a mix of juniors and seniors, since working seniors increase their contribution when they know they are interacting with juniors; this suggests that there are indeed benefits in maintaining a work force with diversity in age. In addition, workers at the two firms in our study reveal a preference for being in age-heterogeneous groups. Overall, the implication is that it may not be wise to exclude seniors from the labor force; instead defining additional short-term incentives near the end of a worker’s career to retain and to motivate older workers may provide great benefits to society.
The remainder of this paper is organized as follows. In section 2, we discuss the related literature, and in section 3, we describe our experimental methodology. In section 4, we present our results, and in section 5 we discuss the implications of these results. Section 6 concludes.
2. RELATED LITERATURE
Only a few papers in behavioral economics investigate the dimensions of a declining decision-making ability of older individuals. The study by Kovalchik et al. (2005) compares the behavior of healthy elderly individuals (average age 82) and younger students (average age 20) with respect to decision-making under uncertainty. Older individuals do not appear to do substantially worse on these decision-making tasks. Both cohorts displayed overconfidence, but this was lower for older individuals at intermediate levels of reported confidence; there were no significant differences across age cohorts in the gambling tasks; both cohorts behave similarly in the guessing game.
Some other recent experimental studies have investigated the relationship between trust and age, but none investigated the link between age and cooperation or competition. Håkan Holm and Paul Nystedt (2004) analyze behavior in the Joyce Berg, John Dickhaut, and Kevin McCabe (1995) investment game, with people selected from a public database in Sweden; one cohort consisted of people 20 years old, while the other cohort consisted of people 70 years old. It was found that the young cohort sent significantly more as first movers than did the older cohort. While the average amount returned was similar for both cohorts, the proportions dispersed for the older responders, suggesting a greater degree of responsiveness to the environment; this result goes against the stereotype that older people are less adaptable. Other studies conducted with representative surveys in Germany (Ernst Fehr, Urs Fischbacher, Bernard von Rosenbladt, Jürgen Schupp, and Gert G. Wagner, 2002) and the Netherlands (Charles Bellemare and Sabine Kröger, 2007) conclude, however, that older cohorts are less trusting, yet are more generous as responders. Matthias Sutter and Martin Kocher (2007) find that the elderly
their late sixties. In their study, trust increases from early childhood to early adulthood, but stays constant thereafter.
Among the previous studies, only Holm and Nystedt (2004) manipulate the information about the partners’ generation and find that first movers were more trustful with members of their own age cohort. This raises the question of the impact of team composition on behavior. Some theoretical and empirical work in personnel economics supports the view that a heterogeneous work force is likely to lead to higher productivity if there are useful complementarities (see Edward Lazear, 1998 for a theory explaining the development of multi-cultural teams despite increased costs of communication). Hamilton, Nickerson and Owan (2003, 2004) provide empirical studies in the garment industry that distinguish between diversity in abilities and demographic diversity in teams. The first type of diversity may enhance productivity if there is mutual learning and cooperation, supporting Lazear (1998)’s theory, whereas demographic diversity is likely to harm productivity. Holding the ability distribution constant, they observe that teams with more heterogeneity in age are less productive, for three possible reasons: an inhibition of knowledge transfer, a reduction of peer pressure due to weaker social ties, and a taste for discrimination.
However, there is no consensus on the impact of age diversity in teams on performance. For example, Grund and Westergård-Nielsen (2005) use a comprehensive linked employer-employee dataset covering all firms and employer-employees in Denmark to estimate the relationship between the corporate age structure and the value-added per employee. They obtain an inverse U-shaped relationship between mean age of employees (or age dispersion) and firm
performance, suggesting that firms who have either a very homogenous or a very heterogeneous age structure perform less well than those who have a moderate degree of age dispersion.4
3. EXPERIMENTAL DESIGN AND IMPLEMENTATION
Our experiment was comprised of three different decision-making tasks, performed in sequence. As mentioned above, we conducted the sessions in both the field and the laboratory.
3.1 The decision tasks
Each session consisted of a team-production task designed to measure cooperation, a real-effort task where competition was an integral aspect of the payoff structure, and a simple investment decision designed to elicit the individual’s degree of risk aversion.
The team-production task
The first task was a standard linear public-good game, featuring groups of three participants.5 There were 17 periods in this game, divided into three respective segments of
eight periods, eight periods, and one period; we varied the sequence in the two eight-period segments to mitigate possible order effects. In one case, participants played a standard public-good game the first eight periods, in which no information is given about the generation of the other players. This was followed by eight periods in which information is provided about the
4 In the vein of Hamilton, Nickerson and Owan (2004), some studies identify a negative correlation between
heterogeneity in age and within-team cohesion and communication (Todd R. Zenger and Barbara Lawrence, 1989) or the growth of sales (Tony Simons, Lisa H. Pelled, and Ken A. Smith, 1999; Jonathan Leonard and David I. Levine, 2004). On the other hand, other studies (Pelled, Kathleen M. Eisenhardt, and Katherine R. Xin, 1999; Martin Kilduff, Reinhard Angelmar and Ajay Mehra, 2000) conclude this heterogeneity has a positive impact on overall team performance.
generation composition of the group. In the second case, we began with eight periods in which information was provided, and followed this with eight periods without this information.
In both cases, a two-stage game (the ‘selection treatment’) was played in the 17th period. In the first stage of this game, each person could select the composition of his or her group; i.e., he or she chose to be matched with two juniors, two seniors, or one junior and one senior.6 The
choice cannot depend on information about the others’ behavior in previous stages of the game, but could only be conditional on an exogenous attribute, i.e. the generation. The second stage of the game consisted of the contribution decision, as in the earlier periods.
At the beginning of each period, each group member i is endowed with 20 units. Each member simultaneously chose a fraction gi of his or her endowment to contribute to a group
project, while keeping the remainder in his or her private account. All funds in the group project paid a positive return to each member whatever his or her contribution. The marginal per capita return from a contribution to the group project was 0.5; this parameter value meant that full free-riding was the dominant strategy (assuming selfish preferences), whereas full contribution to the public good corresponded to the social optimum. Subject i’s payoff was given by:
πi=20−gi+0.5 gj j=1 3
∑
. (1) After they have made their contribution decisions, the group members were informed of both the amount of the group contribution and their own individual payoffs.
6 Each person in the selection treatment was always matched with his or her generation composition (the terms
“junior” and “senior” refer only to age). We implemented this as follows: Suppose that person X chose to be matched with two seniors. We randomly drew two seniors in the session and added their contributions to those of person X to determine X’s payoff. Now, suppose that one of these two seniors, person Y, has expressed a preference to be matched with two juniors. We randomly drew two juniors from the population and added their contributions to those made by person Y to determine Y’s payoff. In other words, a participant’s contribution may well be added to the contributions of people belonging to different groups. This artifact guaranteed that each person’s matching preference was always respected, and it did not cause any subsequent problems, since this procedure was only used in the last period of this one-shot game.
The no-information treatment allows us to determine whether juniors and seniors are equally cooperative or selfish in a group. The information treatment informs us about whether people condition the contribution to the group project on the generation composition of the group, and also indicates whether this effect (if any) differs across generations. The selection treatment tells us about the participants’ preferences between homogenous and heterogeneous groups in this game.
The real-effort competition task
Our second task consisted of two stages. In the first stage, people were randomly matched in pairs, and each person received information about the generation (junior or senior) of the other person. Each person then simultaneously chose his or her payment scheme, having been informed about the task that must be performed in the second stage of the game; this task consisted of solving anagrams, as detailed below. The choice was between a payment scheme based on absolute performance and a tournament payment scheme. Before performing the task, each person was informed about his or her co-participant’s choice of payment scheme.
If an individual chose the pay scheme based on absolute performance, he or she was paid 18 points for every anagram subsequently solved. If both people in the pair chose the tournament, the person who created most anagrams received 30 points for every anagram solved, while the other person received six points for every anagram solved. In case of a tie, the winner was randomly selected. If only one person chose the tournament, he or she received 30 points for every anagram solved. Note that in our tournament, there is no fixed payment from winning
per se; instead, one’s payoff was increasing in the number of anagrams created, so that there was always an incentive to exert full effort, even if one’s co-participant has decided to not compete.
After a participant chose a payment scheme and received information about the co-participant’s choice, he or she had four minutes in which to perform the task. Anagrams were to be solved from a series of seven letters.7 When the allotted time had elapsed, each person was
only informed about the number of valid words he or she had created and the corresponding payoff.
Because one’s choice of payment scheme is likely to depend on one’s beliefs about both one’s own ability and the ability of the co-participant, we elicited the participants’ beliefs. After choosing a payment scheme but before performing the task, people reported the number of words they estimate they could generate in four minutes. This provides us with a measure of the individual’s self-confidence. Each person also estimated the average performance of juniors and seniors in the session. Every accurate answer paid one additional Euro. By comparing these values, we can observe whether an individual believes he or she is more, less, or equally able than the generation of the co-participant; this provides us with a proxy for the individual’s relative ability. We can also measure whether a person believes that seniors are on average less able at this task than juniors. This game indicates whether the attitude towards competition is affected by the individual’s generation, and it also provides us with measures of self-confidence and stereotypes in relation to an individual’s generation.
A test of risk aversion
At the end of the session, we used a parsimonious procedure to elicit an individual’s degree of risk aversion, taken from Gary Charness and Uri Gneezy (2003); this allows us to control for this attribute in the analysis of the determinants of cooperative and competitive attitudes. Each person was endowed with 100 points and was presented with a one-shot decision task: choose
7 We alternated between two series of three vowels and four consonants across sessions to counter the effect of a
how much of this endowment to invest in a risky asset and how much to keep. It is common information that there is an even chance for the investment in the risky asset to be a success or a failure. In case it fails, the amount invested is lost; in case of a success, the investment returns 2.5 times its amount. In addition to the amount of the risky investment, each person chooses one of two colors. If this color is randomly drawn (50% chance), the investment is a success. Since the lottery gives an expected return of 1.25 point for each point invested, a risk-neutral person should invest the full endowment in the risky asset. The lower the amount invested in the risky asset, the higher the degree of risk aversion. This test allows us to measure the sensitivity of risk aversion to age.
The theoretical predictions are of course the same for both juniors and seniors: in the team production task, no one should rationally contribute to the public good, and being informed about the age composition of the team does not change the sub-game Nash equilibrium. In the real-effort competition task, one should choose the tournament if one believes one’s relative ability is higher than that of the potential competitor or if one expects that the pair member will stay out of the competition; age only matters if one has expectations about age differences in competitiveness or in ability. In the test of risk aversion, each risk-neutral subject, whatever his or her age, should invest all of the endowment.
Artefactual field experiments and lab experiments
Our artefactual field experiments (Glenn W. Harrison and John A. List, 2004) were conducted with 87 employees of two large private companies in the manufacturing industry in
the neighborhoods of Lyon, France.8 We selected initially ten companies with more than 500
employees; we had interviews in six companies and finally, two were willing to participate in the study. Despite our best efforts, we of course cannot pretend to have a fully representative sample of the working population; this is an inherent problem with field experiments where the experimenter does not have access to the entire population. Nevertheless, while it is not possible to completely rule out that some of our results are artifacts of the specific groups used in the study, our data represent a unique set of information regarding the attitudes toward cooperation and competition among juniors and seniors.
Forty-eight juniors (less than 30 years old) and thirty-nine seniors (above 50 years of age) participated in a total of seven sessions. We used the same recruitment procedures and session logistics in both firms and we minimized the likelihood that people who interacted at work would participate in the same session. We wrote the text of the recruiting message that clearly mentioned participation in a scientific experiment managed and funded by researchers. The human-resource department in each company recruited subjects by means of email and phone calls, with special attention to the balance of occupations (manager or non-manager) in each age category but without any other selection criteria. Participants were allocated to sessions so as to maintain a balance in terms of both generations and occupations.9 We asked the HR department
to compose the sessions so that supervisors were not participating in the same session as their workers, and to avoid having people from the same work group allocated to the same session;
8 Gambro is a Swedish company and one of the leading makers of products used for dialysis for chronic kidney
disease. The Lyon facility produces plastic products for hemodialysers and employs about 600 employees. Renault Trucks whose headquarters are located in Lyon is the second company in importance within the Volvo group, which is the leader in truck building in Europe. Although being owned by a European group since 2001, Renault Trucks comes from an old French company settled in Lyon since 1894. This firm is relatively archetypical of French large industrial company. Its Lyon plant employs about 5,000 employees. Both firms are in the manufacturing industry and practice shift-work; nearly all employees in both companies use computers. To control for possible differences in terms of corporate culture, we systematically introduce an indicator variable for one of the two companies in all our regressions; it is rarely significant.
this was feasible since both companies are large. In this way, we attempted to minimize any effects on behavior from anticipated possible repercussions. The HR people were also aware that they were not allowed to reveal the purpose of the experiment to the potential participants, or to provide details about the content of the protocol.10 The rules and recommendations were
the same in both companies. At the beginning of each session, the participants were reminded that no individual data would be communicated to their company and that participation was voluntary. We equipped the rooms in the companies so that the usual laboratory conditions were met; each place was separated from the next by mobile fences (see Appendix A in the supplemental materials on the AER website). The experiment was computerized using the REGATE program (Romain Zeiliger, 2000).
The experiment was also conducted with 37 students and 35 retirees, in five sessions at the Groupe d’Analyse et de Théorie Economique (GATE), CNRS, France. The students were recruited from undergraduate courses in local Engineering and Business schools, by means of the ORSEE software (Ben Greiner, 2004). This population has almost no work experience (typically, less than 3% of the students participating in our experiments have a part-time job during their studies). The retirees were recruited by means of phone calls to local associations offering computer classes and to one municipality.11 We also tried to avoid allocating people
from the same origin to the same session.
10 While it would have been somewhat preferable for us to manage this process directly, we did not have access to
individual information. Nevertheless, we believe that our requirements were followed and that the employees participating in the same session were not more familiar with other participants than the students coming from the same School. The experimental environment in the firms and in the laboratory was comparable.
11 Of course, the retirees in our sample cannot be completely representative, since computer literacy is less common
for people in this age bracket. According to the 2005 Eurostat Community surveys on ICT usage in enterprises and households in the EU-25, 90% of the cohort aged 16-24, 45% of the cohort aged 55-64, and 22% of the cohort aged 65-74 have at least basic knowledge in computers. In addition, while the replication of the field experiment with
In total, 159 people took part in this experiment. The same experimenters ran all of the sessions. Working juniors were on average 25.3 years old (min = 18, max = 29) and working seniors were on average 54.1 years old (min = 51, max = 57). The students were on average 20.6 years old (min = 18, max = 28) and the retirees were on average 65.9 years old (min = 58, max = 77). The distribution of participants in terms of generations was balanced in the two firms (48.6% from one firm were seniors and 44.8% from the other firm). Table 1 shows the number of participants and their demographics by location.
Table 1: Session demographics
Location Sessions Subjects % Seniors % Managers % Females
Field 7 87 44.8% 31.0% 43.7%
Laboratory 5 72 48.6% - 50.0%
Upon arrival, the subjects signed a consent form in which they confirmed their voluntary participation and acknowledged being informed that they could leave the experiment at any time without any sanctions. At the beginning of the session, participants entered their age on their computer and chose between two colors.12 Next, the instructions for the first eight periods of the
public-good game were distributed and read aloud (see Appendix B in the supplemental materials on the AER website). Instructions were written in neutral terms. The participants then filled out a questionnaire to check their understanding of this game; all questions were answered privately. It was common information that the matching was random and that groups were fixed for the first eight periods. New instructions were distributed for the next eight periods. People were aware that we re-matched the groups for the new series of periods and that the new groups
12 We introduced this choice of colors (orange and green) in order to limit the salience of age. This artifact has
almost no impact. The individuals who chose the orange color invested more in the test of risk attitude (5% level of significance) but the other decisions are not affected.
were fixed for these periods. Finally, instructions were distributed for the selection treatment in period 17. During this game, a table was displayed on the subjects’ screen, with one row for each group member indicating when applicable the color chosen by the participant and his or her generation (junior or senior). In addition, a feedback table was available to remind one of his or her own contribution, the amount of the public good, and his or her payoff in each past period.
At the end of the previous game, we distributed the instructions for the competition game; we read them aloud and checked for whether people understood the game. Each person was then informed about the generation and color choice of his or her co-participant and next chose a payment scheme. We then elicited the beliefs about one’s own performance and the performance of juniors and seniors. Next, we read aloud the series of seven letters and started the clock. After four minutes had elapsed, the number of qualifying words was validated.13
After the completion of this game, we distributed the instructions for the test of risk aversion. On average, a session lasted 75 minutes. At the end of each session, each participant was individually given an envelope with a cash payment. On average, participants earned €24 in companies and €22 in the laboratory.14
4. EXPERIMENTAL RESULTS
In this section, we first analyze the results of our test of risk attitude. We then study behavior in the team-production game. Finally, we focus on the attitudes towards competition.
13 This part of the experiment was not computerized to avoid potential differences in computer ability.
14 We attempted to control for the opportunity cost of time for the working population by having the experiments in
their workplace rather than requiring them to go to the University. Nevertheless, wealth and income levels
4.1 Risk attitudes
In contrast to the idea that seniors would be more risk-averse than juniors, in fact retirees invest slightly more than students; the respective means (standard deviations) were 55.57 (26.27) and 50.32 (29.21). Working seniors also invest slightly more than working juniors; the respective means (standard deviations) were 59.23 (26.75) and 57.58 (26.15). No significant differences across generations are identified by Kolmogorov-Smirnov tests for the equality of distributions across the two generations conducted on the pooled dataset (p = 0.396), on the field data (p = 0.486), and on the lab data (p = 0.915). The estimation of a Tobit model (not reported here but available upon request) confirms that the amount invested is not influenced by the generation, controlling for age and occupation that exert no significant influence either. Since the overall wealth level may differ across juniors and seniors, we wish to be cautious in interpreting these results. Nevertheless, these observations are close to those by Steffen Andersen, Harrison, Morten I. Lau and E. Elisabet Rutström (2006), who compare the results of a field experiment on risk conducted on a representative sample of the Danish population with those from a lab experiment.
4.2 Attitudes toward cooperation in the team-production task
Figure 1 shows the contribution over time for each group in the team-production task. [Figure 1 about here]
The average contribution in the first 16 periods (exogenous matching) was 4.13 for students, 6.41 for working juniors, 7.31 for retirees, and 7.46 for working seniors.15
Contributions tend to decline over time, as is a standard result in the public-goods game, but the contribution of the seniors is higher than that of the juniors in nearly all periods. We also
observe the familiar ‘re-start’ phenomenon, where contributions go up after a new group is formed in period 9; this is particularly strong for students, perhaps in part because their level of contributions is so low by period 8. Finally, there is a jump in contributions in period 17 (when groups are formed endogenously with respect to generation) for every subpopulation, with an average increase of 2.32 (45%) from the contributions in period 16 (mean = 4.52).
We vary whether information is provided about the composition of the group. Information provision increases average contributions in every case. The average contribution increases from 6.29 when no information is provided to 6.53 when information is provided for the working juniors, from 7.30 to 7.62 for the working seniors, from 3.74 to 4.54 for the students, and from 7.02 to 7.61 for the retirees.16 When information is provided, the effect of
heterogeneity on the total group contribution is positive in the field data, yet is negative in the laboratory. In companies, mixed groups on average contribute the most, particularly when given information about the group composition, as would be natural in a workplace.
On average, working seniors contribute more when matched with juniors than when matched with other working seniors (8.26 versus 7.43, with standard deviations of 4.64 and 6.03), although they might realize that the latter contribute less on average, as if to teach them the ‘good example’ of cooperation. Working juniors also contribute more on average in heterogeneous groups than when matched with other working juniors (6.93 versus 6.35, with standard deviations of 5.30 and 5.62). In contrast, in the laboratory, heterogeneous age groups are less cooperative than homogenous groups. Indeed, when they know that they are interacting with seniors, students contribute less (4.33 versus 4.69, with standard deviations of 4.28 and
4.81) than when they know they are matched with other students; similarly, retirees contribute less in heterogeneous groups (7.01 versus 8.01, with standard deviations of 4.83 and 5.28).
There are at least two possible explanations for the difference with behavior across the experiments in the field and the laboratory. One possibility is that, perhaps due to the greater difference in age and position in society, both retirees and students cooperate more in their own demographic class; in contrast, both the working juniors and seniors may be used to being in age-mixed groups at work. Another possible explanation of the difference between the lab and the field reflects a form of reciprocal behavior. In this case, it would not be the difference in age or social position per se that matters, but rather the difference in the average contribution across the groups. Since students contribute far less than retirees, this might explain why retirees contribute less in heterogeneous groups than in homogenous ones. To test whether these explanations are complements or substitutes, an econometric analysis is required.
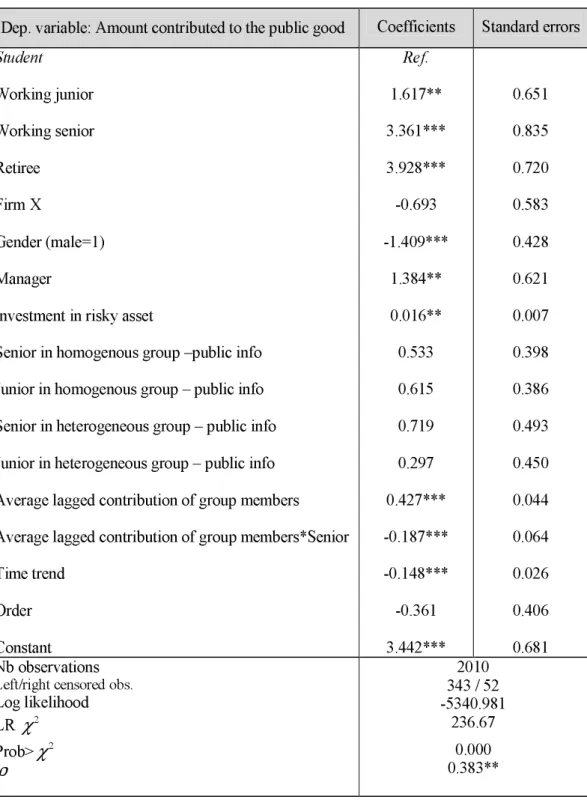
We therefore estimate a random-effects Tobit model to identify the determinants of cooperation in the team-production game. This panel data analysis accounts for the fact that we observe each participant’s decision sixteen times and controls for both the left and right censoring of the observations corresponding to the null contribution and the contribution of the full endowment, respectively. The model has been estimated on pooled data from all the sessions. The dependent variable is the amount contributed to the public good.
The exogenous variables include each age category (with the students being the omitted category),17 gender, whether one is a manager, and one’s degree of risk aversion (as reflected by
the amount invested in the risky asset). They also include an indicator variable for one of the two firms to control for possible corporate culture effects. To investigate the complementarity or
17 We systematically chose the students as the omitted category in the regressions on pooled data since they differ
substitutability of the two hypotheses mentioned above, we also include two sets of variables. First, we control for whether the participant’s contribution is influenced by the information about the generation composition of his or her group. To do so, we interact the subject’s generation and whether he or she is in either a homogenous or a heterogeneous group when this information is displayed; the reference level is therefore the situation where the subjects have no information on the composition of their group. These four variables aim at determining whether people condition their willingness to cooperate on their level of information and on the age of their teammates. Second, since conditional cooperation is likely, we include in the regressions the team members’ average contribution to the public good in the previous period. We interact this variable with the generation to check whether seniors are more, less, or equally conditional than juniors. Next, we control for a likely time trend in the level of contribution. Finally, we add a control for order in the sessions, to check if informing the participants about the composition of their team at the beginning of the game influences behavior throughout the game. Table 2 reports the results of the regression.
[Table 2 about here]
The results in Table 2 indicate that working juniors, working seniors, and retirees are significantly more cooperative than students, with the value of the coefficients ranked accordingly. We conjecture that this reflects a positive impact of the experience of work on the level of cooperation, since students (we again mention that almost none of them hold a part-time job) clearly contribute the least.18 In addition, managers are more cooperative.19 We also find
18 One may wonder whether the lower rate for students is caused by youth or inexperience. As the average age for
students and working juniors is only moderately different (20.6 versus 25.3 years of age), it seems much more likely that the behavior differs due to the experience of working.
that males contribute significantly less than females, a result that we view with some caution given that John Ledyard (1995) and Catherine Eckel and Philip Grossman (2006) report a lack of evidence for a systematic difference between men and women in public-goods experiments. The participants who invest more in the risky asset are more willing to cooperate (in separate regressions conducted on each sub-sample, this effect is not significant in the lab data, however); this makes sense since cooperating in such a game is taking the risk of being a sucker if others are free riders.20
This analysis and the descriptive statistics support our first main finding:
Result 1: Seniors, whether working or retired, contribute more than juniors; students consistently contribute the least.
There is no strong difference between firms (the coefficient associated with one of the companies being only marginally significant in a separate regression on the sub-sample of field data). Contributions decline over time and there is no significant order effect. Overall, when the age composition of the group is made public information, it does not influence behavior significantly in the pooled data. In contrast, not surprisingly, we find that the participants condition their behavior on the contribution level of their teammates in the previous period. We see that this is somewhat less true for the seniors, as they are significantly less conditional than the juniors (although the net coefficient for seniors is still .240); this result perhaps explains the smoother evolution of their contributions over time, as seen in Figure 1.21
game, there is no role differentiation, but managers may import to the lab their experience as leaders in the firms where they may also wish to contribute more to lead by example.
20 A negative relationship between risk aversion and cooperation in a repeated prisoner’s dilemma game has also
been documented in Gerardo Sabater-Grande and Nikolaos Georgantzis (2002).
21 In this sense, seniors may be seen as less adaptable; however, the flip side is that this may reflect having more
experience, as well as having more principled and deeply-held views that sustained cooperation is socially-beneficial.
However, when the same regressions are estimated on the sub-samples of working and non-working populations (not reported here, but available upon request), we find that controlling for the contribution level of their teammates in the previous period, seniors contribute more in heterogeneous groups in the field and in homogenous groups in the lab. This cannot be fully explained in terms of reciprocal behavior. In a firm environment, the working seniors value cooperating with juniors, as if trying to provide a good example to the juniors by taking the lead in contributing more. In contrast, the retirees put positive value on cooperating with other retirees. This analysis supports our second result:
Result 2: Working seniors cooperate more with working juniors, while retirees are more cooperative when they interact with retirees, conditional on their group members’ contributions in the previous period.
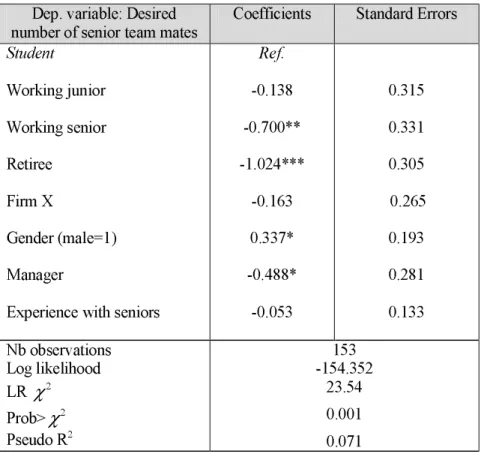
This second result leads to the question of whether the different categories of subjects have different preferences regarding matching in terms of generation. We examine the results of the selection treatment played in period 17. In Table 3, we analyze the determinants of the desired number of senior teammates, using an ordered-probit model, in which the explained variable can take values 0, 1, or 2. The explanatory variables include the generation categories, the gender, being a manager. We also include a dummy variable for one firm and a variable indicating whether the participant was aware of having been matched with seniors in previous periods of the game. This variable measures the conscious experience of seniors’ contribution behavior in this game.
[Table 3 about here] The regression in Table 3 supports our third result:
Result 3: People have a preference for heterogeneous teams, since the number of desired senior teammates is significantly negatively correlated with being a senior. However, managers show a reluctance to be matched with seniors.
There is no difference between students and working juniors in their matching preferences.22 This is not related to their experience with seniors, as this variable is not
significant. We also find that managers prefer (at a marginally-significant level) to be matched with fewer seniors, controlling for the subject’s generation and experience of the seniors’ behavior in previous periods.
To delve more deeply into the motivation of such choices, one must examine contribution behavior in the selection treatment. We have estimated the determinants of the contribution in period 17, using a Tobit model that accounts for the left and right censoring of the data (not reported here). The dependent variable is the amount contributed by the subject to the public good in period 17. In addition to the explanatory variables included in the previous regression, we include a dummy variable indicating if the subject is in an age-heterogeneous group and the number of chosen senior group members. The only (marginally) significant variables (p = 0.052 and p = 0.060, respectively, two-tailed tests) in a regression on pooled data are the dummy variables for being a senior and for being in an age-heterogeneous team, which both increase the individual contributions in the selection treatment. However, regressions conducted on the sub-samples of working and non-working populations show that the second effect is statistically significant in the field, but not at all so in the lab. These regressions support our fourth finding:
Result 4: When group formation is endogenous, age-heterogeneous teams are more cooperative than age-homogeneous teams in the field, but not significantly so in the lab.
22 This confirms the descriptive statistics since only 15.9% of the working juniors and 18.9% of the students prefer
In the field, this result is consistent with the previous ones showing that the working seniors contribute more in heterogeneous groups. However the positive impact of diversity in the field is not linearly related to the number of seniors in a group. In contrast, in the lab, the number of senior group members decreases (p = 0.060, two-tailed test) the amount contributed by the subject to the public good. In fact, students are willing to be matched with seniors and, conditional on this choice, they reduce the amount of their contribution as the number of retirees in the group increases. In other words, they act opportunistically and try to exploit the retirees.
This is confirmed by another regression on the sub-sample of students (not reported here) showing that the probability of choosing senior group members is negatively related to one’s own average contribution during the first 16 periods of the game (significant at the 1% level): the more the students free rode in the past, the more they wish to interact with retirees. In contrast, the coefficient associated with this variable is positive and marginally significant in the same regression conducted on the sub-sample of working juniors: the more the working juniors cooperated in the past, the more likely they are willing to interact with seniors. This result suggests that a different logic operates among working juniors than among students: the more cooperative working juniors are also more integrative of seniors for the sake of efficiency (choosing to be in a heterogeneous team increases contribution); the less cooperative students are also integrative of seniors but for the sake of taking advantage of them. The experience of work in a mixed environment may help to explain these different behaviors.
4.3 Attitudes toward competition and productivity in the real-effort task
The entry rate in the tournament is 0.676 for students, 0.705 for working juniors, 0.649 for working seniors, and 0.514 for retirees. Juniors enter the tournament more frequently than
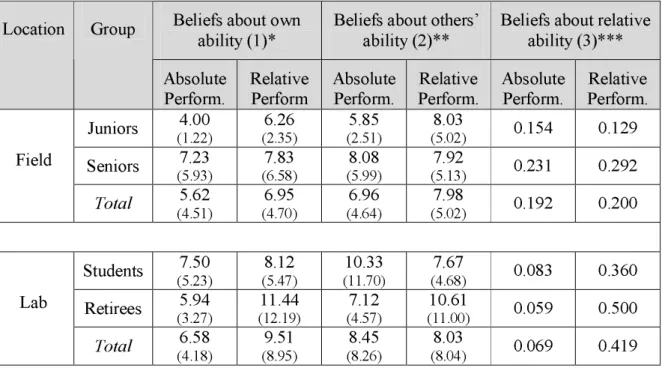
The decision to enter the competition is likely influenced by beliefs about one’s ability, especially relative ability. The first column of Table 4 shows the beliefs about own performance (self-confidence) in number of words created for the individuals who chose the pay scheme based on absolute performance and those who chose the tournament. The second column indicates the beliefs about the others’ ability, i.e. the number of words the individuals believe the generation of their co-participant is able to create. The third column gives the rate of individuals who believe they are able to create more words than the generation of their co-participant (and potential opponent in the competition), since they report a higher belief about themselves than about the generation of their co-participant.
[Table 4 about here]
We observe a consistent pattern in Table 4: for every group, those people who choose the tournament are more self-confident than those who choose the pay scheme based on absolute performance. However, the difference between the beliefs of working seniors who enter the tournament and those who do not is small. Does this mean that they are avoiding competition despite having sufficient skill to compete? The choice of the pay scheme depends on the beliefs about relative ability rather than beliefs on absolute performance: what matters indeed when involved in a tournament is to outperform the competitor, whatever one’s own performance. The working seniors choosing absolute pay feel less able on average than the generation of their competitor, and those who choose the tournament feel slightly less able than the generation of their competitor. This may have discouraged some of them from competing, but it also indicates that they do not need to feel much more able than their competitor to choose the tournament. The difference between beliefs in own and others’ ability is considerably higher for the students and retirees who chose the tournament than for those who did not. Moreover, with the exception
of the working juniors, the proportion of individuals who believe they are more able than their co-participant is considerably higher among those who chose the tournament.23
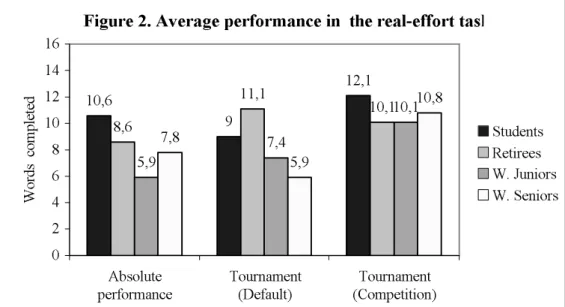
Figure 2 shows the average performance for each subpopulation, according to whether people chose the pay scheme based on absolute performance, entered the tournament and won by default (when the co-participant has chosen not to compete), or entered the tournament and actually competed against another person who entered the tournament.
[Figure 2 about here]
Every group produces more words when choosing the tournament and actually competing than when choosing absolute performance pay. Despite the fact that the strongest incentive to produce more words applies when one has won the tournament by default (the payment of 30 points per anagram is certain), all groups except retirees produce substantially more words when in an actual competition than when they win the tournament by default. According to Wilcoxon signed-rank tests, the difference is significant for working juniors (p = 0.031), working seniors (p
= 0.004) and students (p = 0.003), but it is not significant for retirees (p = 0.236); this might suggest that people derive utility from winning. Working people seem to be much more motivated by actual competition, compared to winning the tournament by default; performance is more than 50% higher for this comparison in the workplace, but less than 15% higher in the laboratory. Being no longer in a competitive framework, retirees might derive less utility from winning and this could explain why their performance is similar in both types of tournaments.
23 It should be noted that overall, working participants (and especially working juniors) report lower expected
ability. Comparing the individuals’ beliefs about own ability and the ability of own generation, we find that seniors are more under-confident than juniors. For example, while29.2% of the working juniors and 40.5% of the students believe they are better than the average of their generation (the other categories were being about the same as the
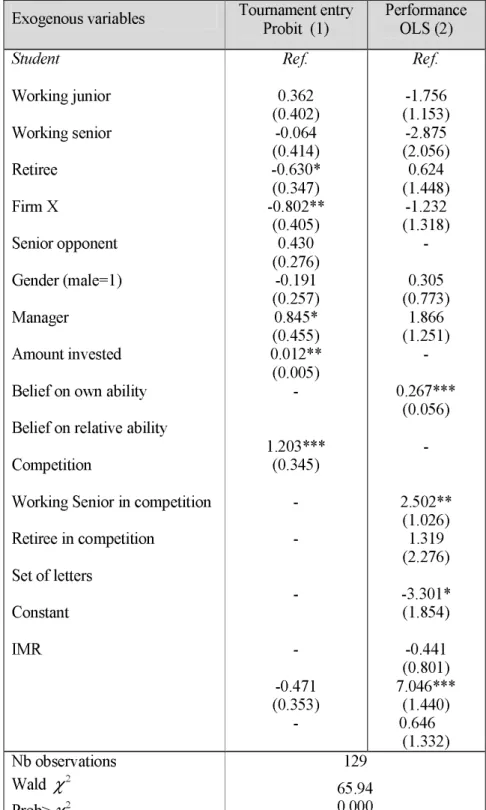
To analyze the determinants of the individual performance, we estimate on pooled data a model with a correction for the potential selection bias due to the choice of the payment scheme. To achieve this, we use the Heckman two-step estimation procedure. We first study the determinants of choosing the tournament payment scheme using a Probit model. We then explain the number of words created, conditional on that decision, with an OLS model corrected for the selection bias.
In both regressions, the variables for individual characteristics include generation, gender, whether the participant is a manager, and whether one is working for one of the two firms; the students are the omitted category. In the selection equation, we also include a variable indicating whether the participant is paired with a senior in this game, since stereotypes regarding the lower competitiveness of seniors may have a positive influence on the decision to compete. We control for the amount invested in the risky asset and we include a dummy variable regarding beliefs about relative ability, indicating whether the individual believes he or she is more able than the generation of his or her co-participant. We hypothesize that people who feel more able than the age category of their co-participants are more willing to compete. In the performance equation, we instead include a variable indicating beliefs about own absolute performance.
Several variables characterize the environment: one indicates whether the competition involves both the participant and his or her co-participant; we interact this variable with being a senior to identify whether performance is affected by the competition and, if this is the case, whether the influence is similar on seniors and on juniors. We also control for the set of letters that was used to perform the task to test whether one set was easier than the other. We omit some variables that were included in the selection equation to identify the model, in particular the beliefs about relative ability and the risk attitude variables. Finally, we include in this
performance equation the inverse of the Mill’s ratio (the “IMR” variable) to control for a potential selection bias arising from the first-stage decision. Table 5 displays the results from these regressions.
[Table 5 about here]
The first regression indicates that the retirees are marginally less likely to choose the tournament than the students; moreover, when one restricts the sample to the non-working population (not reported here, but available upon request), it turns out that the retirees are not less competitive than the students. In addition, we find that there is no significant difference between working seniors, working juniors, and students. We do not find any evidence of a gender effect, although it has been shown with a different task that females tend to shy away from competition (Muriel Niederle and Vesterlund, 2007); our results indicate that the gender gap in competitiveness is not systematic. Perhaps not surprisingly (since it is a risky decision), the probability of choosing the tournament is positively influenced by the amount invested in the risky asset. Managers are also more willing to compete, perhaps because they are more used to doing so in their occupation.
Logically, people are influenced by their belief about their relative ability. Indeed, believing one is better than an average potential competitor increases the probability one chooses the tournament. Interestingly, this decision to compete is not influenced by the generation of the opponent, except in the working population sample: controlling for the other variables, being matched with a working senior in this game increases the probability of choosing the tournament. An interpretation is that the participants believe that the working seniors are less likely to choose the competitive payment scheme (true, but not significantly so; Z = 0.54), so that it gives them an additional reason to opt for the tournament. This leads to Result 5.
Result 5: Only retirees are less willing to compete than the other age categories and only marginally so. In the non-working population, the decision to compete is mainly influenced by beliefs about relative ability whereas in the working population, controlling for these beliefs, being matched with a senior reinforces one’s competitiveness.
An additional issue is that if one has preferences for total social payoffs (e.g. Charness and Matthew Rabin, 2002), there may also be a motivation present for opting out of the tournament. The most efficient joint choice is for one person to choose the tournament and for the other person to choose the absolute performance scheme. Thus, a socially-motivated individual may choose the absolute pay scheme if he or she believes the other person is choosing the tournament. While we do not measure social preferences, results from Fehr et al. (2002), Bellemare and Kröger (2007) and Sutter and Kocher (2007) suggest that seniors may care more about total social payoffs, since they are more generous as responders in a trust game than are younger people.24 To the extent that this is the case, the difference in the entry rates for juniors
and seniors may overstate any underlying difference in competitiveness.
Finally, the second regression in Table 5 indicates that, despite differences in the education level, the level of performance is similar across subpopulations. Generally, the self-confident participants do perform better than those who are less self-confident. Confirming the descriptive statistics, the reality of the competition – and the associated risk of getting a low payment – makes most people work harder than when the co-participant has chosen the pay scheme based on absolute performance, in which case the high payment is certain. Relative to students, there is no significant difference for the effect of competition on working seniors; however, the retirees react marginally less strongly to competition. There is no significant
24 Older people are less trusting in some of these studies, but this is a strategic choice; being less trusting is not the
impact from the other variables, such as gender, occupational category, or the nature of the task. This leads to our last result.
Result 6: Working seniors do not react to competitive incentives significantly less strongly than younger people in general. Only retirees are less reactive to competition.
5. DISCUSSION
We test seniors and juniors in experimental games and tasks designed to shed some light on their relative behavior and performance, both in the workplace and in the laboratory. We are concerned with three dimensions that would seem to be quite important for the performance of firms: attitudes towards risk, cooperation, and competition. If seniors are afraid to take risks, are less cooperative, and are less competitive, they might well be less valuable in the workplace.
However, our experimental data do not support this view; instead, if one accepts our games and tasks as proxies for field concerns, seniors appear to be at least as valuable as juniors. We find no difference between juniors and seniors in terms of risk aversion. In a task involving real effort in either a pay scheme based on absolute performance or in a tournament, only retirees are less willing to enter the tournament. In addition, in the competition, working seniors react to incentives as strongly as juniors, rather than being inflexible in their behavior. Finally, our results from the team-production game suggest that working seniors are particularly valuable, both because they contribute more and because the heterogeneity they provide leads to better outcomes. Working seniors increase their contributions when aware they are teamed with juniors, and they are especially willing to interact with juniors. One interpretation is that they are interested in teaching the juniors the benefits of group cooperation.25
If one accepts these results at face value, they suggest that it is worthwhile to keep seniors in the work force. This issue is particularly acute in countries such as France and Germany, although the prevalent age discrimination in the United States makes it clear that this is a real problem there as well. Much of the problem seems to stem from the demand side, despite the introduction of taxes against the firing of seniors.26 It is not our primary goal to find
evidence of age discrimination in our experiments; nevertheless, our results indicate that, when given the possibility of choosing their group members in the cooperation game, managers are less likely than the other categories to choose seniors.27 Our behavioral analysis of the impact of
aging on cooperation and on the willingness to compete suggests directions for governments and firms to confront a potential shortage of workers in the coming years, as seniors may be willing to stay on the job given appropriate incentives, thereby providing both a supply of workers and valuable heterogeneity in a firm’s work force.
It is interesting that we see little evidence of negative attitudes towards senior workers by junior workers, as they have a taste for senior teammates in the team-production game and increase their contributions in age-heterogeneous groups.28 In contrast, while students also seek
senior teammates, it appears that they do so for the purpose of exploiting them, as they lower their contributions when paired with seniors. This suggests that they must learn to become team players to be particularly useful to potential employers.
failure to cooperate can be punished in the workplace). Seniors are not simply indifferent to the others’ behavior, since we also find that working seniors are sensitive to the past contribution of their teammates.
26 Some companies have however started to care about diversity management and seem aware of the benefits of such
a policy. For example, BMW has begun to hire older workers to avoid an unbalanced age structure of the work force in many parts of the company (see Grund and Westergård-Nielsen 2005). Nevertheless, participation rates for older workers remain low and it is still unusual for a senior worker to be replaced by another senior worker.
27 Of course, we do not have any top executives or human resource managers participating in our sessions, so the
managers in our study are not likely to be making hiring or retention decisions. Nevertheless, people who make these decisions may well seek the advice of the managers.
28 However, the fact that being matched with a working senior reinforces one’s competitiveness, controlling for
Some human resources managers claim that the seniors may lack motivation if they have to stay longer in companies. Our results show that seniors react to incentives; this may mean that if new incentive schemes are introduced late in a career, seniors’ performance could be improved because new perspectives would be offered. Indeed, keeping seniors at work and fighting against age discrimination also raise the issue of the management of incentives at the end of one’s career. To prolong or to restore the seniors’ motivation, perhaps there is a need for the development of new career ladders, opportunities, and incentive schemes. Our experiment also shows that working seniors are not substantially less attracted by competition than juniors, and they greatly increase their performance when they learn they must compete instead of winning a tournament by default. Facing such a competitive incentive, they perform as well as juniors. But the analysis of beliefs about relative ability also shows that seniors tend to underestimate their true ability relative to that of their age category. This bias may influence their behavior regarding the choice of incentive schemes.
Finally, a novel aspect of our study is the comparison between the behavior of actual workers and non-workers. While we find many results that are similar across these groups, we also find some interesting contrasts. For example, workers seem to be more attracted to competition than non-workers, although this is driven by the lower likelihood of the retirees to choose the tournament. In addition, winning by competing per se (instead of receiving the high payment by default) seems to motivate workers more than non-workers, suggesting that retirees derive less intrinsic utility from winning. Another difference is that students behave more selfishly and free ride more on the seniors’ contributions than the other categories. This suggests that the integration in the workplace contributes to people becoming more socially-oriented.
6. CONCLUSION
The employment of seniors has become a major issue in most developed countries. The difficulties in funding the pension systems and the end of the early retirement plans provided by firms are such that there is an additional potential older work force. However, these early retirement programs may have introduced several distortions playing against the demand for seniors, either because they have contributed to reducing the work motivation of those employees approaching the age of early retirement, or because they have disseminated stereotypes about their lower productivity and adaptability.
We obtain results that we regard as important for a better understanding of the behavioral dimensions of skill and productivity that should play against age discrimination at work. Seniors are more cooperative even where there is a strong incentive to free ride on the contribution of others. Another key result is that heterogeneous teams contribute more than homogenous ones in the sessions involving active workers. When they know they are teamed with juniors, working seniors cooperate more than in all-senior teams. Finally, the seniors who choose to compete in a tournament perform essentially as well as juniors.
These results are at variance with the widespread stereotypes about seniors, seen anecdotally and in several surveys in both the United States and Europe. Seniors are perceived to be less adaptable, overly cautious, and less willing to learn. These views undoubtedly contribute to age discrimination against seniors in the workplace. We show however that working seniors are as reactive and productive as juniors when competing against an opponent.
Overall these findings tend to show that seniors constitute a valuable work force and suggest that age diversity is a potential source of improved performance, provided that the willingness to cooperate is not too different for the juniors and seniors. Of course, this does not