DOCTORAT DE L'UNIVERSITÉ DE TOULOUSE
Délivré par :Institut National Polytechnique de Toulouse (INP Toulouse) Discipline ou spécialité :
Dynamique des fluides
Présentée et soutenue par :
M. CHARLIE KOUPPERle lundi 11 mai 2015
Titre :
Unité de recherche : Ecole doctorale :
UNSTEADY MULTI-COMPONENT SIMULATIONS DEDICATED TO THE
IMPACT OF THE COMBUSTION CHAMBER ON THE TURBINE OF
AERONAUTICAL GAS TURBINES
Mécanique, Energétique, Génie civil, Procédés (MEGeP) CERFACS
Directeur(s) de Thèse :
M. LAURENT GICQUEL
Rapporteurs :
M. PASCAL BRUEL, UNIVERSITE DE PAU ET DES PAYS DE L ADOUR M. TOM VERSTRAETE, VON KARMAN INSTITUTE RHODE SAINT GENESE
Membre(s) du jury :
1 M. LAURENT JOLY, ISAE TOULOUSE, Président
2 M. BRUNO FACCHINI, UNIVERSITA DEGLI STUDI DI FIRENZE, Membre
2 M. LAURENT GICQUEL, CERFACS, Membre
Cette th`ese CIFRE a pu voir le jour grˆace `a une collaboration ´etroite entre Tur-bomeca (groupe SAFRAN), le CERFACS (Centre Europ´een de Recherche et de Formation Avanc´ee en Calcul Scientifique) et l’Universit´e de Florence, et je tiens `a remercier chacun de ses membres qui y ont contribu´e.
Mes premiers remerciements vont aux membres du jury pour avoir accept´e de juger et discuter de mes travaux de th`ese lors de la soutenance `a Toulouse, ouvrant des perspectives int´eressantes pour la suite des recherches. Je remercie particuli`erement les rapporteurs Pascal Bruel et Tom Verstraete pour leur travail de relecture et les suggestions propos´ees.
Je tiens `a remercier chaleureusement Laurent Gicquel et Florent Duchaine pour leur encadrement acad´emique rigoureux, dynamique et enrichissant. Ce fˆut un r´e´el plaisir de travailler ensemble au cours de ces trois ann´ees. Merci ´egalement `a Thierry Poinsot pour son aide et ses conseils sur l’´etude NSCBC/´equilibre radial. Je remercie sinc`erement Guillaume Bonneau et Lorenzo Pons `a Tur-bomeca pour m’avoir accord´e leur pleine confiance, une grande autonomie et avoir syst´ematiquement soutenu mes efforts, notamment pour le montage du banc d’essai FACTOR avec l’Universit´e de Florence. J’adresse mes plus vifs remerciements `a Jean-Louis Champion pour sa collaboration sur les aspects exp´erimentaux.
Vorrei ringraziare particolarmente Bruno Facchini e Lorenzo Tarchi per il mio soggiorno a Firenze dove ho scoperto la fisica sperimentale con specialisti. Ho anche incontrato ragazzi molto simpatici e veramente calorosi. Grazie mille Gianlu e Valentina per tutto. Vorrei anche dire grazie a Alessio, Riccardo, Tommaso, il cinese, e schifo guy ! Non sar`a possibile dimenticare i miei tre mesi a Firenze, una citt`a straordinaria con tanti simpatici amici. Spero tornare presto...
Il va sans dire que je tiens `a saluer mes camarades de th`ese du CERFACS, et particuli`erement Thomas qui est devenu mon jovial acolyte de doctorat et ´egalement mon d´emystificateur de traitement du signal.
S’il est trivial de dire que sans eux rien n’aurait ´et´e possible, il n’en est pas moins important pour moi de remercier mes parents, mon fr`ere Tom, mon pedescaou Julie, qui ont su m’´epauler et m’accompagner particuli`erement `a la fin de ma th`ese.
Mes pens´ees vont ´egalement `a mes grands-parents avec qui j’aurais ´et´e fier de partager l’aboutissement de ces ann´ees d’´etudes.
Charlie Koupper Buros, le 23 mai 2015
This PhD work was performed within the framework of the FACTOR project (www.factor-fp7.eu) that has received funding from the European Union Seventh Framework Programme (FP7/ 2007-2013) under grant agreement number 265985.
This work was granted access to the HPC resources of IDRIS (www.idris.fr) under the allocation 2013-x20132b5031 made by GENCI (Grand Equipement National de Calcul Intensif).
Nomenclature ix
General introduction 1
Part I An introduction to combustor turbine interactions 9
Chapter 1 Literature review 11
1.1 The combustor and turbine modules . . . 12
1.1.1 Technological layout and flow characteristics . . . 12
1.1.2 Characterisation of the temperature field distortions . . . 15
1.2 Influence of the combustor on the turbine . . . 18
1.2.1 Research facilities dedicated to hot streak transport . . . 18
1.2.2 Main results of the past studies . . . 25
1.3 Influence of the vanes on the combustor . . . 34
1.3.1 Potential effect . . . 34
1.3.2 Acoustics . . . 37
1.4 Concluding remarks . . . 39
Part II Development of an engine representative combustor sim-ulator dedicated to hot streak generation 43 Chapter 2 Design of the combustor simulator and preliminary assessment by LES 45 2.1 Design process of the combustor simulator for FACTOR . . . 46
2.1.1 Requirements and target . . . 47
2.1.2 Final design and operating conditions . . . 48
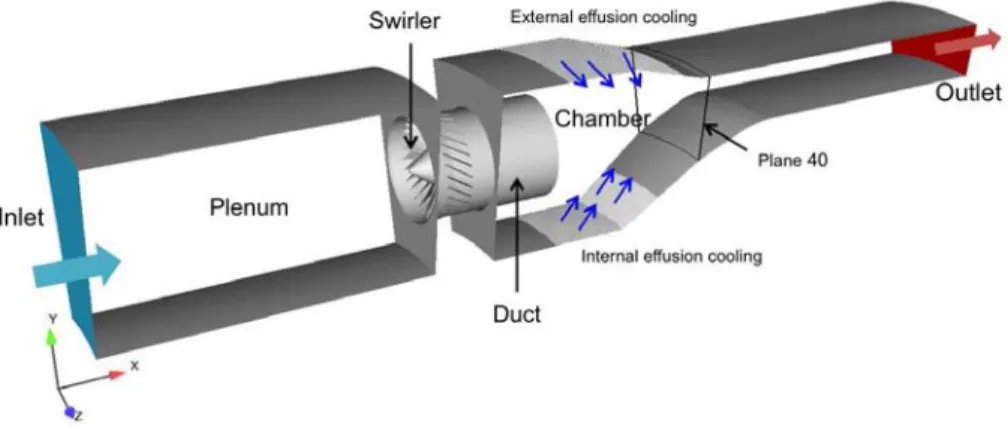
2.2 Numerical insight on the flow topologies with and without confinement 50 2.2.1 Set up of the LES . . . 50
2.2.2 Flow inside the chamber . . . 52
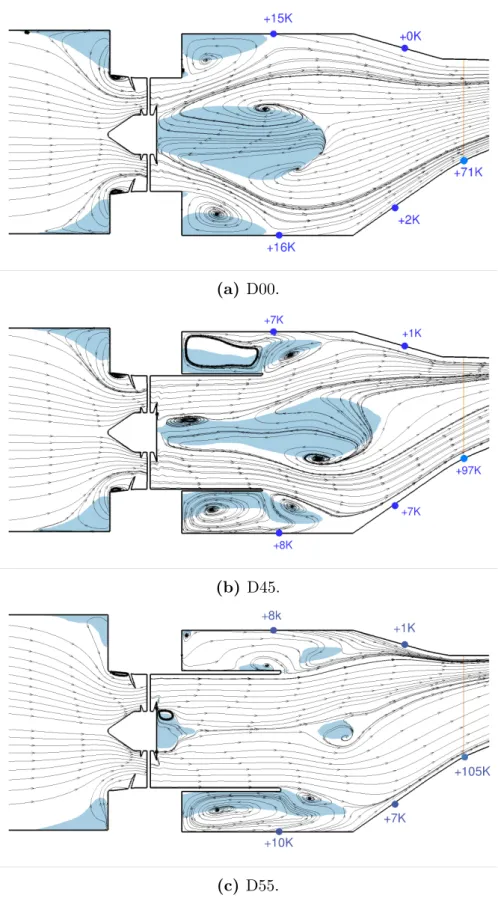
2.2.3 Duct effect on the swirler flow . . . 55
2.2.4 Hydrodynamic instability: the PVC . . . 58
2.3 Intermediate conclusions on the initial design phase . . . 62 Chapter 3 Trisector test rig experimental validation and
3.1 UNIFI trisector rig . . . 64
3.1.1 Presentation of the test facility . . . 64
3.1.2 Instrumentation . . . 65
3.2 Isothermal operating point . . . 70
3.2.1 Algebraic representation of the test rig . . . 70
3.2.2 Selection of the isothermal operating point . . . 75
3.2.3 Validation by LES . . . 77
3.3 Summary of the available experimental investigations . . . 84
Chapter 4 Experimental flow characterization and validation of the computational approach 85 4.1 Isothermal PIV inside the chamber . . . 86
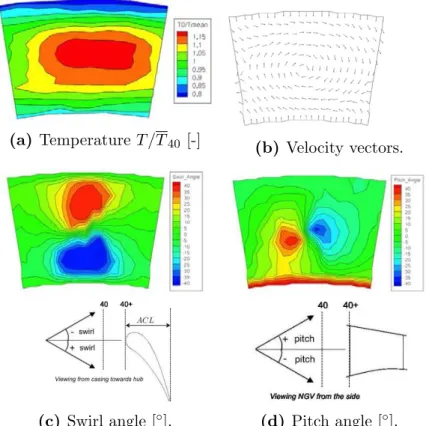
4.2 Time-averaged aerothermal field in plane 40 . . . 90
4.2.1 Flow velocity . . . 91
4.2.2 Temperature field . . . 97
4.3 Conclusions . . . 99
Part III Advanced diagnostics for the exploitation of the com-bustor simulator setup 101 Chapter 5 Sensitivity of the LES to the numerical parameters 103 5.1 Numerical parameters under study . . . 104
5.1.1 Mesh . . . 104
5.1.2 Sub-grid scale model . . . 104
5.1.3 List of the cases . . . 106
5.2 LES quality criteria . . . 106
5.3 Prediction of the mean flow and turbulence . . . 109
5.3.1 Flow field inside the swirler . . . 110
5.3.2 Flow field in the chamber . . . 114
5.4 Comparison with experimental results . . . 117
5.4.1 PIV results in the central plane . . . 117
5.4.2 Swirl and temperature distortion in plane 40 . . . 119
5.5 Conclusions . . . 121
Chapter 6 Advanced diagnostics for the numerical and experi-mental turbulence characterization 123 6.1 Configurations under study and available data . . . 124
6.2 Turbulence intensity in plane 40 . . . 125
6.2.1 Assessment of the convergence . . . 125
6.2.2 Comparison between experiments and LES . . . 126
6.3 Evaluation of an integral scale of turbulence . . . 129
6.3.1 Methodology . . . 129
6.3.2 Sensitivity to the measurement parameters . . . 132
6.3.3 Comparison between experiments and LES . . . 136
Chapter 7 Advanced statistical representation of temperature 141
7.1 Statistical framework . . . 142
7.2 Advanced characterization of the combustor temperature field . . . 146
7.2.1 Validation of the sampling . . . 147
7.2.2 Results and discussion . . . 147
7.2.3 Statistical representation of the radial profile of temperature 152 7.3 Conclusion . . . 154
Part IV Integrated approach of the combustor-turbine interac-tion in LES 155 Chapter 8 Impact of the presence of vanes at the exit of the combustor simulator 157 8.1 Geometry and mesh . . . 158
8.2 Influence of the clocking position . . . 161
8.2.1 Migration of the hot streak . . . 161
8.2.2 Vane surface temperature . . . 164
8.3 Potential effect induced by the vanes . . . 165
8.3.1 Mass flow distribution . . . 166
8.3.2 Temperature . . . 168
8.3.3 Turbulence level . . . 171
8.4 Conclusions . . . 175
General conclusion and perspectives 177
Appendix A Characterization of the effusion cooling system 183 Appendix B Full experimental and numerical results in plane 40 189
Appendix C Large Eddy Simulations with the AVBP solver 195
Appendix D Publications 203
Acronyms
5HP 5 Holes pressure Probe ACL Axial Chord Length
CF D Computational Fluid Dynamics CF L Courant Friedrich Levy
CP U Central processing unit CRZ Corner RZ
CS Combustor Simulator CT RZ Central Toroidal RZ
DM D Direct Mode Decomposition DN S Direct Numerical Simulation DP Design Point
F F T Fast Fourier Transform HP High Pressure
HP C High Performance Computing HP R High Pressure Rotor
HS Hot Streak
HW A Hot Wire Anemometry IOP Isothermal Operating Point LE Leading Edge
LES Large Eddy Simulation LOT DF Local OTDF
LP V Low Pressure Vane LRT DF Local RTDF
N GV Nozzle Guide Vane N S Navier-Stokes equations OF Orifice Flowmeter OP R Overall Pressure Ratio OT DF Overall TDF
P A Passage between two vanes P IV Particle Image Velocimetry P S Pressure Side
P SD Power Spectral Density P V C Precessing Vortex Core
RAN S Reynolds-Averaged Navier-Stokes RQL Rich burn - Quick quench - Lean
Burn
RT DF Radial TDF RZ Recirculation Zone
SF C Specific Fuel Consumption SGS Sub-Grid Scale
SS Suction Side
T DF Temperature Distribution Factor T E Trailing Edge
T ET Turbine Entry Temperature T HCP L Unsheathed thermocouple T S Traverse System
U N IF I University of Florence Operators
< Φ >θ Circumferentially-averaged
< Φ >r Radially-averaged
¯
Φ Time-averaged Greek letters
β Azimuthal position in the CS γ Ratio of specific heat
µ Dynamic viscosity
µ1 First order moment (mean)
µ2 Second order moment (variance)
µ3 Third order moment (skewness)
µ4 Fourth order moment (kurtosis)
ν Kinematic viscosity
ρ Density
σ Standard deviation τ Blowing ratio, time-lag τw Wall shear stress
Θ Reduced temperature Υ Momentum flux ratio
Ξ Non-dimensional temperature coef-ficient uτ Shear velocity Subscripts 40 Plane 40 40+ Plane 40+ 41 Plane 41 θ Tangential component CI Inner Cavity (coolant flow) CO Outer Cavity (coolant flow) cool Coolant flow
M Mainstream (swirlers)
meas Measured on the experimental grid r Radial component
res Resolved
RM S Root Mean Square sgs Sub-grid scale sw Swirler
tot Total (sgs + res) x Axial component Variables
∆t Duration of the signal ˙
m Mass flow rate ˙q Heat flux ~
V Velocity vector B(α, β) Euler beta function
D Diameter
f Frequency
HT C Heat Transfer Coefficient k Turbulent kinetic energy L Characteristic length
M Mach number
N Number of samples
P Pressure
p Probability
pdf Probability density function QI Quality index
R Radius
RVxVx Autocorrelation coefficient on Vx Re Reynolds number
SN Swirl Number
St Strouhal
T Temperature
t Time
Tad Adiabatic flame temperature
Taw Adiabatic wall temperature
tCS CS through flow time
Tmode Most probable temperature
tturb Turbulent timescale
Twall Wall metal temperature
T U Turbulence intensity
Uref Mean axial velocity at swirler exit
V Instantaneous velocity V′
Velocity fluctuation y Distance to the wall
Aeronautical gas turbines
Nowadays, engines powering modern and large commercial or military aircraft essentially rely on gas turbine technologies. Such engines are indeed delivering enough thrust with respect to their own weight making them the only engine technology suitable to operate most aircraft. In the aeronautical industry, gas turbines provide the energy required for the motion of the aircraft either directly by the ejection of a fast moving jet propelling the airframe forward (turbojet, turbofan engines Fig. 1a) or via mechanical power transmission to a propeller (turboprops driving an open rotor or turboshafts for helicopter engines Fig. 1b). Irrespectively of such aspects, all gas turbine engines are composed of successive components dedicated to specific thermodynamic changes of the flow. First, the air enters through the engine intake (labelled as station 4 in Fig. 1) and crosses one or more compressors until station 1 where it mixes with fuel and burns in the combustion chamber. The highly energetic burnt gases are then expanded through a turbine localized between station 2 and 3 to finally be expelled through a rear nozzle. For a turbojet or turbofan, the thrust is obtained by the expansion of the hot gases in the outlet nozzle while torque engines collect shaft power by a free turbine located at the rear of the engine.
4 1 2 3
(a) Turbofan engine.
4 1 2 3
(b) Turboshaft engine. Figure 1: Cross sections of aeronautical gas turbines.1 1
The successive thermodynamic changes imparted to the flow throughout the successive engine components (4 → 1 → 2 → 3) correspond to a Brayton thermo-dynamic cycle depicted in Fig. 2 in an entropy (S) - temperature (T ) diagram.
Figure 2: Brayon thermodynamic cycle.
Considering an ideal cycle (no-loss), the flow follows a compression (4 → 1), a heat addition by combustion (1 → 2) and an expansion (2 → 3). For combined cycles, heat can be extracted after the expansion phase thanks to a heat exchanger (3 → 4) but such solution is not technologically applicable for aeronautical propul-sion. The thermodynamic representation of an aeronautical engine points to two crucial quantities monitoring the engine operation: (i) the Overall Pressure Ratio (OPR) defined as the pressure ratio between station 1 and 4; (ii) the Turbine Entry Temperature (TET) corresponding to the temperature at station 2. Both OPR and TET are found to impact the engine performance which is assessed by:
(i) the specific thrust (output thrust divided by the engine inlet mass flow rate) or
similarly the specific power for turboshaft engines; (ii) the Specific Fuel Consump-tion (SFC) defined as the fuel flow rate divided by the output thrust or power. Both quantities are somehow coupled with specific consequences on the engine be-haviour. The following observations are usually accepted for existing or currently developed engines. Specific thrust improves significantly with TET (see Fig. 3a), at the expense of an increase of the SFC (Fig. 3b). At the same time fuel con-sumption being highly undesired, it may be improved by increasing the OPR, an engine capacity essentially relying on the compressor capacity of attaining a desired level of compression in the engine. The final engine performance thus results from compromises between the desired levels of SFC, thrust and the accessible values of OPR and TET which are today limited by the current technological solutions able to satisfy the mechanical integrity of the engine, weight, cost etc. Overall, significant gains in engine performance were obtained in the last 40 years by push-ing away the limits for OPR and TET while improvpush-ing the design of the different engine components. Nowadays, each individual engine module reaches efficiency levels to a point where any gain can only be the result of a significant effort and cost or a major technological breakthrough. As a consequence, researchers and design teams tend to focus more on the interactions between engine components as gains in overall engine performance can be obtained by better apprehending the interfaces. Indeed, all the engine components interact with their neighbours and a
(a) Specific thrust versus OPR. (b) SFC versus OPR.
Figure 3: Performance of an aero-engine gas turbine based on the SFC (a) and specific thrust (b) [1].
gas turbine is a complex 3-D fully unsteady machine which cannot be adequately represented by a succession of independent modules. This new trend for integrated design of multiple components constitutes a major change for industry where each module is usually developed by dedicated teams.
Because of the complex modular structure of a gas turbine, many interfaces ex-ist throughout the main flowpath from the air intake to the exhaust. Amongst all, the most important ones are located around the combustion chamber: compressor-combustor and compressor-combustor-turbine. Indeed, in light of the increase of TET and OPR observed in the last decades, these portions of the engine are subject to in-creasingly strong constraints. For the compressor-combustor interface, it is known that heterogeneities exiting the compressor can significantly alter the flow distri-bution in the chamber while combustion unsteadiness can affect the performance of the compressor [2–6]. The combustor-turbine interface is even more sensitive since it is located at the most critical part of the engine in terms of temperature, pressure and stress levels. Indeed, the temperature in the combustion chamber (peak above 2200 K) is much larger than the melting point of the combustor and turbine walls which therefore have to be cooled.2 The implementation of cooling
technologies remains in itself a complex issue as it has to be efficient while relying on a minimum amount of fresh air to be injected locally to maximize the amount of air available for emission control and save engine performance.3 This optimization
process is even more complexified by the actual change of technology taking place in the design of the combustion chambers. Indeed, with the generalization of Lean Burn configurations for aero-engine combustors, the amount of fresh air for the cooling of the walls reduces compared to more classical Rich burn - Quick quench - Lean Burn (RQL). For the former (Fig. 4a) cooling is only provided by effusion cooling devices to save air and shield the chamber walls from the hot gases. For
2
To give an example usual TET are about 1600 K while the turbine blades melt at 1200 K.
3
In 1976 Cox [7] estimated that each 1% additional cooling air can decrease the take-off thrust by 2.25%.
(a) Lean Burn: GE TAPSII [8]. (b) RQL [9]. 0 20 40 60 80 100 -1.2 -1 -0.8 -0.6 -0.4 -0.2 0 0.2 0.4 R ad iu s (% )
Temperature (arbitrary scale) RQL
Lean burn
(c) Typical temperature profiles at the combustor exit. Figure 4: Configurations of current aero-engine combustors.
RQL architectures (Fig. 4b) dilution holes however cool down the main combustor hot flow stream by feeding the chamber with a lot of fresh air prior to its entry in the turbine stages. A result of such different technological constraints is that the temperature profile at the inlet of the turbine (schematically shown in Fig. 4c) features a strong central peak for the RQL case while it is more uniform in the central region with a rapid and intense cooling in the near wall region for the Lean Burn case. In terms of individual components, the main objective of the new generation of Lean Burn combustors is not necessarily to improve the exit temper-ature profile but instead to reduce NOx production with an increased durability of the combustor. It nonetheless comes at the expense of a high level of swirl in the chamber as well as advanced cooling systems for which design methodologies are less mature than for RQL combustors and still cause difficulties in the design of turbine stages.
Regardless of the technological layout of the combustion chamber, an increas-ingly harsh environment at the exit of the combustor is always detrimental to the turbine. It is for the turbine particularly important to control the velocity and temperature distributions at the combustor exit as they directly impact both the work extraction of the stages as well as drive the wall heat transfer on the vanes and rotor surfaces and consequently its life duration. This is the entire problem-atic of the combustor-turbine interface treatment and the adequate prediction of the combustor exit quantities by means of Computational Fluid Dynamics (CFD), which constitute the core of this thesis.
Available computational tools
The rapid evolution of computer science and the significant increase of available computational power contributed to a fast and efficient development of CFD not only in the research community but also in the industrial design processes. Such numerical methods drastically changed the design practices for gas turbines in the last 30 years and helped gaining efficiency for every single components of the en-gine.
Today, many reacting and non-reacting Navier-Stokes (NS) equation solvers are able to simulate the flow inside aeronautical gas turbines. Three main numer-ical approaches exist [10]: Reynolds-Averaged Navier-Stokes (RANS), Large Eddy Simulation (LES) and Direct Numerical Simulation (DNS) as illustrated in Fig. 5:
• In RANS simulations, the NS equations are ensemble-averaged (or time-averaged) so only the mean motion is resolved and a turbulence model is used to represent the action of the fluctuations [12]. Despite their lack of universality, RANS models are widely used in industry because they are cheap and allow quick simulations providing a satisfactory estimate of the flow field when properly used.
• LES approaches allow a more accurate representation of the energetic content of the flow, at the expense of an increased computing cost. Conceptually, the idea of LES is to compute the time-dependent flow solution by filtering the NS equations so only the biggest scales of the flow (highly energetic) are resolved while a model (usually dissipative) accounts for the small scales (less energetic) [13, 14]. The transition between resolved and modelled scales
is obtained by the filtering operation which in most cases depends explicitly on the mesh size.
• In DNS all the scales of the problem are resolved in time and space, thus requiring a very fine spatial and temporal discretization which is today only affordable for academic test cases or research programs [15].
As this thesis focuses on the simulation and qualification of the combustor-turbine interface, a proper prediction of the turbulent and highly unsteady flow inside the combustion chamber is required. LES being now the reference ap-proach to simulate such flows [16–20], it has been a natural choice to rely on the AVBP solver4 developed by CERFACS and IFP-EN for the numerical study of the
combustor-turbine interaction.
Objectives and outcomes of this thesis
This PhD thesis was launched and funded by Turbomeca (SAFRAN group) in partnership with CERFACS within the framework of the European project FAC-TOR5 (Full Aerothermal Combustor Turbine interactiOn Research). The main
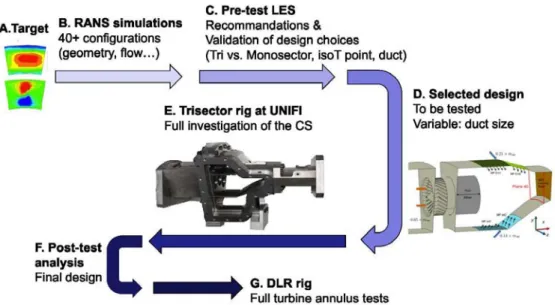
objective is to improve the current characterization of the combustor-turbine in-terface to impact existing design processes and improve gas turbine efficiency. To do so, a first step is dedicated to the development of a new test rig in close col-laboration with the University of Florence in Italy (UNIFI). This includes the definition and integration of measurement techniques and the use of pre-test LES to analyse the flow in the test module. A second step focuses on the qualification of the combustor-turbine interface by means of high fidelity simulations and the use of advanced diagnostics.
The outcomes of this study in light of its initial objectives are summarized in the following points:
• The development within the FACTOR project of a new non-reactive Com-bustor Simulator (CS) representative of modern Lean Burn engines. In this context, the use of LES for pre-test simulations during the design phase to validate design choices proves that LES can be employed at early stages of the development as confirmed by a posteriori validation of such blind test computations.
• In collaboration with UNIFI, a new test rig installed at Florence now pro-duces a comprehensive and exhaustive experimental database qualifying ad-vanced simulations and exit chamber quantities useful for the design and understanding of the combustor-turbine interface.
• From such exercises, analyses of the methodology result in a best practice for the numerical computation of the CS.
4
www.cerfacs.fr/~avbp
5
• Advanced diagnostics and validation procedures to take advantage of the rich time-resolved fields provided by LES are furthermore proposed in an attempt to improve the design process existing today for the combustor module but also for the turbine. At this occasion it is shown that it is sometimes possible and necessary to go beyond the simple analysis of mean (and RMS) fields to qualify predictions. This is demonstrated by application of the proposed di-agnostics to existing gas turbines (not reported here) but also for validations against experimental data on FACTOR CS.
• Finally, integrated simulations of the CS fitted with vanes at its exit highlight the resulting potential effect and the influence of the clocking for the specific case of a Lean Burn architecture.
Some specific elements of the work performed during this thesis were published in various articles and are listed here:
[a] C. Koupper, G. Caciolli, L. Gicquel, F. Duchaine, G. Bonneau, L. Tarchi, and B. Facchini. “Development of an Engine Representative Combustor Sim-ulator Dedicated to Hot Streak Generation”. In: Journal of Turbomachinery 136.11 (2014)
[b] C. Koupper, T. Poinsot, L. Gicquel, and F. Duchaine. “Compatibility of Characteristic Boundary Conditions with Radial Equilibrium in Turboma-chinery Simulations”. In: AIAA Journal 52.12 (2014), pp. 2829–2839
[c] C. Koupper, L. Gicquel, F. Duchaine, T. Bacci, B. Facchini, A. Picchi, L. Tarchi, and G. Bonneau. “Experimental and Numerical Calculation of Tur-bulent Timescales at the Exit of an Engine Representative Combustor Sim-ulator”. In: ASME Turbo Expo 2015: Turbine Technical Conference and
Ex-position. GT2015-42278. 2015
[d] C. Koupper, L. Gicquel, F. Duchaine, and G. Bonneau. “Advanced Combus-tor Exit Plane Temperature Diagnostics Based on Large Eddy Simulations”. English. In: Flow, Turbulence and Combustion (2015), pp. 1–18
[e] T. Bacci, G. Caciolli, B. Facchini, L. Tarchi, C. Koupper, and J.-L. Cham-pion. “Flowfield and temperature profiles measurements on a combustor sim-ulator dedicated to hot streaks generation”. In: ASME Turbo Expo 2015:
Turbine Technical Conference and Exposition. GT2015-42217. 2015
[f] T. Bacci, B. Facchini, A. Picchi, L. Tarchi, C. Koupper, and J.-L. Cham-pion. “Turbulence field measurements at the exit of a combustor simulator dedicated to hot streaks generation”. In: ASME Turbo Expo 2015: Turbine
Technical Conference and Exposition. GT2015-42218. 2015
The paper referred as [a] in the previous list was presented under the reference GT2014-25120 during the ASME Turbo Expo (Turbine Technical Conference and Exposition) held in Dusseldorf, Germany in June 2014. Note that all six papers are reproduced in Appendix D.
Outline of the manuscript
To address the objectives and results presented previously, the outcome of the work is constructed around four main parts and eight chapters:
Part I contains a detailed introduction to combustor turbine interactions. • Chapter 1 proposes a literature review to introduce the specific issues
associated with the combustor-turbine interface along with the main experimental and numerical results from previous studies. The need for a new engine-representative test-rig in Europe within the FACTOR project is justified at this occasion.
Part II details the development of a Lean Burn engine-representative CS for FAC-TOR.
• Chapter 2 focuses on the development of the CS, the proposed method-ology and the validation of the design choices by the use of pre-test LES.
• Chapter 3 details the set up of the trisector rig used for validation of the CS design with a special insight given on the instrumentation and definition of the operating points.
• Chapter 4 ultimately summarizes the experimental results obtained on the trisector rig and compares them with the blind-test LES for a
pos-teriori validation of the computational methodology.
Part III proposes further exploitation of the CS data by use of advanced diag-nostics.
• Chapter 5 discusses the methodology for the LES of the aerothermal field of the CS. The influence of numerical parameters is discussed and a best practice is proposed based on the comparison with experimental results.
• Chapter 6 enhances the analysis of the flow at the exit of the CS by characterizing turbulence quantities. Both turbulence intensity and the turbulent integral scale are evaluated from experiments and numerics. Note that the way to properly compare the two approaches is specifically discussed.
• Chapter 7 proposes a new statistical representation of the temperature field at the exit of combustors to account for the intrinsic unsteadiness of the flow at this interface.
Part IV finally focuses on the integrated simulations of the CS fitted with vanes at its exit.
• Chapter 8 brings new elements on the analysis of the influence of the turbine on the combustor flow based on advanced and validated LES of FACTOR CS fitted with a pair of vanes.
An introduction to combustor
turbine interactions
The first part of this manuscript proposes a literature review of the extensive research performed on the combustor-turbine interactions. Special attention is given to the description of the main facilities dedicated to the subject and the most important findings obtained in the last thirty years.
Literature review
Contents
1.1 The combustor and turbine modules . . . 12
1.1.1 Technological layout and flow characteristics . . . 12
1.1.2 Characterisation of the temperature field distortions . 15
1.2 Influence of the combustor on the turbine . . . 18
1.2.1 Research facilities dedicated to hot streak transport . . 18
1.2.2 Main results of the past studies . . . 25
1.3 Influence of the vanes on the combustor . . . 34
1.3.1 Potential effect . . . 34
1.3.2 Acoustics . . . 37
1.4 Concluding remarks . . . 39
The common practice for the development of gas turbine components is to design each module separately: compressors, chamber, turbines, etc. This design process requires a very precise definition of the interfaces between modules and supposes that there is no interaction between the different parts of the engine. It is acknowledged that this is not true and that further research is required to im-prove the design techniques. One of the most critical connection in gas turbines is the combustor-turbine interface because of the harsh environnement and the large stresses encountered in the high pressure turbine.
Combustor-turbine interactions have hence been extensively studied since the 80’s to improve design practices and gain in efficiency of turbines. However and because of the complex phenomena occurring in the combustion chamber and the difficulty to perform measurements in such extreme conditions, this topic is still open and improvements from both an experimental and numerical side is still needed. Combustor-turbine interaction is a two-way process: (i) the combustor exit flow and temperature non-uniformities have a strong influence on the turbine flow while (ii) the presence of the turbine modifies the flow in the rear part of the
combustion chamber. After a brief introduction to the combustor-turbine interface in Section 1.1, a summary of the extensive research performed on the influence of combustor exit non-uniformities on the turbine in the last 30 years is proposed in Section 1.2. The influence of the turbine on the combustor flow is comparatively a much more recent field of research. The main results on this topic primarily related to the potential effect induced by the presence of the vanes are presented in Section 1.3. Finally, main conclusions are drawn in Section 1.4 and the need for the new research program FACTOR is introduced and commented.
1.1
The combustor and turbine modules
1.1.1
Technological layout and flow characteristics
The combustor (see Fig. 1.1) is a key element of any gas turbine as it constitutes the only energy input in the machine which contributes to the rotation of the compressors, the turbines and of course the production of useful work. The main objective of a combustion chamber is to feed the turbine with a continuous flow at high temperature and pressure, composed by a mixture of air and combustion products which is no more flammable (mainly for safety reasons [27]). To do so and for recent combustors, the high velocity air exiting the compressor is slowed down by a diffuser and guided towards the combustor primary zone through swirlers to create low velocity conditions favourable for combustion to proceed. Fuel (either liquid or gas) is injected in this region and burns with the air, producing an increase of the gas temperature up to about 2 500 K. As this mixture is far above the melting temperature of the walls, fresh air is introduced in the rear part of the combustor to cool down the flow and control pollutant emission levels. As mentioned earlier, this
cooling is usually supplied by dilutions holes for RQL architectures while for Lean Burn technologies only effusion cooling and films through the liners are used [9] (see Fig. 1.2).
Figure 1.2: Effusion cooling systems for combustors [1].
This flow composed of burnt products and cooling air is more or less uniformly mixed and enters the High Pressure (HP) turbine whose first element is the row of Nozzle Guide Vanes (NGVs) visible in Fig. 1.1. The objective of the successive turbine stages is to expand the flow to a lower pressure and temperature level by extracting energy from the fluid which is then used to drive the compressor stages. The HP turbine is composed of a row of NGVs (also called stators) followed by a row of rotating rotor blades: the High Pressure Rotor (HPR). In most of the recent engines the turbine is driven by the impact of the gas flow on the blades (impulse) and its subsequent reaction as it accelerates through the converging blade passage (see Fig. 1.3a). The NGVs are thus shaped to swirl and accelerate the gas flow in the direction of the rotor’s rotation to maximize the turbine efficiency. While doing so, a high pressure zone associated with lower velocities forms on the Pressure Side (PS) of the aerofoil whereas the accelerating gas on the Suction Side (SS) strongly reduces the pressure level (see Fig. 1.3b). These pressure differences between SS and PS, added to the axial pressure difference due to the flow expansion impart strong axial and torque loads to the NGVs which have also to withstand the thermal stresses induced by the high temperature level and gradients encountered at the exit of the combustor.
The discrete position of the burners (and possibly dilution holes) all around the combustor circumference leads to the formation of significant temperature gradients which are reinforced in the radial direction by the film cooling devices and core flow mixing. As a result, the flow field at the exit of the combustion chamber usually features a distinct zone of higher temperature: the so-called Hot Streak (HS). The measured combustor exit temperature field of a modern Rolls-Royce engine [29] is shown in Fig. 1.4: in this example, the HS generated by the burner is located in the center, showing both a radial and circumferential distortion of the temperature.
(a) Impulse-reaction turbine [1]. (b) Mach number in a turbine stage [28]. Figure 1.3: Flow characteristics of a HP turbine stage.
Figure 1.4: Temperature field measured over one pitch at the exit of a Rolls-Royce engine combustor [29].
The presence of such temperature non-uniformities at the inlet of the HP tur-bine is a challenge for the control of heat transfer on the turtur-bine surfaces. This is especially true for the NGVs which are directly fitted at the exit of the combustor and have to face a flow temperature usually hundred of degrees above the melt-ing temperature of the nickel-based alloys used for blades [30]. To allow a high turbine inlet temperature while preserving the vanes life, proper cooling inside the stators is usually required. This cooling air extracted from the compressors is usually discharged through holes located on the vane airfoils (see Fig. 1.5a) from the Leading Edge (LE) to the Trailing Edge (TE). As the amount of cooling air has to be minimized to preserve the engine thermal efficiency, other techniques are also employed [1], for example by reducing the vane thermal conduction (Thermal Barrier Coatings, single crystal casting...). Even if the flow expansion through the NGV row reduces the temperature level, the HPR still has to withstand important
thermal stresses. Cooling is hence also required (not shown in Fig. 1.5b) and its technological implementation is made even more complex due to the rotation of the module [1, 31]. In addition to the thermal stresses, the rotor blades have there-fore to cope with the tremendous centrifugal force (typically around 18 tonnes per blade [1]) and they require an efficient fixation mechanism on the disc (usually by use of a fir-tree fitting as shown in Fig. 1.5b). The rotor blades may finally incorporate a shroud at the tip (see Fig. 1.5b) which reduces the overtip leakage (efficiency gain) but increases the weight.
(a) Nozzle Guide Vane. (b) High Pressure Rotor blade. Figure 1.5: Characteristics of a typical NGV and HPR (adapted from [1]).
In this context of high thermal and mechanical stresses as well as the difficulty of implementing cooling systems, the adequate characterisation of the temperature field at the turbine inlet readily becomes of primary importance. To do so, different mathematical measures of the temperature distortions are today used in the gas turbine community and the main ones are discussed hereafter.
1.1.2
Characterisation of the temperature field distortions
The first important information that impacts the turbine operation is the mean temperature at the turbine inlet (so-called Plane 40 ), usually noted T40 and
pre-viously referred as TET. This quantity is critical since identified in the reference thermodynamic cycle and is needed for performance calculations. Note that T40
can be estimated by considering that all the fuel is burnt in the chamber (without heat losses) and that the mixture exits the chamber at chemical equilibrium yield-ing the adiabatic flame temperature. Note that for this theoretical estimation of T40, the temperature of the fresh gas at the inlet of the combustor, often noted
T30, is needed.1 Having knowledge of these macro parameters, a lot of different
measures can be used to quantify the degree of non-uniformity of the temperature field at the turbine inlet (i.e. in plane 40). There is actually no proper consensus on the use of a specific quantity to qualify these distortions. Povey et al. [29]
1
In the case of multiple inlets or various cooling devices etc. the precise definition of T30 is
propose the definition of a set of measures commonly used today in industry: the Temperature Distorsion Factors (TDF). Amongst them, the Overall TDF (OTDF) measures the divergence of the hottest point in plane 40 comparatively to the mean temperature in the same plane. It is therefore a single value evaluated at the given axial position x0 (corresponding to the plane 40) and defined by:
OT DF (x0) =
M ax(r,θ)(T (x0, r, θ)) − T40
T40− T30
, (1.1)
where T stands for the temperature. Similarly, the Radial TDF (RTDF) measures the temperature non-uniformity of the flow field averaged in the circumferential direction for a given axial position x0. It is also a single value, defined by:
RT DF (x0) =
M ax(r)(hT (x0, r, θ)iθ) − T40
T40− T30
, (1.2)
where hiθ is the circumferential averaging.
When a more local definition of the temperature is required at a given axial position x0, one can use the Local OTDF (LOTDF, two-dimensional field) or the
Local RTDF (LRTDF, 1-D radial profile), respectively defined by:
LOT DF (x0, r, θ) = T (x0, r, θ) − T40 T40− T30 , (1.3) LRT DF (x0, r) = hT (x0, r, θ)iθ− T40 T40− T30 . (1.4)
In the context of non-reactive test rigs, these definitions are not well defined and alternative definitions derived from Eqs. (1.3) and (1.4) are sometimes used [29]:
LOT DF′ (x0, r, θ) = T (x0, r, θ) T40 , (1.5) LRT DF′ (x0, r) = hT (x0, r, θ)iθ T40 . (1.6)
Note that other definitions exist as evidenced by the proposition of Barringer and coworkers [32–35] that propose a radial profile of temperature to follow:
LRT DF′′
(x0, r) = hT (x0, r, θ)iθ− T40
T40
. (1.7)
Because of the great diversity in the definition of these non-dimensional tem-perature coefficients, extra care has to be taken when they are employed especially for comparisons between different cases. Moreover, the use of such indicators to qualify the temperature field is questionable as they provide limited information which may not be representative of the full unsteady and spatial temperature distribution. Indeed, both time and space averaging operations employed in the
construction of the TDF are responsible for a loss of information so very distinct temperature fields may produce the same TDF. As the treatment of data at the combustor turbine interface is being more and more discussed, the exclusive use of such 0-D or 1-D indicators to qualify a combustor design becomes more and more criticised [36, 37]. Some new elements on this specific issue will be presented in Chapter 6.
Although the potential limits of these measures of the temperature distortions have been acknowledged, they still constitute a basis for the design of turbines [29, 38, 39]. Amongst them, the LRTDF defined in Eq. (1.4) is the most common rep-resentation of the temperature field at the turbine inlet and it constitutes an important target during the design phases of the combustor. As the first devel-opment stages of new combustion chambers currently rely mainly on CFD, the numerical solvers need to be sufficiently predictive and provide a good estimate of the temperature field at the combustor exit. Very few results [40–42] were pub-lished on this topic because of the lack of experimental validation (measurements are complex at the combustor-turbine interface) and industrial confidentiality. To give an example, Fig. 1.6 reproduces the comparison between LES, RANS and measurements of the LRTDF at the exit of two combustion chambers: a reverse-flow combustor (Fig. 1.6a) investigated by Boudier et al. [41] and an axial chamber (Fig. 1.6b) studied by James et al. [42]. One can see that accurately predicting the LRTDF is a tough task with clear difficulties for RANS methods and improve-ments in the numerical prediction quality when LES is used [20, 43]. This study also highlights the difficulty to have exhaustive measurements of temperature at the combustor exit, as the experimental LRTDF profile is here given by very few points. These observations emphasize that even before studying the impact of such temperature profiles on the turbine, the adequate characterization of the flow at the exit of a combustor constitutes in itself a challenging task for both numerical and experimental approaches. Leaving aside this issue (that will be discussed in details in Parts II and III of this thesis), the significant radial non-uniformities observed in Fig. 1.6 justify the extensive research that was performed in the last 35 years on the influence of combustor exit non-uniformities on the turbine flow. An overview of this effort is presented in the following section.
(a) Reverse-flow real combustor [41]. (b) Developmental axial combustor [42]. Figure 1.6: LRTDF profiles obtained by CFD or measurements.
1.2
Influence of the combustor on the turbine
The fact that the combustor exit non-uniformities impact the turbine is known since the 70’s and most of the early research on such issues was experimental and not numerical. All these experimental investigations led to the discovery of the most important mechanisms driving the transport of HSs in HP turbines. Numer-ical treatment and simulations were initiated mostly in the 90’s to complement these findings. The most important and known facilities dedicated to this issue are presented hereafter.
1.2.1
Research facilities dedicated to hot streak transport
Povey et al. [29] and Dorney et al. [44] proposed an exhaustive review of the existing HS simulators for turbine testing. This work, as well as other literature reviews, shows that no less than ten rigs devoted to HS studies have been created since the 80’s. The majority of the known and reported facilities are located in the USA. It is only recently that interesting facilities appeared in Europe such as the ILPF [45, 46] in the UK and the ongoing European project FACTOR. The different test rigs can be classified in three main categories: early facilities used to analyse the governing mechanisms; engine representative test rigs (developed afterwards) and specific facilities dedicated to the study of a precise phenomena.
First investigations and early facilities
The very first facilities built in the early 80’s were designed for proof-of-concept investigations. It is not intended here to present them in details but the three most important ones are introduced:
The Warm Core Turbine Test Facility (WCTTF) located at the Nasa Lewis Research Center, Cleveland, Ohio was developed in 1983. It has been de-scribed in details by Stabe, Whitney and Moffitt [47, 48]. The experimental results were also recently used as a basis for numerical studies by Dorney et al. [49]. To the authors knowledge, it is the only reactive facility dedicated to the study of HSs. For this test rig, a scaled down HP turbine stage is fed by the burnt mixture of a primary flow annular can combustors with added cooling air coming from four slots, as indicated in Fig. 1.7a.
The Large Scale Rotating Rig (LSRR) located at the United Technologies Research Center appeared also in 1983. For this facility, the HS was sim-ulated by a local density change (isothermal flow) through the injection of CO2 upstream of the turbine components (see Fig. 1.7b). The CO2
concen-tration was then tracked by gas analysers on the surface of a true-scale 1.5 turbine stage. Results were published by Joslyn and Dring [50–52], Butler et al. [53] and Roback and Dring[54, 55].
The Rotating Blow-Down Facility (RBDF) located at the Massachusetts In-stitute of Technology, Cambridge (USA) was developed in 1983. The facil-ity (Fig. 1.7c) was specifically designed by Shang [56] and co-workers to be more engine-representative and adjustable than previous rigs. Four hot streaks were generated by a controllable heat exchanger and then transported through a HP turbine stage while different translating rakes allowed to mea-sure the temperature and presmea-sure profiles at multiple stations of the test rig. Shang and co-workers also reported experimental results [57] and CFD simulations based on this rig configuration [58].
(a) Flow path through the Warm Core Turbine Test Facility [47].
(b) Large Scale Rotating Rig HS cascade [54].
(c) MIT HS generator and test rig [57]. Figure 1.7: Pioneer facilities for the study of HSs.
The first results obtained with these facilities allowed better understanding of the flow and heat transfer dynamics in HP turbines. However, even if these test rigs usually feature engine hardware turbine stages, they do not reproduce a realistic flow field at its inlet. Therefore, in the late 90’s larger facilities were developed with the aim of being more engine representative.
Engine representative facilities
More realistic test rigs started to operate ten to fifteen years ago in the USA and UK. They differ from the previous ones by a more realistic layout, a complex and heavy instrumentation and a blow-down operating mode when early facilities operated continuously. These facilities were designed to get a deep insight on HS interaction with turbines and provided a large amount of information. An overview of these test rigs is given here:
The Isentropic Light Piston Facility (ILPF) was built at QinetiQ, Hamph-sire, UK in 2002 and constitutes the first large test facility on this topic built in Europe. A piston was used to rapidly compress air to feed a HP turbine stage in a blow-down mode, as shown in Fig. 1.8a. The test rig is described by Hilditch et al. [45] and Chana et al. [46]; with test results published by Povey and coworkers [62, 63]. As part of the Brite-Euram Turbine Aerother-mal External Flows programme (TATEF II), the facility was upgraded in 2008 [29, 59]. The main targets of these improvements were: getting a strong, well-defined temperature profile (referred as Enhanced-OTDF generator), re-ducing run-to-run variations while using a rolling device to study HS-NGV clocking effect. During this project, a HP turbine called MT1 was installed and instrumented on the rig. It now constitutes a widely used basis for the studies of HS transport [64, 65].
The Turbine Research Facility (TRF) located at the Air Force Research Lab-oratory, Dayton, OH appeared in 2004. A heated and pressurized nitrogen tank was discharged through a combustor emulator (see Fig. 1.8b) feeding the HP turbine with fully controllable profiles of pressure and temperature. It was extensively used and led to the publication of results by Barringer, Thole and Polanka [33–35]. A detailed description of the facility is proposed by Barringer et al. [32] and Anthony et al. [66].
The Turbine Test Facility (TTF) was installed at Ohio State University in 2004. This heavily instrumented rig features a combustor emulator that can generate local distortions of pressure and temperature (12 or 19 HSs) feeding a HP turbine with cooling and purge flows (see Fig. 1.8c). The first report by Haldeman, Dunn and Mathison [60, 67–71] investigates time-averaged aerodynamic and heat transfer for a low Reynolds number case using a 1.5 HP turbine stage hardware. The second report campaign covers a wider range of operating conditions for a heavily cooled single stage HP turbine. Time-averaged results have been published by Haldeman and cowerkers [72, 73] while unsteady performance has been reported recently by Nickol et al. [74].
The Loughborough University test rig was mounted within the Rolls-Royce University Technology Center in Combustor Aerodynamics. This annular rig shown in Fig. 1.8d features real engine hardware: an axial flow compressor, a RQL combustor (composed of 20 sectors) and removable uncooled NGVs.
(a) QinetiQ Enhanced Isentropic Light Piston Facility rig [59].
(b) Combustor emulator installed at the Turbine Research Facility [32].
(c) General layout and test section of the Turbine Test Facility [60].
(d) Fully Annular Isothermal Test Facility installed at Loughborough University [61]. Figure 1.8: Engine representative facilities for the studies of HSs.
The flow is isothermal and the HSs are simulated by the injection of CO2
which is then tracked by gas analysers mounted on moving racks. It is dedicated to the study of compressor-combustor [6] and combustor-turbine interactions [61, 75].
All these large test rigs provided an exhaustive database on the transport of HSs in HP turbines that was often used as a basis for numerical studies. In parallel to these wide-scope investigations, smaller scale facilities were built in the last ten years to address very specific issues.
Smaller scope rigs
It is worth introducing two test rigs developed to study specific points present in combustor-turbine interactions:
The University of Texas at Austin published in 2004 experimental results con-ducted by Jenkins and Bogard [76, 77] on the interaction between NGVs film cooling and HSs. The rig installed in a low speed wind tunnel features an array of electrical resistances to generate a HS and three scaled-up NGVs film-cooled at cryogenic conditions (see Fig. 1.9a). Their work aimed at re-ducing the hot spot strength by adequate positioning of HS and use of film cooling.
The University of Oxford recently presented a new blow-down experimental facility dedicated to the combustor-turbine interaction for heavy duty gas turbines. As described by Luque et al. [78], special insight is put on the interaction between the wake shed from the combustor lateral wall and the NGVs, which is a can-combustor specific issue. The test section of the facility is a linear cascade featuring four vane passages with adjustable clocking as shown in Fig. 1.9b. Swirl and turbulence are generated upstream the test section and the flow is isothermal (no HS).
(a) HS rig of the University of Texas at Austin [76].
(b) Heavy duty gas turbine linear cascade at the Osney Lab [78].
Summary and comparison
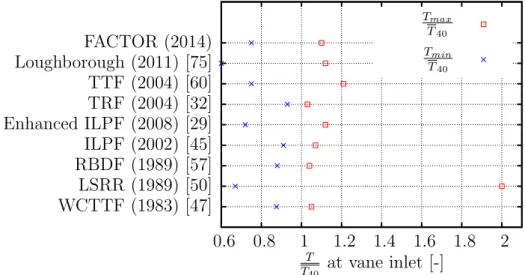
An exhaustive overview of the main test facilities is presented in Table 1.1 by summarizing all the rigs main characteristics. The on-going European project FACTOR (to be presented in Section 1.4) is also introduced in the list for compar-ison. To ease the comparison in terms of temperature range, both maximum and minimum temperature ratios at the vane inlet from the last column of Table 1.1 are plotted in Fig. 1.10 for all the identified facilities. Note that the relative po-sition of the measurement plane with the vane Leading Edge (LE) is not always given and will vary between cases.
WCTTF (1983) [47] LSRR (1989) [50] RBDF (1989) [57] ILPF (2002) [45] Enhanced ILPF (2008) [29] TRF (2004) [32] TTF (2004) [60] Loughborough (2011) [75] FACTOR (2014) 0.6 0.8 1 1.2 1.4 1.6 1.8 2 T T40 at vane inlet [-] Tmax T40 Tmin T40
Figure 1.10: Maximum and minimum temperature relative to the mean temperature at vane inlet (or upstream when data is unavailable).
When analysing the data of Table 1.1 and Fig. 1.10, the following conclusions can be drawn:
• The vast majority of the test rigs are non-reactive and use air.
• In the last 20 years, only short-duration blow-down facilities were created. They are easier to implement but prevent the use of specific measurement techniques (transient infra-red thermography for example).
• True scale engine hardware is generally used.
• The count between burners or equivalently HS generators, NGVs, High Pres-sure Rotors (HPRs) and Low PresPres-sure Vanes (LPVs) is generally not CFD-friendly (i.e. the full annulus machines are to be computed because there is no periodicity count).
• The temperature distortion at the vane inlet is usually contained within −25% and +10% of the mean temperature. Larger discrepancies between
F a cilit y Rig elem en ts F lo w co n d itio n s Op era tin g tim e H S g en era tio n T em p era tu re ra n g e M in. coun t H S : N G V : H P R : L P V T m in T 40 T m a x T 40 W a rm C o re T urb in e T est F a cilit y (N asa L ewis R esearc h Cen ter) -1983 [4 7, 48] Scale × 0 .77 H P turbine stage (26 N G V s, 48 rotor blades) A ir and N atu-ral gas Con tin uous A nn ular can com bustor and co oling air from 4 inf usion slots. Circular or elliptical H S. 0.875 1.05 1 : 1 : 1.85 : -P ≃ 3 .1 bar T 40 = 672 K L a rg e S ca le Ro ta tin g Rig (U TR C) -1989 [54] Scale × 1 .0 1.5 turbine stage (22 N G V s with TE co oling, 28 rotor blades, 28 L P v anes) A ir and C O 2 (H S trac k ing) Con tin uous Single H S sim ulated b y densit y ratio (isobaric flo w). 1.0 2.0 1 : 1/22 : 1/28 : 1/28 P ≃ P a m b T 40 = T a m b H ot streak or (c o ld st re a k ⋆ ). 0 .6 7 (⋆ ) 1 .0 (⋆ ) Ro ta tin g B lo w -D o w n F a cilit y (M IT) -1989 [56, 57] Scale × 0 .75 H P turbine stage (36 N G V s, 61 rotor blades) A rgon-f reon-12 Blo w-do wn (300ms) T ub e-bundle heat-ex cha nger to generate four H S. 0.88 1.04 1 : 3 : 5.1 : -Isen tro p ic L ig h t Pisto n F a cilit y (QinetiQ) -2002 [4 5, 46] (△ En h a n ce d ve rs io n in 2 0 0 8 [29, 59]) Scale × 1 .0 1.5 H P turbine stage (32 N GV s, 60 rotor blades, 26 L P v anes) A ir Blo w-do wn (500ms) A ir compressed and heated b y piston for H S; co oling air (am bien t T ) in tro duced from 32 ann ular slots. 0.91 1.07 1 : 1 : 1.87 : 0.81 P ≃ 4 .6 bar T 40 = 444 K 0 .7 2 (△ ) 1 .1 2 (△ ) T u rb in e Resea rc h F a cilit y (A ir F orce R esearc h Lab) -2004 [32, 66] Scale × 1 .0 1 or 1.5 H P turbine stage N itrogen Blo w-do wn (2-5s) H eated and pressurized tank feeding mainstream and co oled stream (dilution holes + film co oling). V arious pro file s of temp erature and total pressure profiles are p ossible. 0.93 1.03 1 : 1 : -: -P ≃ 2 − 7 bar T 40 = 444 K T u rb in e T est F a cilit y (Ohio State U niv ersit y ) -2 004 [60 , 71] Scale × 1 .0 1.5 H P turbine stage (38 co ole d N G V , 72 unco oled rotor blade with purge flo w, 38 L P v anes) A ir Blo w-do wn (50-100ms) Con trollable heater ro ds inserted in Inconel honey com b cells to generate a unif orm inlet o r a radial profile o r H Ss. 0.75 1.21 1 : 2 : 3.8 : 2 L o u g h b o ro u g h U n iv ersit y (R olls R o y ce U TC) -2011 [61, 75] Scale × 1 .0 unco oled N G V s (40) A ir and C O 2 (H S trac k ing) Con tin uous R QL com bustor (engine hardw are). N o temp erature distortion but C O 2 seeding in the fu el inj ector to mimic the H S. 0.6 1.12 1 : 1 : -: -P ≃ P a m b T 40 = T a m b F A C TOR -2014 Scale × 1 .0 1.5 H P T urbine stage (40 film co oled N GV s, 60 rotor blades with purge flo w , 20 L P struts) A ir Con tin uous L ean-burn CS with ax ial swirler for hot air stream and co ld air from eff usion co oling. 0.75 1.1 1 : 2 : 3 : 1 P ≃ 1 .5 bar T 40 = 450 K T ab le 1. 1: S u mmar y of the mai n ch ar act er ist ics of th e ma jor HS rigs.
the test facilities are observed for the minimum temperature (coolant) than for the maximum (HS).
• There is no facility representative of a Lean Burn technology, i.e. featuring a HS with a strong swirled flow at the turbine inlet.
All these test rigs provide a large amount of experimental data and were a basis for CFD simulations that led to a better understanding of the transport of HSs in HP turbines for RQL-like combustors. It is now intended to provide a comprehensive overview of the major findings published in the last 30 years on this topic.
1.2.2
Main results of the past studies
The study of the transport of HSs through the turbine stages mainly involves three topics which are now discussed in the following order: aerodynamics, heat transfer and turbulence.
Aerodynamics of the HP turbine
One of the key issues associated with the transport of HSs through HP turbines is the transport of temperature and pressure profiles from the combustor exit to the turbine exit. Barringer et al. [35] provided a certain amount of experimental results on this issue. They observed that whatever was the stage inlet temperature and pressure distortions, the flow at the NGV exit features almost uniform thermal conditions in the circumferential direction. These observations were confirmed by the experimental results conducted by Mathison et al. [60] on the Turbine Test Facility. In this last specific study, radial profiles of temperature are measured at the NGV inlet, rotor LE (in the rotating frame, i.e. relative temperature) and downstream of the Low Pressure Vane (LPV) as shown in Fig. 1.11. The experiments were conducted for both cooled (film cooling, TE injection, purge) and uncooled NGV as respectively shown by the blue and red curves in Fig. 1.11. For both configurations, the rotor strongly mixes the flow resulting in an almost completely uniform exit temperature. Indeed, the temperature distortion (T /Tin)
initially from 0.8 to 1.1 at the inlet is finally reduced to 0.62-0.7 at the LPV exit. The influence of cooling flows on the temperature profile is found to be uniform over most of the span with a zone of enhanced cooling at the blade tip (probably due to vane outer endwall cooling). At the LPV exit, the temperature reduction induced by the coolant flow is nearly uniform.
Barringer et al. [35] explained the intense mixing observed over the pitch by the elevated freestream turbulence and secondary flow mixing. For all the config-urations, the flow at the hub is hotter at vane exit than at vane inlet because of secondary flows convecting hot fluid pockets from midspan towards the hub. Con-tours of temperature along with secondary flow vectors in the vane exit passage are extracted from a low-Reynolds RANS simulation and shown in Fig. 1.12 for inlet profiles B (almost uniform) and D (distorted). The cold fluid migration from tip to hub is easily visible and much more pronounced for profile D which features
Figure 1.11: Migration of the radial temperature profile measured through the turbine. From right to left: NGV inlet, rotor LE, LP Vane exit [60].
Figure 1.12: CFD prediction of the temperature field and secondary flow vectors in the vane exit passage for a uniform (top) and distorted (bottom) inlet profile [35].
much higher pressure at tip and hub than profile B.
Recent unsteady RANS simulations of a 180◦
sector of two HP turbine stages were performed by Dyson et al. [36]. At the inlet of the turbine, the authors imposed either a HS described by 2-D fields of total pressure, temperature and flow angles or the corresponding circumferentially averaged profiles (1-D). Numerical results shown in Fig. 1.13 indicate that the temperature field at the inlet of the
second rotor pictures better mixing with a 2-D inlet than with a 1-D inlet profile. Indeed, for the 2-D inlet case, a pronounced large radial migration of the HS is observed in the first vane passage resulting in enhanced mixing.
(a) First rotor inlet. (b) Second rotor inlet.
Figure 1.13: Time-averaged temperature predicted by CFD at inlet of the two rotors using either a 1-D or 2-D inlet boundary condition [36].
To understand this complex migration of the temperature profile through the turbine, the path of the HS has to be investigated through local visualisation and probing. This was first performed experimentally in the 90’s by Roback et al. [54] who studied cold and hot streak migration through a rotor passage by means of density ratio changes. The HS was simulated with CO2 and injected
at the vane mid-pitch. The measurements reproduced in Fig. 1.14 indicate a strong accumulation of the HS on the blade PS, whereas the cold streak (lower temperature than the core flow) migrated on the blade SS compared to the neutral streak. This preferential migration of the HS on the blade PS was first linked by Butler et al. [53] to the Kerrebrock-Mikolajczak effect [79]. Postulating that Mach number and flow angles are roughly uniform at the NGV exit, a higher absolute velocity has to appear for the HS since V = M√γrT . Then, in the relative frame of reference of the rotor, the HS has a velocity oriented toward the PS compared to the cooler fluid. This preferential migration of the HS is hence explained by a change in incident angle induced by the temperature difference: this is the so-called segregation effect.
Numerical results by He et al. [80] complement these findings by observing that the HSs preferentially migrate on the rotor PS independently of their relative position with respect to the NGV (clocking). The entropy contours in Fig. 1.15 show a similar migration of the HS for both clocking positions. They also evidence an enhanced heating zone on the blade PS when the HS is aligned with the passage.
Figure 1.14: Measurement of the trace concentration of the hot (top), neutral (center) and cold (bottom) streak on the rotor blade SS and PS [54].
(a) HS centered on NGV LE. (b) HS centered on NGV passage. Figure 1.15: Instantaneous entropy contours showing the systematic migration of the HS towards the blade PS [80].
The observation of Fig. 1.15 reveals that the clocking of the HS dramatically changes the entropy level in the vicinity of the walls of the NGV. This was con-firmed by 3-D RANS simulations conducted by Povey et al. [63] and Qureshi et al. [65] based on the ILPF test rig configuration. The authors show that when the HS is aligned with the NGV passage (left side of Fig. 1.16), cold flow is transported towards the vane SS (hot flow towards PS). A HS aligned with the vane LE would lead to higher heat transfer on the vane SS (right side of Fig. 1.16).
Figure 1.16: Streamlines emitted by a HS located at vane mid-passage (left) and aligned with LE (right) [63].
In this context, it is clear that the HS-NGV clocking and the complex transport of HSs trough the HP turbine certainly impact the heat transfer on the vanes as well as on the rotor blades surfaces. This problematic was extensively studied from both an experimental and numerical point of view and is now discussed.
Heat transfer
The first module experiencing higher temperature levels and heterogeneities is the NGV row. Many studies therefore focus on the heat transfer on the vanes surface and its dependency to non-uniform temperature inlet conditions. Recent 3-D RANS simulations by Salvadori et al. [64] of the MT1 turbine stage show that compared to a uniform inlet temperature profile, the heat transfer is increased up to 50% on the SS and 20% on the PS when using temperature distortion profiles at the inlet. Experiments performed on the same turbine stage by Qureshi et al. [65] show that the vane wall at midspan can be as high as 20% and 5% hotter than the mean inlet temperature when a non-uniform inlet condition is used as shown in Fig. 1.17. This temperature difference is explained by the migration of the HS towards the SS, as schematically illustrated on the right side of Fig. 1.16. Various authors studied the influence of the HS-NGV clocking on the heat transfer on the vanes in order to reduce (or at least control) its level. Povey et al. [63] reports that the HS-NGV clocking changes the vane surface Nusselt number by ±20% on the SS but has a negligible effect on the PS, which confirms the previous findings.
The heat transfer on the rotor blades is another critical point of turbine design as this rotating part faces centrifugal forces in addition to the thermal stresses. The heat load in the rotor directly depends on the way the HS was transported through the vanes and its possible interaction with the cooling flows (purge, wall cooling etc.). As an example, CFD analyses by Salvadori et al. [64] shown in Fig. 1.18
Figure 1.17: Measured fluid temperature on the NGV wall for two tests with a tem-perature distortion (EOTDF) at the turbine inlet [65].
provide Nusselt contours on the MT1 rotor blade PS (relative to uniform inlet). The heat load is increased by 60% at midspan as a result of the HS preferential migration on the PS. At hub and tip, large decreases of heat transfer are directly created by the stage inlet temperature profile (cold air close to walls). Experiments by Shang et al. [58] show that the increase in the wall temperature of the blade depends nonlinearily on the level of the inlet temperature distortion.
Figure 1.18: CFD prediction of the Nusselt number on the HPR PS, relative to uniform inlet temperature [64].
Most of these studies investigating the heat transfer on the rotor blade sur-face intend to relate the heat flux to the temperature distortion alone. However, the heat flux ˙q = HT C(Taw − Twall) is driven by the difference between the wall
metal temperature Twall and the adiabatic wall temperature2 Taw as well as the
Heat Transfer Coefficient HT C. Recently, Rahim et al. [81] performed numeri-cal simulations to discriminate the predominant factor in the heat transfer of the HPR: either Taw or HT C. They found that for typical RQL engines (HS without
swirl), the heat transfer is driven by Taw (see Fig. 1.19a) while for Lean Burn
2
engines (swirling HS at inlet) it is driven by HT C (see Fig. 1.19b). Once swirl is introduced the heat transfer is therefore no longer driven by convective processes only but is subject to aerodynamic interactions. The swirl direction combined with the different NGV shapes can hence lead to ± 40% changes in the rotor heat flux, especially in the tip region, keeping unchanged the integrated performance parameters which indicates some potential need for combined aerodynamic and heat transfer optimizations.
Heat Flux HTC Taw
(a) Temperature distortion only (RQL).
(b) Temperature distortion and swirl (Lean-Burn).
Figure 1.19: Discrimination of the parameters governing the heat transfer on the rotor tip in the absence (top) and presence (bottom) of swirl at the turbine inlet [81].
Downstream of the HP turbine stage, the LPVs are also affected by the pres-ence of HS but with lower impacts. Experiments conducted by Povey et al. [62] report a heat transfer increase on the PS as high as 10 to 20% when a HS is in-jected at the turbine inlet. The authors assumed that this specific migration on the PS was mainly due to secondary flows within the vane passage along with an incidence angle segregation as stated previously (Kerrebrock-Mikolajczak effect).
Aside from the vanes and blades both inner and outer endwalls are also affected by the presence of HSs which may migrate radially in the turbine and alter the coolant protection. To quantify the impact of having HSs reaching the endwalls, Roback et al. [54] performed various experiments by injecting a HS at different positions in the spanwise direction. When injected at 75% span (i.e. close to the blade tip), the authors observe an important radial shift, showing a flow deflec-tion towards the tip. When injected at 25% span, the flow field disturbance is less important but the accumulation on the hub endwall is still four times more important compared to a mid-span HS. Note that in other facilities the HS was found to migrate towards the hub (like Shang [56] at MIT) and thus no general rule can be drawn. However, in other cases the HS may not migrate and the colder flow in the near wall region is maintained, thus protecting the wall. Povey et al. [63] reported significant reduction in Nusselt numbers at endwalls when
![Figure 1.12: CFD prediction of the temperature field and secondary flow vectors in the vane exit passage for a uniform (top) and distorted (bottom) inlet profile [35].](https://thumb-eu.123doks.com/thumbv2/123doknet/3235875.92704/40.892.239.701.463.867/figure-prediction-temperature-secondary-vectors-passage-uniform-distorted.webp)
![Figure 1.13: Time-averaged temperature predicted by CFD at inlet of the two rotors using either a 1-D or 2-D inlet boundary condition [36].](https://thumb-eu.123doks.com/thumbv2/123doknet/3235875.92704/41.892.118.728.202.476/figure-time-averaged-temperature-predicted-rotors-boundary-condition.webp)
![Figure 1.19: Discrimination of the parameters governing the heat transfer on the rotor tip in the absence (top) and presence (bottom) of swirl at the turbine inlet [81].](https://thumb-eu.123doks.com/thumbv2/123doknet/3235875.92704/45.892.139.704.328.580/figure-discrimination-parameters-governing-transfer-absence-presence-turbine.webp)
![Figure 1.29: Sketch of the FACTOR rig to be installed at DLR [103].](https://thumb-eu.123doks.com/thumbv2/123doknet/3235875.92704/54.892.192.763.323.727/figure-sketch-factor-rig-installed-dlr.webp)