HAL Id: tel-01538111
https://tel.archives-ouvertes.fr/tel-01538111
Submitted on 13 Jun 2017
HAL is a multi-disciplinary open access
archive for the deposit and dissemination of sci-entific research documents, whether they are pub-lished or not. The documents may come from teaching and research institutions in France or abroad, or from public or private research centers.
L’archive ouverte pluridisciplinaire HAL, est destinée au dépôt et à la diffusion de documents scientifiques de niveau recherche, publiés ou non, émanant des établissements d’enseignement et de recherche français ou étrangers, des laboratoires publics ou privés.
flow past a single ailfoil
Bo Li
To cite this version:
Bo Li. Aerodynamic and acoustic analysis of the tip-leakage flow past a single ailfoil. Other. Université de Lyon, 2016. English. �NNT : 2016LYSEC042�. �tel-01538111�
École Centrale de Lyon
École Doctorale de MEGA
THÈSE
Aerodynamic and acoustic analysis of the
tip-leakage flow on a single airfoil
Soutenu publiquement le 07/12/2016 par
Bo LI
en vue d’obtenir le titre de
Docteur
spécialité
Mécanique des Fluides et Aéroacoustique
Composition du jury
Pr. Gérard BOIS LML, Arts et Métiers ParisTech Rapporteur
Pr. Nicolas BINDER ISAE-SupAéro Rapporteur
Pr. Régiane FORTES-PATELLA LEGI, Grenoble INP Examinatrice
Pr. Lipeng LU Université Beihang Examinateur
Dr. Laurence VION Safran Aircraft Engines Examinateur
Dr. Jérôme BOUDET LMFA, École centrale de Lyon Co-directeur de thèse
This thesis is supported by the China Scholarship Council (CSC), the French National Research Agency (ANR), the French National Center for Scientific Research (CNRS) and the National Computing Center for Higher Education (CINES). It is supervised by Prof. Marc C. Jacob from Institut Supérieur de l’Aéronautique et de l’Espace and Dr. Jérôme Boudet from LMFA at École Centrale de Lyon in France.
My first gratitude goes to my supervisors, Marc and Jérôme. I appreciate their constant encouragement, guidance and trust. They are always available for replying all my questions and for resolving all the technical problems that I encountered.
My sincere thanks goes to my college and friend Feng Gao for his constant and great help on the numerical simulation. I would like to thank Joëlle Caro, Michel Roger, Emmanuel Jondeau, Yannick Rozenberg, Alexis Giauque and Marc Michard for the discussions. This thesis would not have been possible without their help.
I would like to thank the whole research team at LMFA. It is a great pleasure to do research in this strong international group. It provides me freedom, equality and fraternity during the thesis. In particular, I would like to thank Philippe Eyraud for the help in the library.
I want to thank Prof. Gérard Bois and Prof. Nicolas Binder for accepting to review this manuscript. Their precious comments helped to improve the final manuscript. I would also like to thank Prof. Lipeng Lu, Prof. Régiane Fortes-Patella and Dr. Laurence Vion for accepting to be members of the jury.
I received generous support and encouragement from colleges and friends, I enjoy the best time with them. I want to thank Lu Zhang (Annabelle) and Benoit Hennebelle, Gang Huang and Changwei Zhou, Xu Chen, Zhe Li, Baolin Xie, Bo Qu, Yu Bai, Ming Xiao, Lei Jiang, Xiangkun Sun, Xingrong Huang, Yu Fan, Kaijun Yi . . .
Finally, and most importantly, I would like to thank my wife Lu Zhou. Her support, encouragement, quiet patience and unwavering love were undeniably the bedrock upon which the past three years of my life have been built. I thank my parents for their faith in me and allowing me to be as ambitious as I wanted. Also, I thank Lu’s parents. They provided us with unending encouragement and support.
The tip-leakage flow is a common flow feature in turbomachines. It originates from the relative motion between the blade tip and the end-wall, and the pressure difference across the blade. The tip-leakage flow is extremely complex for its three-dimensional unsteady nature, and its existence leads to many unfavourable effects, such as aerodynamic performance losses and noise emissions. These issues have motivated extensive experimental and numerical researches from both aerodynamic and aeroacoustic points of view.
In order to improve the understanding of the tip-leakage flow and its associated broadband noise, a research campaign has been carried out at LMFA. Regarding the tip-leakage flow, this research campaign includes an experiment with advanced measurement technologies, a zonal LES computation and a series of RANS/URANS computations. Both the experiment and the simulations consider a single-airfoil configuration at low Mach number. Experimental and numerical results are analysed systematically and thoroughly in the current study. Finally, efforts are put on the broadband noise modelling and prediction based on the experimental and numerical results.
A multi-vortex system with an intense tip-leakage vortex is observed in the experiment. The various analyses of the flow characteristics show a good agreement between the experi-ment and the ZLES in the blade tip region. The zonal (RANS-LES) approach proves itself to be a powerful tool to provide a detailed description of the tip-leakage flow, with a limited computational cost. However, the RANS and URANS computations globally over-estimate the diffusion of the tip-leakage vortex. Furthermore, the random oscillation of the tip-leakage vortex is investigated using PIV instantaneous flow fields and the wandering amplitude is evaluated. The dynamic response of the tip-leakage vortex is also studied with URANS at selected frequencies.
Two far-field noise prediction models, corresponding to two different acoustic sources, are reformulated and implemented with the near-field data from the numerical simulations. These predictions are compared to the far-field measurements. Using the ZLES data as input, the blade-tip self-noise model is found to over-estimate the noise generated in the blade-tip region. The trailing-edge noise model is implemented with the time-averaged ZLES and the RANS near-field data, and yields a very good prediction within a broad range of frequency.
Keywords: tip-leakage flow, zonal large-eddy simulation, Reynolds-averaged Navier-Stokes, vortex wandering, far-field noise modelling
List of figures xi
List of tables xiii
Nomenclature xv
1 Introduction 1
1.1 Background . . . 1
1.2 Motivations and objectives . . . 2
1.3 Thesis outline . . . 3
2 Review of research on tip-leakage flow 5 2.1 Review of aerodynamic research on tip-leakage flow . . . 5
2.1.1 Tip-leakage flow modelling . . . 6
2.1.2 Experimental research . . . 9
2.1.3 Numerical research . . . 15
2.2 Review of aeroacoustic research on tip-leakage flow . . . 25
2.2.1 Experimental research . . . 25
2.2.2 Noise prediction methods . . . 27
2.3 Conclusions . . . 28
3 Experimental and numerical methods 29 3.1 Configuration of the tip-leakage flow experiment . . . 29
3.2 Coordinate system . . . 31
3.3 Measurement technologies and experimental database . . . 31
3.3.1 Velocity measurements . . . 31
3.3.2 Pressure measurements . . . 36
3.4 Numerical methods . . . 36
3.4.2 RANS/URANS . . . 42
4 Mean aerodynamics of the tip-leakage flow 47 4.1 Inflow conditions . . . 47
4.1.1 Mean velocity profile . . . 48
4.1.2 Turbulent fluctuations . . . 49
4.2 Post-processing strategy . . . 50
4.3 Mean aerodynamics of the tip-leakage flow . . . 52
4.3.1 Blade surface static pressure coefficient . . . 52
4.3.2 Tip-leakage vortex . . . 53
4.3.3 Mean velocity field . . . 64
4.4 Conclusions . . . 78
5 Turbulent characteristics of the tip-leakage flow 81 5.1 Instantaneous tip-leakage vortex visualization . . . 81
5.2 Reynolds stresses . . . 82
5.3 Near-field energy spectrum . . . 84
5.4 Space-time correlations . . . 91
5.4.1 Space-time correlations in the experiment . . . 91
5.4.2 Space-time correlations in the ZLES . . . 94
5.5 Tip-leakage vortex wandering . . . 100
5.5.1 Tip-leakage vortex wandering in the experiment . . . 100
5.5.2 Tip-leakage vortex wandering in the ZLES . . . 103
5.6 An exploration of vortex wandering using URANS . . . 104
5.6.1 Effects of grid coarsening . . . 104
5.6.2 URANS convergence . . . 105
5.6.3 Vortex wandering amplitude . . . 105
5.6.4 Discussion . . . 108
5.7 Conclusions . . . 109
6 Far-Field Noise Prediction 111 6.1 Blade-Tip Self-Noise Model . . . 111
6.2 Tip noise modelling from near-field ZLES data . . . 116
6.2.1 Damping factor α . . . 117
6.2.2 Wall pressure spectrum Φpp . . . 118
6.2.3 Spanwise coherence length ly . . . 121
6.2.5 Far-field noise prediction with ZLES data . . . 125
6.2.6 Sensitivity of the blade-tip self-noise model . . . 126
6.3 Trailing-edge noise model . . . 127
6.4 TE noise modelling from near-field ZLES and RANS data . . . 128
6.4.1 Wall pressure spectrum Φpp . . . 129
6.4.2 Far-field noise prediction with ZLES and RANS data . . . 130
6.5 Combined noise (TE+Tip) modelling from near-field ZLES data . . . 132
6.6 Conclusions . . . 133
7 Conclusions and perspectives 135 7.1 Conclusions . . . 135
7.2 Perspectives . . . 137
Appendix A Blade-tip self-noise model - integration of ΣY 139
Appendix B Trailing-edge noise model 141
Appendix C Published papers 143
1.1 Tip clearance in turbomachines. . . 1
2.1 Rains’s tip-leakage flow model [92]. . . 7
2.2 Idea used in Chen et al.’s model [27]: the evolution of the tip-leakage flow is treated as an unsteady process in the successive crossflow planes. . . 9
2.3 Wall pressure (Cp) distributions with tip clearance of 0% (left), 0.8% (middle) and 1.35% (right) chord, observed in Storer and Cumpsty’s experiment [102]. 11 2.4 Three-vortex structure, observed in Kang and Hirsch’s experiment [67]. . . 12
2.5 Tip-leakage flow structure at design point, observed in Inoue and Furukawa’s RANS computation [56]. . . 14
2.6 Tip-leakage flow structure near stall, observed in Furukawa and Inoue’s RANS computation [44]. . . 17
2.7 Tip-leakage vortex and leakage streamlines at (a) peak efficiency condition (b) near stall condition, observed in Wu and Chu’s RANS computation [111]. 18 2.8 Multi-vortex structure, observed in You et al.’s LES computation [114]. . . 20
2.9 Generation and evolution of the end-wall vortical structures, observed in You et al.’s LES computation [115]. . . 21
2.10 Tip-leakage flow and vortex for three different gap sizes, observed in You et al.’s LES computation [113]. . . 22
2.11 Energy spectra of the pitchwise velocity fluctuations in the blade wake, observed in You et al.’s LES computation [115]. . . 23
2.12 Flow structures for a clearance of (a) 2% chord (b) 10% chord, observed in Decaix et al.’s LES computations [33]. . . 24
3.1 Experimental set-up. . . 30
3.2 Coordinate system. . . 31
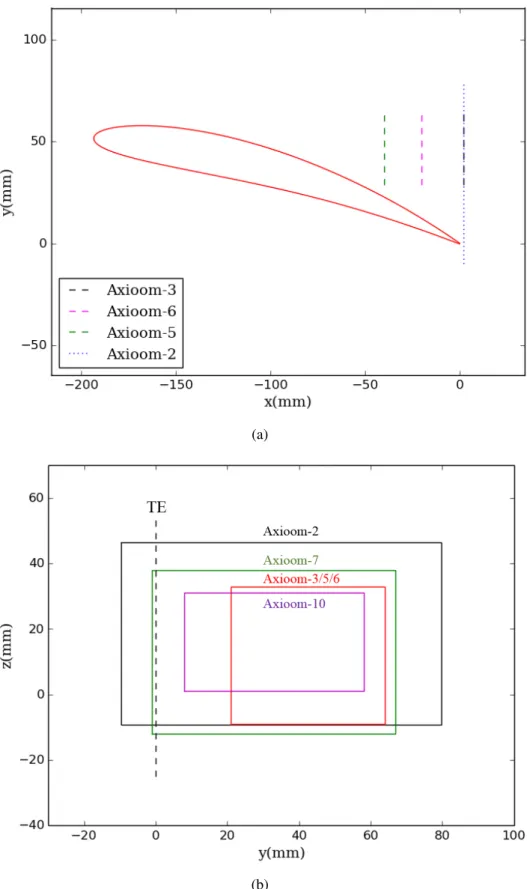
3.4 Positions and dimensions of the PIV measurement planes (a) x − y view (b)
y− z view. . . 34
3.5 Set-up for the 2D-3C TR PIV measurements (view from top). . . 35
3.6 Effective AOA. . . 37
3.7 LES and RANS zones in the blade tip region (x − y view at z = 0.5h). . . . 38
3.8 Global view of the ZLES computational domain. . . 40
3.9 Detailed views of the ZLES mesh at (a) leading edge (b) trailing edge, with
every two points plotted . . . 41
3.10 Global view of the RANS/URANS computational domain. . . 43
3.11 Detailed views of the RANS/URANS mesh at (a) leading edge (b) trailing
edge. . . 44
4.1 Mean velocity profiles inside the incoming boundary layer at 1.5c, 1.0c and
0.5c upstream of the leading edge. . . 48
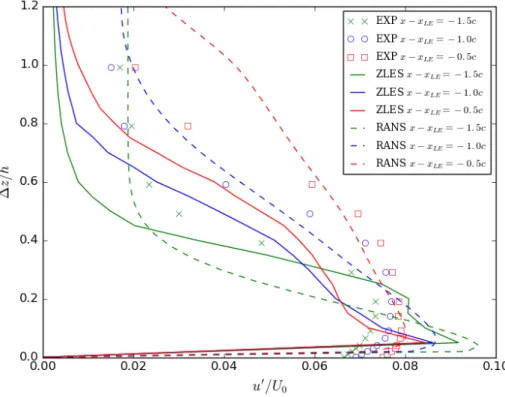
4.2 Turbulent fluctuations inside the incoming boundary layer at 1.5c, 1.0c and
0.5c upstream of the leading edge. . . 49
4.3 Two coordinate systems . . . 51
4.4 Comparison between the corrected results (rotated plane) and uncorrected
results from the simulations, with respect to experimental data. . . 52
4.5 Mean pressure coefficient Cpat mid-span and close to the blade-tip. . . 53
4.6 Mean vortex system at 2mm downstream of the trailing edge, based on the
function Γ2. View from downstream. (a) PIV (b) ZLES (c) RANS. The black
dashed line indicates the position of the airfoil trailing edge. . . 56
4.7 Circulation of the TLV as a function of the integration radius, for three
different PIV measurements. . . 57
4.8 Γ2 of the time-averaged flow field, 2mm downstream of the trailing edge,
from the experiment.
(a) AXIOOM-2 (large window 2C-PIV) (b) AXIOOM-3 (small window 2C-PIV) (c) AXIOOM-7 (small window 3C-PIV) (d) AXIOOM-10 (small
window 3C-PIV) . . . 58
4.9 Γ1of the time-averaged flow field, 2mm downstream of the trailing edge.
(a) 2C-PIV AXIOOM-2 (b) 2C-PIV AXIOOM-3 (c) 3C-PIV AXIOOM-7
(d) 3C-PIV AXIOOM-10 (e) ZLES (f) RANS . . . 60
4.10 Solid and dashed lines: iso-contours of Γ1(positive and negative values,
re-spectively), dotted line: iso-contour Γ2= 2/π, background: circumferential
velocity levels, 2mm downstream of the trailing edge.
4.11 Tip-leakage vortex trajectory . . . 62
4.12 K in Chen’s model, calculated from ZLES data. . . 63
4.13 Γ1 of the time-averaged flow field with different integration domains, for
2C-PIV AXIOOM-2.
Integration box: (a) 3 × 3 (b) 5 × 5 (c) 7 × 7 (d) 9 × 9 (e) 11 × 11 (f) 13 × 13 65
4.14 Γ2 of the time-averaged flow field with different integration domains, for
2C-PIV AXIOOM-2.
Integration box: (a) 3 × 3 (b) 5 × 5 (c) 7 × 7 (d) 9 × 9 (e) 11 × 11 (f) 13 × 13 66
4.15 Mean streamwise velocity field U at x =2mm.
(a) Experiment (b) ZLES (c) RANS . . . 67
4.16 Mean horizontal velocity fields V.
From left to right: PIV, ZLES, RANS. From top to bottom: x = −40mm,
x= −20mm, x = 2mm. . . 69
4.17 Mean vertical velocity fields W.
From left to right: PIV, ZLES, RANS. From top to bottom: x = −40mm,
x= −20mm, x = 2mm. . . 70
4.18 Solid and dashed lines: iso-contours of Γ1(positive and negative values,
re-spectively), dotted line: iso-contour Γ2= 2/π, background: circumferential
velocity levels.
From left to right: PIV, ZLES, RANS. From top to bottom: x = −40mm,
x= −20mm, x = 2mm. . . 71
4.19 Velocity profile comparison, z = −5mm.
(a)(c)(e) x = −20mm (b)(d)(f) x = 2mm . . . 73
4.20 Velocity profile comparison, z = 0mm.
(a)(c)(e) x = −20mm (b)(d)(f) x = 2mm . . . 74
4.21 Velocity profile comparison, z = 10mm.
(a)(c)(e) x = −20mm (b)(d)(f) x = 2mm . . . 75
4.22 Velocity profile comparison, z = 20mm.
(a)(c)(e) x = −20mm (b)(d)(f) x = 2mm . . . 76
4.23 Velocity profile comparison, z = 30mm.
(a)(c)(e) x = −20mm (b)(d)(f) x = 2mm . . . 77
5.1 3D instantaneous view of the ZLES simulation. Iso-surface of Q-criterion,
5.2 PIV instantaneous flow fields at x = 2mm. The background is coloured
by the normalized circumferential velocity magnitude√V2+W2/U
0in the
plane. The arrows represent the 2D instantaneous velocity vectors. From left to right and from top to bottom: t, t + ∆t, t + 2∆t, t + 3∆t, t + 4∆t, t + 5∆t,
with ∆t =0.33ms. . . 83
5.3 Normalized normal Reynolds stresses at x = −20 mm. The arrows represent
the 2D mean velocity vectors. Left: PIV, right: ZLES, top to bottom: u′u′/U02, v′v′/U02, w′w′/U02 . . . 85
5.4 Normalized shear Reynolds stresses at x = −20 mm. The arrows represent
the 2D mean velocity vectors. Left: PIV, right: ZLES, top to bottom: u′v′/U02, u′w′/U02, v′w′/U02 . . . 86
5.5 Normalized normal Reynolds stresses at x = 2 mm. The arrows represent the
2D mean velocity vectors. Left: PIV, right: ZLES, top to bottom: u′u′/U02,
v′v′/U02, w′w′/U02 . . . 87
5.6 Normalized shear Reynolds stresses at x = 2 mm. The arrows represent the
2D mean velocity vectors. Left: PIV, right: ZLES, top to bottom: u′v′/U02,
u′w′/U02, v′w′/U02 . . . 88
5.7 Probe locations and corresponding pressure (B, 21, 46) and velocity (102,
106) power spectral densities. . . 90
5.8 Locations of the LDV measurement points at x =2mm. . . 91
5.9 Velocity spectra obtained from LDV (solid line) and 2D-2C PIV
measure-ments (dashed line) at x =2mm. Left: PIV AXIOOM-2, 3000Hz, right: PIV
AXIOOM-3, 7000Hz . . . 92
5.10 Statistical error for the space-time velocity correlations at the vortex center.
(a) Rww(b) Ruu . . . 93
5.11 Two-point two-time correlation map for the spanwise velocity fluctuations
Rww, for a point (·) located at the vortex center (x). PIV AXIOOM-10. From
left to right and top to bottom: τ = 0, ∆tPIV, 2∆tPIV, 3∆tPIV, 5∆tPIV, 7∆tPIV, 10∆tPIV, 15∆tPIV, 20∆tPIV. 95
5.12 Two-point two-time correlation map for the streamwise velocity fluctuations
Ruu, for a point (·) located at the vortex center (x). PIV AXIOOM-10. From
left to right: τ = 0, ∆tPIV, 2∆tPIV. . . 96
5.13 Two-point two-time correlation map for the spanwise velocity fluctuations
Rww, for a point (·) located 3.5 mm left of the vortex centre (x). PIV
5.14 Two-point two-time correlation map for the streamwise velocity fluctuations
Ruu, for a point (·) located 3.5 mm left of the vortex centre (x). PIV
AXIOOM-10. From left to right and top to bottom: τ = 0, ∆tPIV, 2∆tPIV, 5∆tPIV, 10∆tPIV, 15∆tPIV. 97
5.15 Two-point two-time correlation map for the spanwise velocity fluctuations
Rww, for a point (·) located at the vortex center (x). ZLES results. From left
to right and top to bottom: τ = 0, ∆tZLES, 2∆tZLES. . . 98
5.16 Two-point two-time correlation map for the streamwise velocity fluctuations
Ruu, for a point (·) located at the vortex center (x). ZLES results. From left
to right and top to bottom: τ = 0, ∆tZLES, 2∆tZLES. . . 98
5.17 Two-point two-time correlation map for the spanwise velocity fluctuations
Rww, for a point (·) located 3.5 mm left of the vortex centre (x). ZLES results.
From left to right and top to bottom: τ = 0, ∆tZLES, 2∆tZLES. . . 99
5.18 Two-point two-time correlation map for the streamwise velocity fluctuations
Ruu, for a point (·) located 3.5 mm left of the vortex centre (x). ZLES results.
From left to right and top to bottom: τ = 0, ∆tZLES, 2∆tZLES. . . 99
5.19 Probability density function (PDF) of the tip-leakage vortex centre
distribu-tion at x =2mm, PIV AXIOOM-2. . . 101
5.20 Evolution of the half vortex wandering amplitudes σyand σz, with different
integration domain sizes, PIV AXIOOM-2. . . 102
5.21 Probability density function (PDF) of the tip-leakage vortex centre
distribu-tion at x =2mm, ZLES. . . 103
5.22 Comparison of Γ1and Γ2between RANS (left) and time-averaged URANS
(right) results, 2mm downstream of the trailing edge. . . 106
5.23 Comparison of velocity components U , V and W between RANS (left) and
time-averaged URANS (right) results, 2mm downstream of the trailing edge. 107
5.24 Transverse velocity time histories close to the blade tip - trailing edge corner,
from URANS computations. . . 108
6.1 Coordinate system for the blade-tip self-noise model [80]. . . 112
6.2 Numerical probes on the suction surface. . . 117
6.3 PSD of wall pressure at probes 29 (y = 1.5mm), 28 (y = 3mm) and 27
(y = 6mm). . . 119
6.4 Original and modelled PSD of wall pressure [50], blue lines: original EXP
results; red lines: modelled EXP results (Eq.6.30). . . 120
6.5 Original and modelled PSD of wall pressure, solid lines: original ZLES
results; dashed lines: modelled ZLES results; dot-dashed line: modelled
6.6 Original and modelled coherence function γ2, solid lines: original ZLES results; dashed lines: modelled ZLES results; dot-dashed line: modelled
EXP results for η = 1.5mm. . . 121
6.7 Comparison of coherence length ly between ZLES and EXP, for different
values of K2. . . 123
6.8 Original and modelled convection velocity Uc, solid blue line: original
ZLES results; dashed blue line: modelled ZLES results; dot-dashed red line:
modelled EXP results. . . 125
6.9 Power spectral density of the far-field pressure. . . 126
6.10 The sensitivity of the blade-tip self-noise model to α, Uc, Φpp and ly. “+”
denotes +10% and “−” denotes −10% to each individual input parameter. . 127
6.11 Power spectral density of the far-field pressure. . . 131
6.12 Power spectral density of the far-field pressure. . . 132
3.1 Details of the 2D-2C TR PIV database. . . 33
3.2 Details of the 2D-3C TR PIV database. . . 35
5.1 Half vortex wandering amplitudes in y and z directions. . . 100
5.2 Vortex wandering amplitudes in y and z directions. . . 100
5.3 Half vortex wandering amplitudes with different integration domain sizes, PIV AXIOOM-2. . . 102
5.4 Half vortex-wandering amplitudes in y and z directions, ZLES & PIV AXIOOM-2. . . 104
5.5 Vortex-wandering amplitudes in y and z directions, ZLES & PIV AXIOOM-2.104 5.6 Calculated vortex wandering amplitudes for PIV and URANS. . . 108
Roman Symbols
Si j filtered rate-of-strain tensor
c blade chord
Cp mean pressure coefficient
h clearance height
k turbulence kinetic energy
M Mach number
Re Reynolds number
Rec chord-based Reynolds number
Tu turbulent intensity
U streamwise velocity component (x direction)
u′ streamwise velocity fluctuation (x direction)
U0 free-stream velocity
V horizontal velocity component (y direction)
v′ horizontal velocity fluctuation (y direction)
W vertical velocity component (z direction)
w′ vertical velocity fluctuation (z direction)
xLE leading edge streamwise coordinate
y normal coordinate
z spanwise coordiante
Greek Symbols
β zonal parameter in ZLES
Γ1 vortex center detection function
Γ2 vortex core detection function
ν molecular viscosity
νt turbulent eddy viscosity
νmod eddy viscosity in ZLES
νsgs subgrid-scale eddy viscosity
ψ angle betzeen coordinate systems (x, y, z) and (x′, y′, z′)
σy half vortex wandering amplitude in the horizontal direction
σz half vortex wandering amplitude in the vertical direction
Acoustic Models
α damping factor
k normalized acoustic wavenumber
Φpp wall pressure spectrum
b half chord c blade chord c0 sound speed e blade thickness h clearance height k acoustic wavenumber
K1 streamwise wavenumber
K2 spanwise wavenumber
L double blade span for blade-tip self-noise model, blade span for trailing-edge noise
model
ly spanwise correlation length
M Mach number
U0 incident mean flow speed
Uc convection velocity
X normalized streamwise coordinate
x streamwise coordinate
x1 observer coordinate in x direction
x2 observer coordinate in y direction
x3 observer coordinate in z direction
Y normalized normal coordinate
y normal coordinate
Z normalized spanwise coordiante
z spanwise coordiante
Acronyms / Abbreviations
2D-2C TR PIV Two-Dimensional Two-Component time-resolved Particle image velocime-try
2D-3C TR PIV Two-Dimensional Three-Component time-resolved Particle image velocime-try
AOA angle of attack
CFD computational fluid dynamics
HWA Hot-Wire Anemometers LDV Laser Doppler Velocimetry
LE leading edge
LES large eddy simulation
PIV Particle Image Velocimetry
PSD pressure spectral density
RANS Reynolds-averaged Navier-Stokes SISM shear-improved Smagorinsky model
TE trailing edge
TLV tip-leakage vortex
URANS unsteady Reynolds-averaged Navier-Stokes ZLES zonal large eddy simulation
Introduction
1.1
Background
In turbomachines like compressors and turbines, the clearance between a rotor and its
surrounding casing is necessary for the operation, as shown in Fig.1.1. The clearance is
quite small, typically about one percent of the blade span for compressors and less than one
percent for the turbines [81]. However, the relative motion between the blade tip and the
end-wall, and the pressure difference across the blade, create a tip-leakage flow, and this flow eventually rolls up, forming a tip-leakage vortex.
The tip-leakage flow is extremely complex for its three-dimensional unsteady nature. Both viscid and inviscid interactions occur between the tip-leakage flow, other secondary flows and the boundary layers on both the blade and the end-wall. In a multistage turbomachine, the flow structures formed from the tip clearance not only influence the adjacent blades of the same stage, but also convect to the downstream blade rows and interact with the downstream flow features, making it even more complex.
The tip-leakage flow has been a subject of interest in turbomachinery and aeroacoustic
research for a long time [25]. It has been shown from these studies that the unsteady
tip-leakage flow has a large effect on the performance of the machine. For the aerodynamic part, it influences blade loading, stage efficiency, heat transfer and stall margin. While for the acoustic part, it has been recognized as an important source of noise. furthermore, recent studies have shown that the tip-leakage vortex can develop large-scale oscillations, referred to as “vortex wandering”, which can also contribute to the noise emissions.
1.2
Motivations and objectives
Funded by the European Community as part of the Sixth Framework Project PROBAND
n◦AST4-CT-2005-012222, a successful research campaign on the tip-leakage flow has been
carried out at Laboratoire de Mécanique des Fluides et d’Acoustique (LMFA), and numerous remarkable results have been achieved:
1. An experiment about the tip-leakage flow past a single non-rotating airfoil has been
conducted under low Mach number condition [59]. Through velocity and pressure
measurements in the near and far field, an extensive data set has been obtained. 2. A RANS computation on the same configuration as the experiment has been performed,
providing a numerical database for the broadband noise modelling [17].
3. A detailed wavelet analysis of wall pressure and velocity measured in the experiment
has been performed [23].
4. A new trailing-edge noise model has been developed [85, 93]. This model is an
extension of Amiet’s trailing-edge noise model [2,3] by taking into account the effects
due to the limited chord length. It makes it possible to infer the far-field radiation off the mid-span plane.
5. A method to predict the fan blade trailing-edge noise using RANS simulations has
been proposed by Rozenberg et al. [94,96], based on the new trailing-edge noise
6. An empirical model of wall pressure spectra, considering the adverse pressure gradient
effects, has been developed [95].
7. A new tip-clearance noise model has been developed by extending Amiet’s
trailing-edge noise model to the blade tip region [50]. It has been compared with the
experi-mental data.
In 2012-2016, a new research campaign on the tip-leakage flow has been carried-out, in the frame of the Sino-French project AXIOOM and the present PhD. The PROBAND configuration has been investigated again with a thinner incoming boundary layer and more advanced measurement technologies. At the same time, a zonal LES simulation has been performed. As a part of the project AXIOOM, the objectives of the current research include:
1. to evaluate the capabilities of new advanced measurement technologies;
2. to evaluate the capabilities of zonal LES (ZLES), providing a direct description of the largest turbulent eddies in the region of interest at the blade-tip;
3. to exploit the advanced experimental and numerical description of the flow, for an in-depth analysis of the tip-leakage vortex dynamics and associated noise emissions; 4. to implement and evaluate the far-field noise prediction models with experimental and
numerical near-field data.
1.3
Thesis outline
Chapter 2 reviews previous works on tip-leakage flow, for both the aerodynamics and the aeroacoustics.
In Chapter 3, the flow configuration considered in both the experiment and the numerical simulations is introduced. Then the measurement technologies and the experimental database are presented. Finally, the numerical methods are introduced, including the ZLES and (U)RANS approaches, the meshes, the turbulence/subgridscale modelings, the boundary conditions, etc.
Chapter 4 concerns the mean aerodynamics of the tip-leakage flow. The time-averaged ZLES results and the RANS results are analyzed in comparison with the experimental results.
The turbulent characteristics of the tip-leakage flow are analyzed in Chapter 5, using the ZLES, the URANS and the experimental results.
In Chapter 6, the blade-tip self-noise model and the trailing-edge noise model are reformulated and implemented with the experimental, the RANS and the ZLES near-field data.
Review of research on tip-leakage flow
In this chapter, some previous works on tip-leakage flow will be reviewed. These works are classified by the aerodynamic research and the aeroacoustic research. The review of aerodynamic research put emphasis on tip-leakage flow modelling, experimental research and numerical research. And the review of aeroacoustic research put emphasis on experimental research and noise prediction methods.
2.1
Review of aerodynamic research on tip-leakage flow
At early stages of the research on tip-leakage flow, the modelling and the experience are the main research approaches, because of the lag in the computational capabilities. For the modelling, most of the tip-leakage flow models are dedicated to predict the overall efficiency loss due to the tip clearance and others can even predict some detailed flow features. However, these models can hardly be identified as universal, since they are all deduced on specific assumptions and the parameters used are semi-empirical, which makes them not very reliable during the turbomachinery design. The experiment becomes more and more popular among the tip-leakage flow researchers since 1980s. The rapid development of the experimental measurement technology, for example, from Hot-wire anemometers (HWA) to Laser Doppler velocimetry (LDV) and Particle image velocimetry (PIV), makes it possible to extract more information in the flow field with better accuracy. The experimental researches on tip-leakage flow mainly focus on linear and annular cascades, isolated and multistage axial rotors. Compared with the modelling, the experiment overcomes the restriction of various assumptions used in the models, but it is sometimes not feasible for some complex problems. There is still some working conditions that the experimental technology can not reach for the moment. However, the repeatability of the experiment makes it extremely suitable for the parametric analysis. The numerical simulation by solving the 3D Navier-Stokes
equations is more and more widely used since the late 1990s, thanks to the development of the computational capabilities. The numerical method based on Reynolds-averaged Navier-Stokes equations (RANS) has been accepted as a powerful tool for some industrial purposes, such as the turbomachinery design. In recent years, some researchers employ the large-eddy simulation (LES) to investigate the tip-leakage flow and obtain more detailed spatial and temporal information within a wider range of turbulence scales than RANS. Compared with the experiment, the numerical simulation is theoretically easier to solve a complex problem. And the flow field information is complete and available for some further processing and analysis. The disadvantage of the numerical simulation is also obvious: the computational cost is generally proportional to the amount of the resolved flow field information, which makes it sometimes “expensive” to resolve a flow field with satisfactory accuracy. Some researchers also use a combination of the three methods mentioned above, such as modelling/experiment and experiment/simulation.
Following is a review of the previous tip-leakage research, with emphasis on tip-leakage flow modelling, experimental research and numerical research, respectively.
2.1.1
Tip-leakage flow modelling
The first widely accepted tip-leakage flow model should be the one proposed by Rains
[92]. Rains finds that the pressure difference across the blade tip is dominant compared with
the pressure gradient along the blade chord on both surfaces. The gap exit jet flow could be
considered as a simple mixing of two flows, as shown in Fig.2.1: one is the jet driven by the
dominant pressure difference across the blade tip, in the direction normal to the blade camber line. Given the pressure difference across the blade tip, the jet velocity could be calculated by the Bernoulli’s principle. The kinetic energy of this jet will be subsequently dissipated through mixing, which results in the overall efficiency loss due to the tip clearance. The other flow is the original longitudinal inlet flow. Rains assumes that the viscous effect could be neglected during the formation of the tip-leakage flow, so that the longitudinal momentum component is conserved through the gap. Note that Rains’s model has nothing to do with the spanwise direction, so it is actually a 2D analytical model. This model can predict the mean exit jet velocity and the mass flow rate of the tip-leakage flow. However, the loss due to the tip clearance is somewhat under-estimated, which is probably because this model ignores the flow perturbations due to the presence of the tip-leakage vortex when calculating the overall loss. And this model provides no information on the essential details of the passage flow field. Despite the defect in many aspects, Rains’s model opened the gate of the tip-leakage flow modelling.
Fig. 2.1 Rains’s tip-leakage flow model [92].
Another early attemp to predict the effects of the tip clearance in turbomachines is made
by Lakshminarayana and Horlock in their successive researches [72,73] . They are inspired
by Betz’s earlier research [14], which considers the velocities induced at the lifting line by
the bound vortices shed all along the blade span, and proposes a potential vortex model based on the lifting line theory. It is assumed in this model that the lift is uniform all along the span, and the boundary condition at the end-wall is satisfied by the use of image vortices. At the blade tip region, a part of the bound vortex is shed off into the tip-leakage vortex, and the rest is retained inside the tip region. The model introduces a factor to express the percentage of the bound vorticity retained inside the tip region. This factor is determined empirically through some experimental data, and is formulated as a function of the clearance-to-chord ratio. The potential vortex model is only dedicated to predict the overall effects of the tip clearance, such as the efficiency loss and induced drag, and is inadequate to describe the detailed flow, such as the exit jet flow angle. The detailed flow pattern observed in the experiment, with a loss core in the clearance region, does not resemble to what the potential vortex model describes: the shed vortex is assumed to be distributed uniformly across the passage and sinusoidally across the wall boundary layer. So Lakshminarayana
developed a new theoretical model [71] based on many flow visualizations and vorticity
measurements to predict the blade-to-blade flow details. According to this new model, the tip-leakage flow produces shear layers which roll up into a spiral to form a core of rotating fluid, which is validated by many experimental observations. Some important parameters in
the model, for example, the radius, the angular rotation and the location of the vortex core, are determined from Rains’s theory. Lakshminarayana’s models predict the effects of tip clearance with acceptable accuracy in many cases. However, a major drawback of this model is its semi-empirical nature. The empirical relationships involved in the model makes it not universal.
Although more and more researchers chose to use experiment and numerical simulation to investigate the tip-leakage flow since the late decades of last century, the attempt of improving old models or developing new models of the tip-leakage flow never stoped. Chen
et al. [27] were probably the first ones to model the evolution of the tip-leakage vortex.
Following the same idea as Rains: the pressure difference across the blade tip is much larger than the pressure gradient along the blade chord, Chen et al. decompose the tip clearance velocity field into independent throughflow and crossflow. As for the slender bodies in external aerodynamics, the 3D steady flow field of interest could be reconstructed from the point of view of a 2D unsteady flow, because the translation along the streamwise direction is analogous to moving in time. In this way, the evolution of the tip-leakage flow could be treated as an unsteady process in the successive crossflow planes which are normal to the
blade camber, as shown in Fig.2.2. The fluid during the evolution of the tip-leakage flow
is taken as inviscid, so there is a conservation of momentum of the throughflow at each crossflow plan. As for the crossflow, a similarity scaling is employed and a generalized tip-leakage vortex trajectory is obtained. Chen et al. find that this generalized tip-leakage vortex trajectory is almost a straight line and the tip clearance does not affect the trajectory of the vortex core in the blade passage. This result agrees very well with a wide range of experimental data, which implies that the behaviour of the tip-leakage flow is essentially inviscid and is dominated by the vortical structure.
Nikolos et al. [89] examined the basic theoretical models and proposed some
modifi-cations to Rains’s gap flow model and Lakshminarayana’s vortex model. For Rains’s gap flow model, Nikolos et al. add a simple modelling of the loss production mechanism inside the gap by using different velocity profiles at the gap exit, which ensures a more accurate prediction of the overall loss due to the tip clearance and the gap exit jet velocity. For Lakshminarayana’s vortex model, Nikolos et al. deny the validity of the retained lift theory used in Lakshminarayana’s model and propose a new way to describe the process of the rolling-up of the jet issued from the gap. Incorporated with a modelled vorticity diffusion, the new model predicts well the shed out vorticity and the total pressure loss. In addition to the new models, Nikolos et al. conclude that the key factor for both the shed vorticity and the mechanics of the tip-leakage vortex formation is the mass flow rate through the tip gap. The mass flow rate through the tip gap is affected not only by the tip gap size and the pressure
Fig. 2.2 Idea used in Chen et al.’s model [27]: the evolution of the tip-leakage flow is treated as an unsteady process in the successive crossflow planes.
difference across the blade tip, but also by the relative motion of the end-wall. However, neither of the models mentioned above consider the relative wall motion. So Nikolos et al.
investigated the relative wall motion effects on tip-leakage flow in a later research paper [88].
The previous basic gap flow model without wall motion is extended and a new theoretical model is deduced to predict the relative wall motion effects on the mass flow rate through the tip gap for compressors and turbines respectively. The relative wall motion increases the strength of the tip-leakage vortex for a compressor and decreases it for a turbine. For both cases, the effect of the relative wall motion extends over almost the whole gap height, and the vortex center is moving towards the direction of the wall motion. However, the effect seems relatively larger for the turbine, because the pressure driven flow and the moving wall driven flow have opposite directions in the turbine. In addition, Nikolos et al. draw the same conclusion as Chen: the tip clearance size has little effect on the trajectory of the tip-leakage vortex core in the blade passage.
2.1.2
Experimental research
Most of the early basic experimental research on the tip-leakage flow is restricted to cascades, since they have lower requirements for the measurement technology. Storer and
Cumpsty [102] investigated the tip-leakage flow in a linear compressor cascade comprising
five blades with stationary walls, focusing on the blade surface pressure distribution, tip gap exit flow field and the loss due to the clearance. The cascade inlet velocity is 24 m/s,
corresponding to a Mach number of 0.03. The chord based Reynolds number is 5 × 10⁵.
The tip gap is adjusted to 2% and 4% chord, compared with the no clearance case. The measurements are conducted using pressure tappings and five-hole probes. Results show that for a typical compressor-type blade, the tip-leakage flow separates from the blade tip and does not reattach along the majority of the chord. The trajectory of the tip-leakage vortex coincides with a trough of pressure measured on the end-wall. The origin of the trough is close to the lowest pressure contour on the end-wall, which is located close the blade tip. With the increase of the tip gap, the position of the minimum pressure on the end-wall moves progressively downstream of the leading edge: it is located at about 25% chord from the leading edge for a 2% chord tip gap, and moves to near 42% chord for a 4% chord tip gap. From this point of view, the size of tip gap does have an influence on the tip-leakage vortex trajectory. The pressure measurements reveal that the pressure distribution
at the blade tip, as shown in Fig.2.3, is different from that at the mid-span, and the blade
loading is smaller at the blade tip. The tip clearance vortex substantially alters the static pressure field near the tip on the suction side, moving the minimum pressure back along the chord as the clearance is increased. The position of the vortex relative to the suction surface is very important in determining the pressure distribution near the blade tip and the blade force. As for the losses, a non-linear rise of total pressure loss is observed in spite of a linear relationship of the tip-leakage flow to clearance gap height. A very high loss is produced in a thin layer separating the two high-speed flows near the exit of the tip gap where intense shearing is caused by the difference in flow direction. Store and Cumpsty also performed a numerical simulation to explore the aspects of tip-leakage flow less accessible by the experiment alone. Despite a relatively coarse mesh, especially near the tip, and a rather unsophisticated turbulence modelling, the results agree well with the experiment on many aspects. The analysis led Store and Cumpsty to conclude that the tip-leakage flow is controlled by a primarily inviscid mechanism.
In Store and Cumpsty’s experiment, the ratio of blade thickness to clearance height is low, and the flow leaving the tip gap may not be fully mixed out. Things may be different for other typical compressor blades with higher ratio of blade thickness to clearance height,
such as the NACA 56 series profiles. Kang and Hirsch [67,68] conducted an experiment in a
Fig. 2.3 Wall pressure (Cp) distributions with tip clearance of 0% (left), 0.8% (middle) and
1.35% (right) chord, observed in Storer and Cumpsty’s experiment [102].
purpose of this research was to investigate the flow nature existing inside the clearance over the whole chord. The tip gap is adjusted to 1%, 2% and 3.3% chord, compared with the no
clearance case. The Reynolds number is about 3 × 10⁵based on the chord. Measurements
are conducted with five-hole probes inside and downstream of the blade passage. Surface flow visualizations are performed on the end-wall and the blade surface to reveal the flow patterns. In the experiment, Kang and Hirsch observe a three-vortex structure in the blade tip
region, as shown in Fig.2.4: A large tip-leakage vortex, which starts a little downstream of the
leading edge, grows in size along the chord and progressively dominates the end-wall region; A small tip separation vortex formed by the fluid close to the tip surface at the pressure side, diverging from about the middle of the blade profile. It has the same rotation sense as the tip-leakage vortex; A small secondary vortex, which rolls up at the suction side edge. It has an opposite rotation sense to the tip-leakage vortex. Contrary to Rains’s 2D model, the flow inside the tip gap is strongly three-dimensional almost over the whole chord length. For the small clearance cases, a weak horseshoe vortex is also observed to be formed from the blade leading edge. Kang and Hirsch conclude that the generation of the tip-leakage vortex results in the passage vortex moving close to the end-wall and to the suction side of the passage. The motion of the tip-leakage vortex arouses a strong reloading by which the leakage flow is reinforced. The size of the tip gap does have an effect on the tip-leakage vortex trajectory: the tip-leakage vortex deviates form the blade suction side with the increase of the tip gap. In
this experiment, the mixing process is found not fully completed at the gap exit, since the gap exit velocity shows a wakelike profile close to the tip.
Fig. 2.4 Three-vortex structure, observed in Kang and Hirsch’s experiment [67].
In recent years, a series of experiments [87, 104] have been carried out at Virginia
Polytechnic Institute and State University, for the purpose of understanding the structure of the vortex-dominated endwall flows found in aircraft engine fans and compressors. A compressor cascade with different tip gaps and with/without moving endwall was used to investigate the tip-leakage flow dynamics under different flow conditions. It was found that the tip-leakage vortex dynamics are dominated by the streamwise mean-velocity deficit it produces. Mean velocities associated with the deficit are more than twice as strong as those associated with the rotating motion and decay more slowly with downstream distance. Turbulent kinetic energy in the vortex is produced almost entirely by velocity gradients associated with the deficit. By comparing the flow fields with and without the moving endwall, it is found that, many critical features of the tip-leakage vortex are almost unaffected by the endwall motion: the vortex produces almost the same magnitude of the streamwise mean-velocity deficit, and the deficit still dominates both the mean velocity field and the production of turbulence. Thus, the moving endwall does not fundamentally alter the mechanisms that govern the development of mean tip-leakage flow and its turbulence
structure. Another experiment [58] conducted at Virginia Polytechnic Institute and State University concerns the initial formation of the tip-leakage vortex and the interaction between the vortex and inflow disturbances. The mechanism of the tip leakage vortex formation is found to be independent of the tip gap setting. The vortical structure is initially generated and attached to the blade tip, progressively picks up circulation shed from the blade tip and the endwall boundary layer, and finally moves across the passage resulting in a reduction in its rotational strength as the cross sectional area of the vortex increases, but little circulation is added. Inflow disturbances are found to cause small-scale responses and large-scale responses upstream and downstream of the vortex shedding location, respectively.
Compressor rotors
There are substantial differences in the structure of tip-leakage flow in the cascades and the rotors. The differences result not only from the moving end-wall, but also from the inlet boundary layer. Compared with the cascades, the flow field of the rotors is more complex and more similar to the real turbomachine, that’s why the compressor rotors attract more attention among tip-leakage flow researchers.
Inoue et al. [57] performed an experimental research on an isolated axial compressor
rotor of NACA 65 series profile. The purpose of the research is to investigate the clearance effect on the end-wall flow development and the behaviour of the tip-leakage flow. The tip gap is set from 0.5 mm (0.4% chord) to 5 mm (4.3% chord) by changing the radius of the casing. The flow rate is adjusted to yield the same incidence angle of the rotor blade at mid-span for different clearances, in order to get rid of the effect of incident variation caused by boundary layer blockage. The averaged phase-locked flow field inside the tip clearance and behind the rotor is measured by a constant temperature hot-wire anemometer and a periodic multisampling and averaging technique. Inoue et al. find that an increase of the clearance size reduces the efficiency, resulting in a decrease of the stage performance. When the tip clearance is small, the leakage jet flow interacts violently with the through flow near the leading edge, and a rolling-up tip-leakage vortex decays downstream. The circulation of the tip-leakage vortex increases with larger tip clearance, and the position of the rolling-up deviates from the blade suction side. Moreover, the intense vortex causes reverse flow in the axial direction near the casing wall.
Foley and Ivey [41] investigated the behaviour of the tip-leakage flow under the effects
of stator-rotor interactions. The experiment was conducted with a large-scale low-speed four-stage axial compressor, with a tip gap of 1.2% and 3% chord. Detailed measurements are performed upstream and downstream of the third stage rotor, as well as on the rotor blade surface, using pneumatic probe traverses, blade static pressure tappings and 3D laser
transit anemometry. At the rotor inlet, a two-dimensional flow region is observed from approximately 40% to 85% annulus span. Outside of this region, reduced total pressure is measured due to the leakage jet losses from the upstream stages and the three-dimensional end-wall effects. This reduced pressure results in a higher incidence angle at the rotor inlet close to the blade root and tip. At the blade tip, the peak suction pressure point is found to occur closer to the leading edge compared with the mid-span region. This is believed to be caused by fluid travelling radially up the suction surface as it is entrained into the leakage jet. At the rotor exit, the contours of the total pressure are generally pitchwise uniform due to the developing wall boundary layer and the mixed-out effects of the upstream rotor tip-leakage flows. The increase of the rotor tip clearance height is found to reduce the loading distribution at the blade tip.
Fig. 2.5 Tip-leakage flow structure at design point, observed in Inoue and Furukawa’s RANS
computation [56].
The blade tip region of the turbomachine rotors is extremely complex, because of the interaction between the tip-leakage flow and the boundary layers on both the end-wall and the blade surface. So various flow behaviours may occur here. Lakshminarayana et al.’s
vortex. The experiment is conducted with a compressor stage consisting of an inlet guide vane, a rotor row and a stator row. The blade section at the rotor tip is a NACA 65 series, and the average tip clearance is 2.27% chord. The inlet flow velocity is about 25.4 m/s and the boundary layer thickness on the casing is about 8% blade span. A rotating five-hole probe is employed to measure the flow field downstream of the rotor. Lakshminarayana observes that the tip-leakage jet emerging from the tip clearance is of high velocity and mixes quickly with the main stream, producing intense shearing and flow separation. The tip-leakage jet does not roll up into a vortex, probably because the inlet swirl, the high turbulence intensity and the high blade loading in this experiment cause an intense mixing of the tip-leakage jet before it has a chance to roll up into a discrete vortex. Lakshminarayana et al. conclude that the formation of the tip-leakage vortex depends on various parameters: in addition to the widely accepted ones, such as the tip clearance height, Reynolds number and blade loading, it may also depend on the configuration of the facility, inlet flow turbulence, annulus wall boundary layer thickness, velocity difference between the tip-leakage jet and the main stream, and blade speed.
Another specific phenomenon is observed in the experiment of Stauter [101]. Stauter
investigated the development of the tip-leakage flow in a two-stage axial compressor with a tip gap of about 1.25% chord. A two-color, five-beam LDV system is employed to simultaneously measure the three velocity components of the flow field inside the blade passage and downstream of the second stage rotor. The measurements are performed at 18 axial positions, from 42% to 130% chord, and five of them are reported in details. The clear evidence of the tip-leakage vortex roll-up could be observed through the vector plots at the axial positions of 42%, 63% and 115% chord. However, the tip-leakage vortex seems too weak to be captured at the axial positions of 90% and 130% chord. Stauter concludes that the strength of the tip-leakage vortex decays through the passage until aft of the trailing edge, at which point it starts increasing again, reaching a peak at 115% chord, after which, it starts decreasing again. Stauter does not provide an explanation of this phenomenon. This behaviour of the tip-leakage vortex is generally different from that observed in other experiments, and it has never been observed again by other researchers.
2.1.3
Numerical research
Reynolds-averaged Navier-Stokes equations (RANS)
Most of the numerical studies on the tip-leakage flow are based on Reynolds-averaged Navier-Stokes (RANS) simulations, since they have a moderate computational cost compared with experiments and other numerical methods. Inoue and Furukawa performed a series of numerical simulations to investigate the behaviour of the tip-leakage flow at design point
[56] and at near-stall conditions [44] of an isolated low-speed axial compressor rotor. The
configuration of this axial compressor rotor is the same as their previous experiment [57]
mentioned above. The blade is of NACA 65 series profile and the tip clearance is set to 1.7% chord. The flow field is simulated by the three-dimensional compressible Reynolds-averaged Navier-Stokes equations based on a high-resolution upwind scheme using the TVD formulation. The eddy viscosity is estimated by the algebraic turbulence model of Baldwin
and Lomax [10]. The computational domain consists of 518,144 cells and the grid spacing on
the solid walls is small enough (y+< 1) to describe the viscous sublayer. The inlet boundary
layer is given by the experimental results. The flow field is displayed and analysed in terms of vortex-core identification, helicity, flow topology, etc. At the design point of the compressor
rotor, a two-vortex structure is captured in the blade tip region, as shown in Fig.2.5: one large
tip-leakage vortex and one small tip separation vortex. The tip-leakage flow starts to roll up at a position a little downstream of the blade leading edge. The streamlines reveal that the vortex core is mainly composed of fluid particles formerly included in the shear layer and the fluid passing through the clearance coils around the vortex core. As for the vortex-lines, it is found that the vortex-lines in the suction surface boundary layer link to either the tip-leakage vortex core, either to the pressure surface boundary layer, or to the casing wall boundary layer, depending on the issuing position. Inoue and Furukawa also investigate the effects of the relative motion of the casing wall. It is found that the flow topology changes with the moving casing wall. In this configuration, the moving wall increases the circulation of the tip-leakage vortex and reduces the leakage flow losses, mainly due to lower friction losses. At the near-stall conditions, a tip-leakage vortex breakdown is observed inside the rotor passage
at a lower flow rate than the peak pressure rise operating condition, as shown in Fig.2.6. The
occurrence of the breakdown causes some significant changes in the nature of the vortex: the vortex core rapidly decelerates, followed by a bubble-like recirculation region. In the flow topology, a stagnation point is observed just in front of the recirculation region. The vortex breakdown leads to an expansion of the tip-leakage vortex, which has an extremely large blockage effect, resulting in a large loss region. Downstream of the breakdown region, a weak tip-leakage vortex rolls up, but decays and disappears rapidly. So there is no tip-leakage vortex observed downstream of the rotor. The same behaviour of the tip-leakage vortex is
observed by Wu and Chu [111] in an isolated hight-speed axial compressor rotor, as shown
in Fig.2.7. Wu and Chu also find that the tip-leakage vortex exerts little influence on the
Fig. 2.6 Tip-leakage flow structure near stall, observed in Furukawa and Inoue’s RANS
computation [44].
RANS resolves the steady mean flow field, so only the steady flow features can be captured and studied by RANS. There are still some unsteady flow phenomena related to the tip-leakage flow, such as the oscillation of the tip-leakage vortex, also referred to as
vortex wandering. Zhang et al. [116] investigated the tip-leakage flow unsteadiness in an
isolated axial compressor rotor by solving the unsteady Reynolds-averaged Navier-Stokes equations (URANS). The tip gap is set to 2%, 3.4% and 5% chord, compared with the no clearance case. A standard k − ε turbulence model and a non-equilibrium wall function are employed. Steady boundary conditions are imposed at both the inlet and the outlet of the computational domain. The unsteadiness of the tip-leakage flow is clearly revealed by the static pressure evolution in the blade passage. It is found that this unsteadiness only exists in the blade tip region and has its own frequency. Zhang et al. explain this periodic oscillation of the tip-leakage flow as a result of a dynamic balance between two counter-acting driving “forces”: one “force” is the aerodynamic loading of the blade, which results from the pressure difference across the blade; the other “force” is the unloading of the blade, which originates from the tip-leakage flow balancing the pressure difference. The unsteadiness begins to emerge when the originally static balance is broken and replaced by the dynamic balance. It is found that the trajectory of the tip-leakage vortex can be used as an indicator of the onset of the dynamic balance between the two “forces”: if these two “forces” are strong enough to push the tip-leakage vortex across the blade passage and stamp a low pressure spot on
(a)
(b)
Fig. 2.7 Tip-leakage vortex and leakage streamlines at (a) peak efficiency condition (b) near
the pressure side of the neighboring rotor blade, the static balance will be broken and the unsteady oscillation results.
Large-eddy simulation (LES)
Despite the progresses made with RANS approaches in the computational interpretation of the tip-leakage flow, the unsteady nature of the tip-leakage flow limits the applicability of RANS approaches in further investigations of the flow physics. In recent years, with increasing computing power, the large-eddy simulation (LES) technique, in which resolved and subgrid-scale motions are defined by a spatial filter applied to the Navier-Stokes equations,
has emerged as a promising tool to complement RANS computations [112].
You et al. performed a series of comprehensive analyses of the tip-leakage flow based on large-eddy simulation (LES) results, with emphasis on the effects of the tip gap size
[113], the mechanisms for viscous losses [114] and the unsteady characteristics [115], along
with the mean flow features. The flow configuration is a linear cascade with a moving end-wall. The tip gap is set to 1.53%, 3.06% and 6.11% of th axial chord. With the periodic boundary conditions used, only one single-blade passage is considered in the simulation. The computational mesh consists of more than 25 million cells. In wall units, the blade
surface resolution in the region of primary interest is within the range ∆x+ 6 50, ∆y+6 3
and ∆z+ 6 30. A Lagrangian dynamic subgrid-scale (SGS) model [83] is employed to
estimate the subgrid-scale eddy viscosity. The inlet boundary layer is generated by a separate LES of a turbulent boundary layer on a stationary flat plate. In the mean flow field, a
multi-vortex structure is observed in the end-wall region, as shown in Fig.2.8: a dominant
tip-leakage vortex, a tip-separation vortex and several small induced vortices with the same or opposite rotation sense as the tip-leakage vortex. These vortices are found to decay
continuously as they convect downstream, as shown in Fig.2.9. Inside the blade passage, the
trajectory of both the tip-leakage vortex and the tip-separation vortex is strongly affected by the moving end-wall. Downstream of the trailing edge, the tip-leakage vortex core is lifted from the end-wall, which is probably an effect of the moving end-wall, and since then its trajectory is mostly influenced by the main stream. The comparison of the Reynolds stresses reveals that the normal-stress components are always larger than the shear-stress
components throughout the cascades. Inside the blade passage, u′u′dominates among the
three normal-stress components, while they are of the same magnitude downstream of the trailing edge. The tip-leakage vortex and the tip-leakage jet are found to generate most of the turbulent kinetic energy in the end-wall region. In addition, the tip-leakage vortex is found to experience a pitchwise wandering motion, which is demonstrated by a peak in the energy
tip gap size, the strengths of the tip-leakage vortex and the induced vortex increase, while the
tip-separation vortex decreases, as shown in Fig.2.10. The trajectory of the tip-leakage vortex
also deviates from the blade suction surface with larger clearance. However, the mechanisms for the generation of vorticity and turbulent kinetic energy are mostly unchanged by the tip gap size variation.
(a)
(b)
(c)
Fig. 2.9 Generation and evolution of the end-wall vortical structures, observed in You et al.’s
(a) (b)
(c)
Fig. 2.10 Tip-leakage flow and vortex for three different gap sizes, observed in You et al.’s
Fig. 2.11 Energy spectra of the pitchwise velocity fluctuations in the blade wake, observed in
You et al.’s LES computation [115].
The tip-leakage flow topology under the condition of a relative large clearance is inves-tigated in a very recent numerical research with RANS and LES performed by Decaix et
al. [33]. The flow configuration is an isolated NACA0009 airfoil with a relatively large
tip clearance, 10% chord, as well as a smaller one, 2% chord. The computational mesh for LES is non-structured with 200 million elements for the 10% chord case and 300 million elements for the 2% chord case. While the mesh for RANS is structured with approximately 2.8 million nodes for both cases. The LES subgrid-scale eddy viscosity is estimated by a
localised dynamic Smagorinsky model [47] and RANS turbulent viscosity is evaluated by the
k− ω SST model [84]. As shown in Fig.2.12, for the small-clearance case, the tip-leakage
vortex, the induced counter-rotating vortex and the tip-separation vortex are all captured, though the evidence of the tip-separation vortex is not clear. For the large-clearance case, the induced vortex disappears and a fusion between the tip-leakage vortex and the tip-separation vortex is depicted. The formation of the tip-leakage vortex is not delayed with the larger gap and the vortex core is found to be sustained all along the vortex.
(a)
(b)
Fig. 2.12 Flow structures for a clearance of (a) 2% chord (b) 10% chord, observed in Decaix
2.2
Review of aeroacoustic research on tip-leakage flow
As one of the five fundamental airfoil noise mechanisms identified by Brooks et al. [20],
the tip clearance noise in the axial flow fans has been a major concern, since turbo-jet engines have been introduced on aircrafts to replace propellers on a commercial scale. One of the most important objectives of the studies is to identify the mechanisms of the noise generation and to relate the strength of the sources to the physical parameters. This was usually achieved through the measurements and observations in the experiments in the early stages. Based on the adequate knowledge, some appropriate noise-suppression devices have been designed and many noise prediction methods have been developed.
Considering the main interest of the current research, a review of the aeroacoustic research on the tip-leakage flow is presented, with emphasis on experimental research and noise prediction methods, respectively.
2.2.1
Experimental research
As early as the 1960s, Sharland [98] investigated the various possible mechanisms of
noise generation in axial flow fans, as well as the key factors on which the strength of the noise sources depends. Sharland concludes that the noise from the axial fans is of a dipole nature and the broadband noise arises from the vortex shedding at the blade trailing edge. He also proposes a simple model for the noise prediction, which is fundamental for many subsequent studies. However, no specific attention is paid on the noise from the tip-leakage flow.
Mugridge and Morfey [86] reviewed the experiments and theories relating to the fan noise
sources for both subsonic and supersonic axial flow machines. They conclude that secondary flows associated with the tip clearance and the duct boundary layer are sources of turbulence and hence broadband noise. Because of their opposing effects on the secondary flow, the tip clearance and the boundary layer thickness can be optimized to reduce the additional noise radiation. The optimal tip clearance is found to be 5% of the blade chord in Mugridge and Morfey’s tests. The authors also add that the removal of the wall boundary layer may actually increase the radiated broadband noise for a given tip clearance, owing to an increase in the leakage losses.
Longhouse [79] conducted a series of experiments with different clearance sizes to
investigate the tip clearance noise and its control in axial flow fans. He concludes that the tip clearance noise is caused by an unsteady interaction of the tip-leakage vortex with the blade trailing edge and with the leading edge of the following blade. The tip clearance noise contributes up to 15 dB(A) to the fan noise for the large clearances (>3-4% of the blade
chord). It is also dominant for the small clearances, when the fan is heavily loaded. In order to control the tip clearance noise, Longhouse proposes a rotating ring attached to the tips of the blades and a noise reduction of as much as 12 dB is achieved, in spite of a little performance loss.
Kameier and Neise [64, 65] explain the tip clearance noise as a result of a rotating
flow instability. In the experiment, Kameier and Neise find that the tip clearance noise is measured in the acoustic far field only if the rotating flow instability components are present simultaneously in the near field. The rotating instability occurs if a strong reversed flow exists in the tip clearance gap. The tip clearance noise is generated when the rotating instability interacts with the impeller blades. When the tip clearance is enlarged, besides the higher broadband levels, the sound pressure level increases significantly within limited, almost narrow frequency bands in a region below the blade passing frequency. With a turbulence generator installed in the tip gap, the tip clearance noise component in the far field is found to be diminished by more than 30 dB, and the fan efficiency is also increased by 7%. Another comprehensive investigation of the tip-leakage flow and the rotating instability is made by
März et al. [82]. However, only the aerodynamic aspect is considered in this research.
Fukano et al. [43] investigated the effects of the tip clearance on the characteristics
of noise by using three kinds of low pressure axial flow fans and a mixed flow fan. It is found that when the tip clearance is reduced, a lower level of noise is observed at both the design and off-deign conditions. If the rotor shaft is not co-axial with the duct axis, a discrete frequency noise is generated by the interaction of the blades with the duct wall,
which should be avoided. In a more recent study, Fukano and Jang [42,62] find that the
increase of noise due to the tip clearance at low flow rate conditions is mainly caused by the high velocity fluctuations in the vortical flow. The noise due to the peak frequency of the velocity fluctuations can be an important noise source, at high rotational speed.
In most of the experimental researches, a clear trend towards better aerodynamic efficiency and quieter fans with decreasing tip clearance could be observed, such as in the experiment
of Karstadt et al. [69]. In Hughes, Woodward et al.’s aeroacoustic wind tunnel test program
[54,55,109], they find that the optimal tip clearance with minimal broadband noise level
depends on the fan speed. The broadband noise level is the lowest for the nominal clearance at the fan speeds below 75%. Above that speed, a tip clearance of 0.02 inch shows the lowest broadband noise levels. This phenomenon may be explained by that, at lower speeds, the amount of the tip-leakage flow and its interaction with the fan tip are driving the noise. At larger speeds, a very small gap may cause a scraping vortex to be formed, and to interact with the fan tip, generating more broadband noise.
![Fig. 2.5 Tip-leakage flow structure at design point, observed in Inoue and Furukawa’s RANS computation [56].](https://thumb-eu.123doks.com/thumbv2/123doknet/14716963.750359/39.892.150.728.465.915/leakage-structure-design-point-observed-inoue-furukawa-computation.webp)
![Fig. 2.6 Tip-leakage flow structure near stall, observed in Furukawa and Inoue’s RANS computation [44].](https://thumb-eu.123doks.com/thumbv2/123doknet/14716963.750359/42.892.160.766.143.506/leakage-structure-stall-observed-furukawa-inoue-rans-computation.webp)
![Fig. 2.8 Multi-vortex structure, observed in You et al.’s LES computation [114].](https://thumb-eu.123doks.com/thumbv2/123doknet/14716963.750359/45.892.193.672.604.1064/fig-multi-vortex-structure-observed-in-you-computation.webp)
![Fig. 2.9 Generation and evolution of the end-wall vortical structures, observed in You et al.’s LES computation [115].](https://thumb-eu.123doks.com/thumbv2/123doknet/14716963.750359/46.892.180.730.157.1060/fig-generation-evolution-wall-vortical-structures-observed-computation.webp)
![Fig. 2.10 Tip-leakage flow and vortex for three different gap sizes, observed in You et al.’s LES computation [113].](https://thumb-eu.123doks.com/thumbv2/123doknet/14716963.750359/47.892.173.700.162.1099/fig-tip-leakage-vortex-different-sizes-observed-computation.webp)