HAL Id: tel-01298241
https://tel.archives-ouvertes.fr/tel-01298241
Submitted on 5 Apr 2016HAL is a multi-disciplinary open access archive for the deposit and dissemination of sci-entific research documents, whether they are pub-lished or not. The documents may come from teaching and research institutions in France or abroad, or from public or private research centers.
L’archive ouverte pluridisciplinaire HAL, est destinée au dépôt et à la diffusion de documents scientifiques de niveau recherche, publiés ou non, émanant des établissements d’enseignement et de recherche français ou étrangers, des laboratoires publics ou privés.
protein-lipid interactions involved in cellular function
Patricia Kemayo Koumkoua
To cite this version:
Patricia Kemayo Koumkoua. Structural characterisation of highly specific membrane protein-lipid interactions involved in cellular function. Biochemistry, Molecular Biology. Université de Strasbourg, 2015. English. �NNT : 2015STRAF055�. �tel-01298241�
ÉCOLE DOCTORALE EDSC (ED n°222)
Biophysique des Membranes et RMN
THÈSE
présentée par :
Patricia KEMAYO KOUMKOUA
soutenue le : 30 septembre 2015pour obtenir le grade de
Docteur de l’université de Strasbourg
Discipline/ Spécialité : Biochimie et biophysique des protéines
STRUCTURAL CHARACTERISATION OF
HIGHLY SPECIFIC MEMBRANE
PROTEIN-LIPID INTERACTIONS INVOLVED IN
CELLULAR FUNCTION
THÈSE dirigée par:
M. BECHINGER Burkhard Professeur, Université de Strasbourg RAPPORTEURS :
M. STURGIS James Nathaniel Professeur, University of the Mediterranean M. DUFOURC Erick Joël Directeur de recherche, CNRS
AUTRES MEMBRES DU JURY :
Mme LEIZE-WAGNER Emmanuelle Directeur de recherche, CNRS Mme Sizun Christina Chargé de recherche, CNRS
To the KING OF GLORY,
The LORD,
him who is able to do exceeding abundantly above all that we ask or think, according to the power that worketh in us (Ephesians 3:20).i This thesis work was achieved in the NMR and membrane biophysics laboratory (CNRS, UMR 7177) directed by Prof. Burkhard Bechinger my thesis director to whom I express all my gratitude for the opportunity he gave me and for the trust he testified me during these three years. I also sincerely thank our collaborators of Heidelberg who provided preliminary data and background to start this work: Prof. Dr. Felix Wieland, Pr. Britta Brügger, Dr. Andreas Ernst, Alexia Herrmann.
I would like to extend my appreciation to my committee members: Dr. Emmanuelle Leize-WAGNER, Prof. James Sturgis, Dr. Christina Sizun and Dr. Erick Dufourc for their useful comments during my defence. I’m especially grateful to Prof. Sturgis and Dr. Dufourc who agreed to revise the manuscript.
This thesis would not have been possible without the help and discussion with my collegues who agreed to share their scientific knowledge and experiences:
I first express my gratitude to Dr. Christopher Aisenbrey my supervisor for his tremendous help and initiation to a great number of biophysical methods: the solid- phase peptide synthesis, the ssNMR, the circular dichoism and fluorescence. I also thank him for his advices, availability, kindness and for the many interesting and stimulating discussions. I owe my deepest gratitude and special warm thanks to Dr. Elise Glattard with who I share a lot first as colleague and lately as the good friend, she became to me. Indeed, she has been a support at all times during this journey of three years. I thank her for the interesting and stimulating scientific discussions in molecular biology and for all her advices during the review of my defense. I also express my gratitude to Dr. Evgeniy Salnikov, who helped me with the ssNMR experiments and data analysis along with many critical discussions and review my thesis defence. It is also my pleasure to thank Dr. Jésus Raya who introduce me the ssNMR device, the bases of magnetization and contributed to my knowledge and understanding in this field. I would also like to thank Dr. Philippe Bertani for his help and discussion from time to time. I also thank the rest of our laboratory members including some students who defend their PhD and left: Delphine, Nicole, Omar, Anna, Mathias, Nataliia, Barbara, Arnaud... for exchanges and discussions. Caroline and specially Nadia for making me often facilitate administrative tasks and for the kind advices.
I am indebted to Prof. Michel Rohmer and his team members: Prof. Catherine Grosdemange-Billiard, Dr. Denis Tritsch, Aurore Dreneau, Mathilde Munier, for welcoming Elise and I in their building office, for sharing amazing and interesting discussion during the lunch and for the support during my thesis writting and defense. I specially thank Aurore and Mathilde the best singers I ever meet, who contributed to make the end of this journey pleasant.
I also thank Dr Martine Heinrich for her availability and advices for the circular dichroism experiments.
ii humour, and to stand by me at all times. I owe this thesis to my lovely mother, Justine Loudjoe for her love, her hard work and sacrifices to give me the best she had and her unconditional trust. She never stops encouraging me to give the best in life; she is a source of inspiration. I thank my sister Vanessa and my brother Franck for their encouragement and support. I also owe this thesis to my grandfather who has been very proud of me. I thank him for the trust in me and his encouragement to start this long academic journey. I am thankful to my uncle Hypollyte, his wife Béatrice and their children (Loïc and Chris) for their love, encouragement and support. My cousin Franck for the listening and support. I would like to express also my gratitude to my sisters and brothers in church as well as my friend in Strasbourg who contributed in their own way to this work along encouragement, discussion and support: Clémentine, Francine, Jean-Claude, Ethan, Marie-Jeanne, Pamela, Matthieu, Bastien, Fatou.
I am also thankful to my wonderful friends in Switzerland for their support and encouragement: Nana, Isabelle, James, Deasun, Erika, Elsy.
Accomplishment of this PhD thesis was made possible with the financial support from the l’Agence National de la Recherche (ANR) to whom I express my gratitude.
iii Les lipides sont des composants majeurs des membranes biologiques. La plupart d’entre eux sont synthétisés dans le reticulum endoplasmique (RE) à l’exception de la sphingomyéline (SM). En effet, la céramide molécule précurtrice, est d’abord synthétisée dans le RE ensuite transporté via des vésicules jusqu’à l’appareil de Golgi où la SM est synthétisée. Ce transport se fait par des vésicules spécialisées COP (COat Protein) I et II qui transportent respectivement les molécules dans le sens retrograde et antérograde entre le RE et le cis Golgi. Les vésicules COPI agissent activement dans les deux sens au niveau du Golgi.
Récemment, Contreras et al ont décrit une interaction protéine-lipide entre la SM et la protéine transmembranaire de typeI p24, fortement présente dans la membrane des vésicules COP I. Elle interagit spécifiquement parmi les différentes espèces moléculaires de SM avec la SM C 18 et cette interaction semble impliquer à la fois la tête lipidique et les chaînes aliphatiques. Il a été montré que l’interaction est conservée lorsque la protéine est réduite à son domaine transmembranaire (p24TMD, 21 résidus) et les résidus impliqués ont été identifié par mutagénèse : VXXTLXXIY. Une telle spécificité n’avait alors été identifiée que dans le cas d’interaction protéine-protéine et protéine-acide nucléique comme impliquée dans la régulation de fonctions cellulaires. En effet, il a été suggéré que l’interaction p24TMD-SM C18 serait potentiellement impliquée dans la régulation du mécanisme de formation des vésicules COPI. L’ensemble de ces travaux ont également permis de proposer un modèle du complexe p24TMD-SM C18 simulé par dynamique moléculaire. Nous avons voulu caractériser cette interaction en apportant des données structurales dans le but ultime de comprendre sa fonction.
Dans cet objectif, nous avons tout dabord procedé à l’obtention du peptide p24TMD, à sa reconstitution dans les liposomes après purification et à sa caractérisation par différentes méthodes spectroscopiques telles que la résonnance magnétique nucléaire (RMN), le dichroïsme circulaire (DC) et la fluorescence du tryptophane (Trp). Une étude de DC après reconstitution du peptide dans différentes membranes, nous a permis de caractériser l’interaction entre le p24TMD et la SM C18. Des études structurales obtenus par RMN du solide des écahntillons orientés, ont montré que cette interaction n’affecte pas de manière significative la topologie et la dynamique du peptide mais en revanche influencerait l’orientation de la chaîne latérale des acides aminés impliqués (leucine 23). Bien que l’ensemble des travaux présentés dans ce manuscrit ne permettent pas à ce jour de valider ou d’infirmer le modèle proposé, les résultats obtenus ont permis de comprendre caractériser cette interaction et ont apportés des informations structurales sur la topologie et la dynamique du p24TMD dans les membranes. D’autres études structurales par RMN du solide tel que la rotation à l’angle magique (MAS pour Magic Angle Spinning), le PISEMA (Polarization Inversion Spin Exchange at the Magic Angle) et le REDOR (Rotational Echo DOuble Resonance) sont necessaires pour compléter les résultats présentés dans ce manuscrit.
v The lipids are major components of biological membranes. Most of them are synthesized in the endoplasmic reticulum (ER) with the exception of sphingomyelin (SM). In fact, the ceramide (SM precursor) is first synthesized in the ER then transported via vesicles to the Golgi apparatus where the SM is synthesized. This transport is done by specialized vesicles COP (Coat Protein) I and II, which respectively carry the molecules in the direction retrograde and anterograde between the cis Golgi, and ER. The COPI vesicles actively act in both directions in the Golgi apparatus.
Recently, Contreras et al described a protein-lipid interaction between the SM and the type I transmembrane protein p24, mostly present in the membrane of the vesicles COP I. This protein specifically interacts among the different SM molecular species only with the SM C18 and this interaction seems to involve both the lipid head group and the aliphatic chains. It has been shown that the interaction is conserved when the protein is reduced to the transmembrane domain (p24TMD, 21 residues) and the residues involved were identified by mutagenesis: VXXTLXXIY. Such specificity was identified in the case of protein-protein interaction and protein-nucleic acid as involved in the regulation of cellular functions. Indeed, it has been suggested that the p24TMD-SM C18 interaction is potentially involved in the regulation of COPI vesicles biogenesis. Contreras et al proposed a molecular dynamics model of the p24TMD SM-C18 complex. To understanding the function of such specific interaction, here we proposed to investigate it by providing some structural data.
With this purpose, we first obtained the p24TMD peptide and after purification and reconstitution in liposomes, we proceed to his characterization using various spectroscopic methods such as nuclear magnetic resonance (NMR) spectroscopy, circular dichroism (CD) and the fluorescence of the tryptophan (Trp). CD investigation after reconstitution of the peptide in various membranes, has allowed us to characterize the interaction between the p24TMD and SM C18. Structural studies by solid state NMR of oriented samples showed that this interaction does not significantly affect the topology and dynamics of the whole peptide but influence the orientation of the amino acids side chains the involved in the interaction (leucine 23). Although all the work presented in this manuscript do not allow that day to validate or invalidate the proposed model, the results we obtained have allowed us to understand and characterize this interaction and have shed light on the topology and dynamics of p24TMD in membranes. Other structural solod state NMR studies such as the Magic Angle Spinning (MAS), the PISEMA (Spin Polarization Inversion Exchange at the Magic Angle) and REDOR (Rotational Echo Double Resonance) are needed to complete the results presented in this manuscript.
vii Some ideas and figures have appeared previously in the following publications:
Patricia Kemayo Koumkoua, Christopher Aisenbrey, Evgeniy Salnikov, Omar Rifi, Burkhard Bechinger, On the design of supramolecular assemblies made of peptides and lipid bilayers, Journal of Peptide Science, 2015, 21, 8
POSTERS
Kemayo K P, Aisenbrey C, Salnikov E, Bechinger B. Structural characterisation of highly specific membrane protein-lipid interactions involved in trafficking. A novel regulatory mechanism in membrane dynamics ? Conference of the société française de biophysique (SFB) and the société française de biochimie et de biologie moléculaire (SFBBM). Grenoble, France, 21-23 November 2012, (winner of poster prize from the SFB and the SFBBM).
PRESENTATIONS
Kemayo K P, Aisenbrey C, Salnikov E, Brügger B, Bechinger B. NMR studies of highly specific lipid-protein interactions in lipid bilayers. Réunion plénière GDR 3334 SupraMemBio : Assemblages supramoléculaires et membranes biologiques : Concepts, modèles et fonctions. Fournols, 14-17 October 2012.
Kemayo K P, Aisenbrey C, Glattard E, Salnikov E, and Bechinger B. Structural characterisation of highly specific membrane protein-lipid interactions involved in trafficking. A novel regulatory mechanism in membrane dynamics? Workshop of the German-French PhD College: “Membranes and Membrane Proteins” UFA 0407. Strasbourg, 30 November 2012.
Kemayo K P, Aisenbrey C, Glattard E, Salnikov E, and Bechinger B. Structural characterisation of highly specific membrane protein-lipid interactions involved in trafficking. A novel regulatory mechanism in membrane dynamics? ANR awardee mid-term workshop of the projects selected in 2010. Strasbourg, 7 December 2012.
ix
LISTS OF FIGURES ... XI
LIST OF ABBREVIATIONS ... XXIII
GENERAL INTRODUCTION ... 2
CHAPTER 1. 1.1. GENERALITIES ON BIOMEMBRANES ... 2
1.2. COMPOSITION AND ORGANISATION OF BIOLOGICAL MEMBRANES ... 4
1.2.1. Membrane Components: ... 4
1.2.2. Physical properties of lipids in biological membranes: ... 10
1.2.3. Membrane Heterogeneity: ... 13
1.3. CELLULAR SYNTHESIS AND TRAFFICKING OF LIPIDS ... 16
1.3.1. De novo biosynthesis of major membrane lipids ... 16
1.3.2. Intracellular transport of membrane lipids ... 19
1.4. MEMBRANE ASSOCIATED PROTEIN-LIPID INTERACTIONS IN BIOLOGICAL MEMBRANES ... 29
1.5. BACKGROUND &AIM OF THE THESIS ... 31
TECHNIQUES AND PRINCIPLES ... 35
CHAPTER 2. 2.1. STRATEGIES TO OBTAIN THE PEPTIDE... 35
2.1.1. Fmoc solid-phase peptide synthesis ... 35
2.1.2. Expression strategy of recombinant protein in E. coli ... 36
2.2. PURIFICATION AND CHARACTERIZATION OF THE PEPTIDE ... 47
2.2.1. Chromatography ... 47
2.2.2. Electrophoresis ... 49
2.2.3. Western blot ... 50
2.2.4. Mass spectrometry ... 51
2.3. MEMBRANE MODEL AND PEPTIDE RECONSTITUTION ... 54
2.3.1. Lipid model membranes ... 54
2.3.2. Sample preparation with membrane model ... 57
2.4. STRUCTURAL CHARACTERIZATION ... 59
2.4.1. Circular dichroism (CD) ... 59
2.4.2. Fluorescence spectroscopy ... 61
2.4.3. NMR spectroscopy ... 61
EXPERIMENTAL RESULTS: EXPRESSION OF THE CHAPTER 3. RECOMBINANT P24 ... 81
3.1. EXPRESSION OF P24TMDH AS A MBP FUSION PROTEIN. ... 82
x
3.2. EXPRESSION OF P24TMD AS A TAF12 FUSION PROTEIN ... 112
3.2.1. Experimental ... 112
3.2.2. Characterization by mass Spectrometry ... 114
3.2.3. Results and discussion: ... 115
3.2.4. Conclusions ... 127
EXPERIMENTAL RESULTS: BIOPHYSICAL INVESTIGATION CHAPTER 4. OF PROTEIN-LIPID INTERACTIONS ... 130
4.1. BIOPHYSICAL AND STRUCTURAL CHARACTERIZATION OF P24TMD-SMC18 INTERACTION ... 130
4.1.1. Introduction ... 130
4.1.2. Preliminary biophysical studies of p24TMD in membrane ... 131
4.1.3. Investigation of p24TMD-SMC18 interaction by solid-state NMR ... 153
4.2. BIOPHYSICAL STUDY OF THE CRAC MOTIF AND CHOLESTEROL INTERACTION ... 179
4.2.1. Introduction ... 179
4.2.2. Conclusion ... 184
GENERAL CONCLUSION AND PERSPECTIVES ... 188
CHAPTER 5. 5.1. EXPRESSION OF P24TMD AND STRUCTURAL CHARACTERIZATION OF P24TMD-SMC18 INTERACTION ... 188
5.1.1. Conclusions on p24TMD bacterial expression ... 188
5.1.2. Conclusions on biophysical and structural characterization of p24TMD-SM C18 interaction 189 5.2. BIOPHYSICAL STUDY OF THE CRAC MOTIF AND CHOLESTEROL INTERACTION ... 190
REFERENCES ... 193
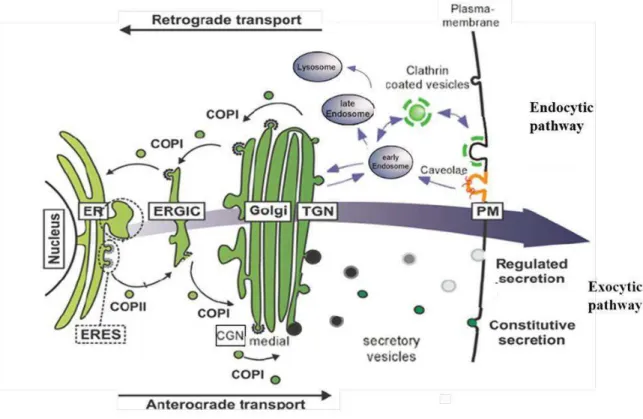
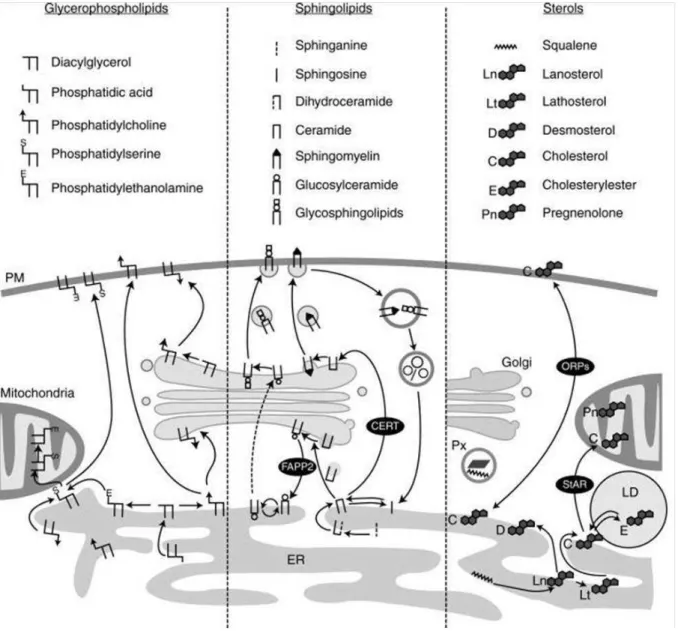
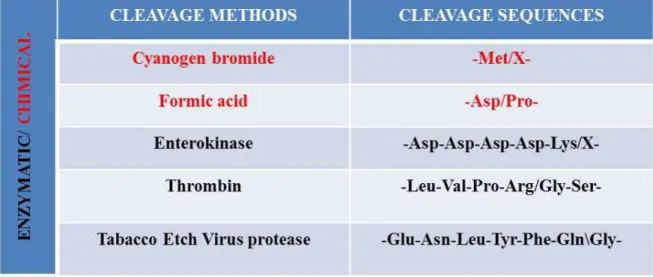
xi Figure 1: Representation of eukaryotic cell with the complex organization of organelles imbibed in the cytoplasm. Extract from Becker W.M and al, 2003. ... 3 Figure 2: The fluid mosaic model of the plasma membrane proposed by Singer and Nicolson, in 1972. Extract from Biology of the cell, Part II chapiter 6. ... 3 Figure 3: The different type of membrane proteins and the ways they bind to lipid bilayers. Adapted from (Alberts et al., 2002) ... 6 Figure 4: Chemical diversity of the different common classes of lipids in biological membranes. (A) Glycerophospholipids, (B) Sphingolipids. Possible chemical modifications of the head groups for these two classes are highlight in green (circle). The lists of groups that can be added to the head group are summed up into the green box. The type of linkage in glycerol at C1 position in glycerophospholipids is highlighted in red. (C) Sterols structure. Extracted and adapted from Ünal C and Kai S, 2011... 10 Figure 5: Typical lipid composition in the membranes of eukaryotic cell. Extracted from Van Meer G et al, 2008. ... 10 Figure 6: A) melting transition of lipid acyl chains under increase of the temperature. B) The three most common membrane phases seen as cross sections and from top. SO, LO, LD : solid ordered, liquid ordered, liquid disordered phases (Heimburg, 2009) ... 13 Figure 7: Biosynthetic pathways of the major classes of membrane lipids. A) Glycerophospholipids, biosynthetic pathway that take place in mitochondria are represented in dashed boxes. B) Sphingolipids and C) cholesterol the most abundant sterol. Extracted from (Lev, 2010). ... 19 Figure 8: Schematic representation of the secretory pathway. The anterograde transport corresponds to the transport of molecules from the ER to the PM while retrograde transport is in the inverse direction. Arrows indicate the direction of transport. Extracted from (Strating and Martens, 2009) and adapted. ... 20 Figure 9 : Nonvesicular mechanisms of lipid transfer between membranes. A) and B) illustrate spontaneous diffusion of lipid monomer either through cytoplasm or during membrane collision. C. Mechanism of lipid transfer by LTPs. D to G. describe the differents mechanisms of lipid transfer at MCSs. Extracted from (Prinz, 2010). ... 22 Figure 10: Schematic illustration of the different COPI biogenesis steps. Extracted from (Popoff et al., 2011). ... 25 Figure 11 : Intracellular trafficking of the major classes of membrane lipids. Extracted from (Blom et al., 2011). ... 29 Figure 12 : p24TMD specific interaction with SM C18 (Contreras et al., 2012). A) In vitro FRET analysis of MBP–TMD fusion proteins and pentaenoyl-sphingomyelin (SM 18:5) in proteoliposomes. p24TMD (Red curve), p24TMD (greenyellow), p24TMDW4A (orange curve). B) Quantification of fluorence of p24TMD (black) or p23TMD (grey) in pentaenoyl-sphingomyelins liposomes mimicking liquid disordered phase. C) Molecular dynamic simulations: snapshot of a SM 18–p24TMD interaction. ... 33
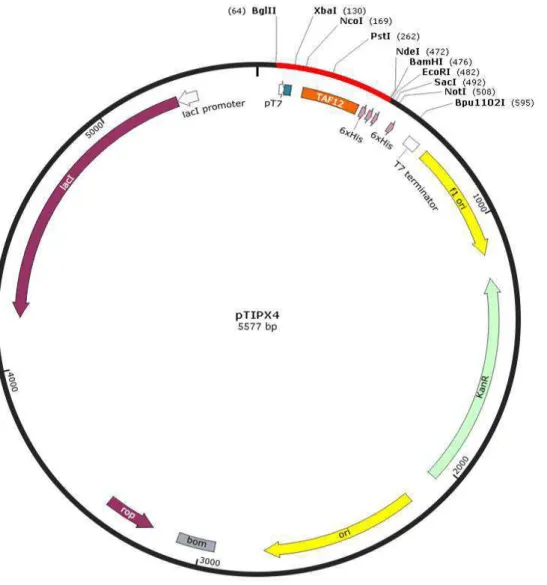
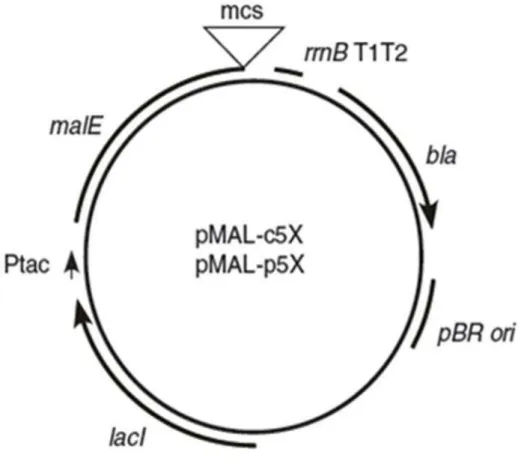
xii vector (Makrides, 1996). The promoter (P) is positioned upstream of the coding sequence and is often under the control of a regulatory gene (R) that encodes a repressor. This gene may exist on the expression vector or on the chromosome of the host cell. The ribosomal binding site (RBS) sequence contains the Shine-Dalgarno (SD) which is complementary to the 16s RNA of the small subunit of ribosome. The termination sequence of transcription (TT) serves to stabilize the mRNA. The selectable marker (Tet) which encodes a gene for tetracycline resistance allows the selection of bacteria having the vector. The copy number of the vector in the cell is determined by the origin of replication (Ori). The arrow indicates the direction of the transcription. (Makrides, 1996) ... 38 Figure 15: Schematic representation of the pTIPX-4 plasmid with its different regulatory elements. pTIPX-4 is a plasmid of 5577 bp that contains the resistance gene to the kanamycin, a MCS with the SacI and BamHI restriction sites, the cis regulatory elements and the nucleic sequence coding for the TAF12 fusion protein. ... 43 Figure 16 : General features of the pET expression system. A) A schematic representation of the pET vector with its important regulatory elements. B) Regulation of the inducible T7 and lacUV5 promoters. In absence of the inducer (ITPG), they are both repressed by LacI. The presence of IPTG allows the expression of the T7 polymerase that binds the T7 promoter and initiates the transcription. (Sørensen and Mortensen, 2005) ... 44 Figure 17: Schematic representation of the pMAL-c5X. It contains the hybrid Ptac promoter, the malE gene that codes the MBP fusion protein, a pBR ori and the lacI gene that codes the LacI repressor. Reproduced from New England Biolabs ... 45
Figure 18: Schematic basic HPLC device with its components and typical RP-HPLC chromatograms. The different steps during the purification in the column are emphasized as well their corresponding chromatogram. Adapted from Tosoh Bioscience and Applied POROUS Technologies, Inc. ... 49
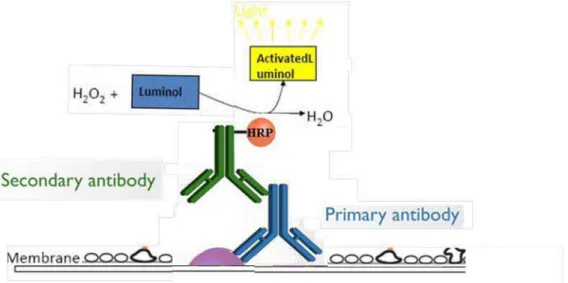
Figure 19 : Schematic representation of the principle of detection by chemiluminescence. The primary antibody specifically recognizes the protein of interest (in purple) which is then detected by a modified secondary antibody covalently link to the peroxidase. This enzyme produces an oxygen radical which activates luminol and allows the detection of the protein of interest. ... 51 Figure 20: Schematic representation of the principle of detection by chemiluminescence. The primary antibody specifically recognizes the protein of interest (in purple) which is then detected by a modified secondary antibody covalently link to the peroxidase. This enzyme produces an oxygen radical which activates luminol and allows the detection of the protein of interest. ... 52 Figure 21: The different modes and the resulting spectrum. A) The basic path of ions in a linear mode (left) and the resulting broad spectrum (right). B) Components in a reflecting mode (left) and the more resolved spectrum that results (right). Det: abbreviation for detector. Source: R. S. Annan, SmithKline Beecham Pharmaceuticals. ... 53
xiii facilitated by lipids with different geometric shapes. ... 56 Figure 23: Structural representation of common lipids that were used in this work for preparation of model membranes: POPC, phosphatidylethanolamine (PE), phosphatidylserine (PS), and Sphingomyelin (SM). ... 56 Figure 24: The different preparation steps of an oriented sample. (A) Application of viscous lipid/peptide solutions on glass plates. (B) Stacking of the glass plates on top of each other after elimination of the organic solvent and hydration of the membranes. Zoom on the stacked glass plates with several membranes bilayer stacking between two glass plates. (C) The sample is sealed into plastic foil for NMR measurement. (Aisenbrey et al., 2010b). ... 59 Figure 25: Representation of the characteristic CD spectra for the three common proteins secondary structures. α-helical (red), β-sheet (blue) and random coil (green). The area shaded in blue is not accessible by commercial CD apparatus but only by Synctron radiation CD´s. ... 61 Figure 26: Stick representation of aromatic residues: tryptophan (A), tyrosine (B) and phenylalanine (C) with the maximum absorption (blue arrow) and fluorescence emission (red arrow) at pH 7. ... 61 Figure 27: Splitting of spin population in presence of a magnetic field B0 for spin ½: Zeeman Effect... 64 Figure 28: Representation of the creation of the net magnetization M at the equilibrium after B0 is applied ... 64 Figure 29: The different steps to obtain the NMR signal. ... 65 Figure 30: Representation of the different relaxation time with their respective equations. A) Representation of the spin-lattice relaxation. B) The spin-spin relaxation time T2*. .... 66 Figure 31: Representation of the different relaxation time with their respective equations. A) Representation of the spin-lattice relaxation. B) The spin-spin relaxation time T2*. .... 67 Figure 32: Graphical representation of the chemical shift anisotropy tensor A) in the PAF and B) in the laboratory frame with the Euler angles (θ and Ф). ... 69 Figure 33: Representation of the influence of the asymmetry parameter on the anisotropic chemical shift tensor ... 70 Figure 34: Graphic representation of dipolar coupling between two spins I et S ... 71 Figure 35: Symmetric and asymmetric distribution of charges for nucleus with spin I =1/2 and quadrupolar nucleus (I>1/2) respectively ... 72 Figure 36: Differences between 13C spectra recorded by solution (upper) and solid state NMR (down). ... 72 Figure 37: A) representation of the 15N chemical shift tensors in a peptide reconstituted in a lipid bilayer and their representation for a powder sample. And the orientation of peptide in membrane: B) Tansmembrane and C) in plane orientation. (Bechinger and Sizun, 2003). 75 Figure 38: Simulated spectra of a powder and a well oriented sample. A peptide with a well defined orientation will give two sharp peaks corresponding to a splitting ... 76
xiv Figure 40: Static and MAS 13C spectra at different rotational frequencies of 13C uniformely labeled glycin powder. The stars represented side bands. (Laws et al., 2002). ... 77 Figure 41 : Representation of MBP-p24TMDH and TAF12-p24TMD fusion proteins that were expressed and the respective p24TMDH and p24TMD peptide sequences. ... 82 Figure 42:Protocol butanol extraction ... 86 Figure 43: Kinetics of bacterial growth (A) BL21 DE3 and (B) BL21 DE3 pLysS in LB medium before and during expression of MBP-p24TMDH at 37°C. Bacterial growth is monitored by measuring the OD 600 nm versus time. The arrow indicates the induction by the addition of IPTG (final concentration 1 mM) at OD = 1 and 1.4 respectively. The red curve corresponds to the induced and the black one to the uninduced condition ... 89 Figure 44: SDS PAGE gel electrophoresis of the different fractions of protein extraction for MBP-p24TMD after expression in (A) BL21 DE3 pLysS and (B) BL21 DE3. The different fractions from the protein extraction induced conditions (I) and non-induced (NI) were deposited on 12% polyacrylamide gel SDS-PAGE. Deposits volumes are: 15µL for the different fractions (equivalent to 500µl of culture). After electrophoresis migration for 1h at 150V, gels were stained with Coomassie blue. The different bands are defined as follow: SN: supernatant after cells lysis and centrifugation, FT: flowthrough after incubation of the SN with amylose beads, Wn: correspond the wash of the beads in order to remove weakly or unbound proteins with n corresponding to the number of washing step, En for elution fraction with n corresponding to the fraction, M: molecular weight marker. The table below contain the theoretical masses of different forms of MBP-p24TMDH. They were obtained from the sequence through the Software ProtParam Site ExPASy (http://web.expasy.org/protparam/). ... 91 Figure 45: Summary of the yield in the different bacteria strains and the elution profiles of MBP-p24TMD. The protein elution profiles of MBP-p24TMDH are represented as a function of the optical density at 280nm. The SDS-PAGE after expression in DH5α was obtained from our collaborators at the University of Heidelberg. The different concentrations were estimated from the measured OD 280nm values on a Nanodrop-1000 spectrophotometer ... 92 Figure 46: Expression and purification of MBP-p24TMDH. (A) Bacterial growth curve in M9 minimum medium. Bacteria were grown at 37°C until OD 600nm 0.8-0.9 and protein expression induced by addition of IPTG 1mM (see arrow). After induction, cells were grown at 18, 30 and 37 °C under shaking (230 rpm) during 24, 22 and 8 hours respectively. (B) SDS-PAGE analysis of the expression of MBP-TMDH during the purification steps. The total cell lysates were centrifugated and the supernatant corresponding to the total protein extract, was incubated with amylase beads 1h at 4 °C. Beads were settle down by centrifugation at 2000g, 5min and the supernatant (FT) recovered. Beads were thereafter washed to remove the excess of protein and the MBP eluted with the elution buffer (20 mM Tris; 200 mM NaCl; 100mM EDTA, pH 7.4; 10mM maltose). 15µl of FT (equivalent to 500µl of culture) and 20µl the different elution fractions (En) (equivalent to 600µl of culture) were loaded on 12% SDS-PAGE gel. Gels were stained with Coomassie blue after
xv indicates the molecular weight marker ... 96 Figure 47: SDS-PAGE profile of the full and truncated MBP-p24TMDH after Coomassie ... 96 Figure 48: SDS-PAGE profile of MBP-p24TMDH cleavage. (A) Kinetic of cleavage in solution at different protease-to-target protein ratios and different temperatures. For each condition, 47µg of purified protein was digested with the corresponding amount of TEV protease to obtain the different ratios (w:w; 1:20, 1:50, 1:100, and 1:150). The cleavage was then achieved at RT~25°C (red) or 4°C (blue). 1µl (1.6µg) of the different products of digestion and non-digest (ND) protein were sampled at different times (30min, 1h, 2h, 3h, 4h and 24h) and separated on a 10% polyacrylamide gel for 1h at 200V. (B) Cleavage of the resin-bound protein. After incubation of MBP-p24TMDH 1h at 4°C with amylose beads, TEV protease was added and the sample incubated for 24h at 4°C under gentle agitation. Beads were settled-down by centrifugation and the supernatant recovered and incubated with cobalt resin to get-rid-off the TEV protease. Lanes 3 and 4 correspond to the supernatant before incubation with cobalt resin and 6 and 7 to the supernatant after incubation. 5µl (8.5µg) of supernatant was loaded on a 10-20% gradient gel and separated for 1h at 200V with the purpose of identifying the peptide. The well 5 corresponds to the pure His-TEV protease (0.2µg) as reference (or as control). A zoom of lanes 3 and 4 is shown (right) with arrows indicating the MBP-p24TMDH, MBP after cleavage of p24TMD (44.3 kDa) and the MBP-5 (42kDa) corresponding to the truncated MBP. The table summarizes the theoretical molecular weight of the expected protein and peptide ... 99 Figure 49: p24TMDH mass spectrometry. The main butanol extraction fractions containing the peptide (butanol phase supernatant and pellet) were received from our collaborators. These fractions were resuspended in 30% acetonitrile/ 0.1% TFA/water and 1µl mixed to 1µl α-Cyano matrix on the target. The sample was dried at air and analyzed on a MALDI-TOF spectrometer using linear mode detection. The spectrometer was calibrated with a mixture of peptide ranging between 1000 and 3500 Da (peptide calibration standard, Bruker, Bremen, Germany). Abbreviations: PB (pellet of the butanol phase); SNB (supernatant of the butanol phase). ... 101 Figure 50: p24TMDH purification and characterization by SDS-PAGE and mass spectrometry. 2.5mg of MBP-p24TMDH was cleaved with 48µg of TEV protease achieving the ratio (50:1). (A) The peptide was thereafter purified as described on the butanol extraction protocol above. (B)1.5µl of each fraction and 15µl (180µg) of the cleavage product were loaded on a 15% polyacrylamide gel and protein separated for 1h under 150V, 300mA. The Protein ladder (MXD) was separated simultaneously and the gel stained with Coomassie blue. The different abbreviations are defined in the butanol extraction protocol; D is for the digest product. (C) In parallel, 1µl of each fraction was mixed to 1µl α-Cyano matrix on the target, dried at air and analyzed by MALDI-TOF mass spectrometry using linear mode detection. The spectrometer was calibrated with a mixture of peptide ranging between 1000 and 3500 Da (peptide calibration standard, Bruker) .... 105
xvi uncleaved (S, 30µg) p24TMD synthetic peptide. The different samples were separated in a 4-20% polyacrylamide gel in denaturing conditions. Protein ladder (M) was separated simultaneously and the gel stained with Coomassie blue. (B) 1µl of the product of MBP-p24TMDH cleavage was mixed to 1µl SA matrix on the target, dried at air and analyzed by MALDI-TOF mass spectrometry using linear mode detection. The spectrometer was calibrated with a mixture of proteins ranging between 4000 and 20000 Da (protein calibration standard I, Bruker). (C) Mass spectrometry spectra of the MBP-p24TMDH digested with trypsin (control, top) and that of the bands 1, 2 and 3 cut from the gel are shown (A). The MBP-p24TMDH was first digested with the trypsin and the generated fragments used to provide a bank of peptides. Their presence was thereafter found after the trypsin digestion of the bands cut on the gel by comparison of the mass spectra. (D) Mass spectrometry of p24TMD synthetic peptide and the bands 4, 5, 6, 8 after trypsin digestion. The spectra C and D were obtained by MALDI without fragmentation with a reflectron mode and provided by the mass spectrometry service at the molecular and cellular biology institute. The black arrows pinpoint the p24TMD and p24TMDH sequences with their expected masses. (E) Product of cleavage with 50% HFIP (v/v). 9 mg of purified MBP-p24TMDH from M9 medium culture was cleaved in solution with TEV protease with the final protein/enzyme ratio 20:1. Addition of HFIP to 7.714 mg of total cleaved protein, (1:1, v/v), lead to different phases and a white precipitate after vortexing and centrifugation ... 108 Figure 52: Purification and characterization of p24TMDH after cleavage of the resin-attached MBP-p24TMDH. (A) The reverse phase HPLC chromatogram of the supernatant that was recovered after cleavage from the amylose resin. After cleavage on resin (1:20 protease-to-protein ratio), beads were settled down and the supernatant (equivalent of 148µg of protein) was injected a ProntoSIL 300-3-C4 analytic column. The sample was purified under a 10-95% acetonitrile/water gradient on Bischoff device. (C) 0.5µl of the different elution fractions were mixed to the same volume of α-cyano matrix and analyzed using a linear mode on a MALDI-TOF spectrometer. HPLC fractions were lyophilized, loaded on a 10-20% gradient polyacrylamide gel and separated for 1h at 200mV. The gel was stained with Coomassie blue ... 110 Figure 53: Influence of IPTG and arabinose on bacterial growth and TAF12-p24TMD expression. Kinetics of bacterial growth was achieved by monitoring of the OD 600nm every 30min. They were grown at 37 °C until OD = 1 (arrows) and the expression induced with (A) different concentrations of IPTG (0.8, 1 and 1.2 mM) and a fixed concentration of arabinose (0.2%) or (B) different concentrations of arabinose (0.2, 0.5 and 1%) and a fixed concentration of IPTG (1mM). The different fractions during protein extraction for the IPTG test (C) and the elution fractions for arabinose test (D) in induced (I) or non-induced (NI) conditions were analysed by SDS-PAGE. Samples were separated on a 16% Tris glycine gel during 1h10 at 150V and the gels stained with Rotiblue. The loaded volumes are the following: 24µl for soluble (FS) and insoluble fractions (Mbe + CI: membrane and inclusion bodies) (equivalent to 120 µl of culture), 12 µl for membrane fractions (Mbe)
xvii 12µl of protein ladder (PM) (Precision Plus Protein Dual Color Standards ™). The red arrows indicate the protein of interest. The theoretical masses in the table were obtained through the web software ProtParam Site ExPASy... 117 Figure 54: Influence of OD 600nm at induction and temperatures on TAF12-p24TMD expression. (A) Bacteria were grown until OD (600nm) ~ 1, 1.5 and 2 and the expression induced during 3 hours at 37 °C with 0. 8 mM IPTG and 1% arabinose. After purification of the fusion protein, 45µl of each elution fraction (equivalent to 4.5 ml culture) were analyzed by SDS-PAGE. For the temperature test, induction was performed with the same concentration of inducers during 4h at 28, 37°C and for longer time at 15, 20°C. (B) 25µl of elution fractions (equivalent to 2.5 ml culture) and (C) 12µl (equivalent to 1.2ml) were analyzed. Samples were separated on a 16% Tris glycine gel during 1h10 at 150V and the gels stained with Rotiblue. 12µl of molecular weight marker was deposit. The red arrows indicate the protein of interest ... 119 Figure 55: Chromatogram of elution fractions after cobalt affinity and MALDI-TOF mass spectra of the HPLC fractions. (A) The pool of cobalt affinity elution fractions (equivalent of 125ml culture) were purified under a 10-95% acetonitile/water gradient during 85min on Bischoff HPLC using Jupiter C4 HPLC analytic column. The chromatogram shows the absorbance at 214nm (black), 280nm (red) and 253nm (yellow) as a function of time (min). The peaks correspond to the eluted proteins at different acetonitrile gradients: ~ 30, 42, 52 and 60%. (B) 1µl of each eluted fraction was mixed with 1µl of SA matrix and analyzed MALDI-TOF using linear mode detection under 30% laser power. The calibration was performed with the protein calibration standard I (Bruker) ... 122 Figure 56: Reverse phase HPLC chromatogram of insoluble fraction and mass spectra. (A) The insoluble fraction of 1L and 500ml equivalent culture for the induced and non-induced conditions, respectively, was purified under a 10-95% isopropanol/water gradient during 60min on Gilson HPLC using a Jupiter C4 preparative column. The chromatogram shows the absorbance at 214nm as a function of the time (min) for the induced (blue) and non-induced (purple) conditions. Proteins were eluted in both conditions between 38 and 62% isopropanol. (B) 1µl of each eluted fraction was mixed with 1µl of SA matrix and analyzed by MALDI-TOF using linear mode detection under 30% laser power. The calibration was performed with the protein calibration standard I. Only the full spectra of the HPLC fraction 9 (highlight in the black frame) in which our protein of interest was identified is represented. The region of the expected mass (frame in black) was zoomed. The red arrow pinpoints the peak that could correspond to the TAF12-p24TMD. The –KR or –R indicate that the peak could correspond to the peptide lacking the KR (Lysine and Arginine) residues or R (Arginine) residue ... 123 Figure 57: Chromatogram and mass spectrometry spectra after formic acid cleavage of HPLC fraction containing the fusion protein (A, B) or the insoluble fraction (C). (A) The TAF12-p24TMD was purified by HPLC under a 10-95% isopropanol/water gradient (red) during 60min from the injection of the equivalent of 2.8l and 500ml culture for the induced and non-induced conditions, respectively, resuspended in formic acid/water (75/25, v/v).
xviii (min) for the induced (blue) and non-induced (purple) conditions. The cyan and black boxes indicate the fractions in which peptides with close mass to the one we expected were identified. The fraction frame in cyan is recovered in the injection peak (PI). (B) MALDI-TOF spectra of the fractions frame in black for the induced (blue and cyan), non-induced (purple) conditions. (C) Mass spectra when cleavage was achieved directly on insoluble fraction after HPLC purification. 1µl of each eluted HPLC fraction was mixed with 1µl of SA matrix and analyzed MALDI-TOF using linear mode detection under 30% laser power. The calibration was performed with the protein calibration standard I. The red arrow pinpoints the peak with a close mass to that of p24TMD ... 126 Figure 58: HPLC chromatogram of p24TMD purification. The black line represents protein absorbance at 214nm, the yellow line at 254nm and the red line at 280nm. The latter is essentially due to Trp. The star indicates the elution fraction in which the peptide was identified ... 137 Figure 59: Identification of p24TMD after purification by MALDI spectrometry. 0.5µl of p24TMD HPLC fraction 44% solvent B (100% acetonitrile 0.1% TFA) was mixed with α-cyano matrix, dried at air and analyzed by MALDI-TOF mass spectrometry with a reflectron mode ... 138 Figure 60: Characterization of p24TMD in different solvents to test its solubility. The peptide was prepared in different solvents at the final concentration of 30µM and its secondary structure and the Trp fluorescence were followed by CD (A) and fluorescence (B) respectively. In addition, the peptide secondary structure change was followed upon increasing volume of HFIP in a water/HFIP (v/v) mixture (C). A 1mg/ml stock solution of p24TMD was prepared in water and the concentration of peptide determined by absorbance at 280nm by use of the extinction coefficient. The necessary amount for 30µM final concentration of peptide was transferred into different tubes and the water was evaporated under vacuum. Thereafter, a giving volume of HFIP was added to the peptide, and completed with water to obtain the desired volume ratio of water/HFIP in 1ml and 300µl used for the CD measurement. The secondary structure composition of p24TMD was estimated from the raw CD data using the CDPro software (Sreerama and Woody, 2004). For the caption in (A) and (B): water# correspond to the peptide in water but that was dissolved first in HFIP and the solvent evaporated ... 140 Figure 61: Characterization of p24TMD interactions with lipids using fluorescence spectrosocpy. The Trp fluorescence of xx mM peptide in 10 mM phosphate buffer, pH7 is shown upon titration with POPC (A) or POPC:POPG (2:1) (B) at different lipid concentrations ranging from 0 to 2 mM,. (C) CD spectra of p24TMD in presence of POPC liposomes and (D) the estimation of the secondary structure at different lipid concentration ranging from 0 to 3 mM ... 142 Figure 62: Test of p24TMD reconstitution-competent state in POPC. Circular dichroism (A) and Trp fluorescence (B). The table explains the captions ... 143
xix from 10 to 60µMand and (B) the Trp fluorescence ... 144 Figure 64: Test of the influence of buffer for p24TMD reconstitution in POPC. (A) Circular dichroism spectra of p24-POPC proteo-liposomes (P/L molar ratio, 3/100) prepared in phosphate or Hepes buffer and (B) the estimation of secondary structure. (C) Trp fluorescence of the same samples. All was measured at T=25°C ... 145 Figure 65: Structure of lipids with their different properties. The differences for the head group (size) are highlight by red and purple circles for large and small head group respectively; while for the acyl chain differences are highlight by lipid’s names that are written in green and blue for the long and short acyl chain respectively. SM was used to investigate its interaction with p24TMD as it interacts with membrane and modified its properties ... 146 Figure 66: Effect of lipid’s physical parameters and SM interaction with p24TMD. (A) Circular dichroism spectra of p24 in proteo-liposomes (P/L molar ratio, 3/100) prepared in phosphate buffer and with different lipids: DMPC, POPC, POPE, POPC/SM (95/5), POPC/PE/SM (85/10/5) and (B) estimation of secondary structure composition. (C) Trp fluorescence of the same samples. All was measured at T25°C except for DMPC (37°C) ... 147 Figure 67: Proton-decoupled 15N cross polarization ssNMR spectra (left) of [15 N-A20]-p24TMD reconstituted into oriented POPC membranes prepared in different conditions: A) when the peptide and lipids are both dissolved in HFIP (P/L, 1.9%), (B) the peptide is first dissolved in HFIP/water (50/50, v/v) before being mixed with lipids (P/L, 1%), (C) the peptide is first dissolved in HFIP/water (50/50, v/v) or (D) (80/20, v/v) and added to the lipids in a step-wise manner (P/L, 1%). The proton-decoupled 31P ssNMR spectra of the POPC head group in membrane for each described conditions (right). The first spectrum (A) was recorded at 9.4 Tesla and the others on the 7.1 Tesla at RT ... 150 Figure 68: Molecular structure of SDS (anionic) and DPC (zwitterionic) detergents. Their respective CMC are 8 mM and 1.5 mM in water (Manzo et al., 2013)... 151 Figure 69: CD and fluorescence of p24TMD in detergents (SDS and DPC). 30µM of peptide was prepared in 10 mM phosphate buffer, pH7 and titrated with SDS and DPC at variable concentration ranging from 0 to 16 mM and 0 to 5mM respectively. The CD spectra of the peptide in SDS (A) and DPC (B) were recorded at 25°C. The secondary structure was extracted from raw CD data for the peptide in SDS (C) and in DPC (D) using CDPro software. Fluorescence experiences were achieved in the same conditions in SDS (E) and in DPC (F). ... 152 Figure 70: Proton-decoupled 15N cross polarization ssNMR spectra of 7mg of A) [15 NV19-2HL23]-p24TMD and (B) [15N-A20]-p24TMD reconstituted in oriented 150mg POPC (black) or POPC/SM (95/5) (grey) membranes. The spectra were recorded on the 400MHz at RT. Their respective superimposition is presented on the bottom. The p24TMD sequence is represented with the TMD in bold, the 15N labelled position are indicated by residue numbers and the amino acids involved in the binding with SM C18 are underlined. All the spectra were acquired with 42000 scans except for the spectra of [15N V19-2H
xx Figure 71: Proton-decoupled 15N ssNMR spectra of A) [15N L23-2H A20]-p24TMD, B) [15N L18-2H A15]-p24TMD and C) [15N L16-2H A15]-p24TMD in oriented POPC (black) or POPC/SM (95/5) (grey) membranes. All the spectra were recorded on the 400MHz at RT except for (C) that was recorded on the 300MHz spectrometer. The corresponding 31P spectra are represented on the top left and were all calibrated to 0ppm. The 15N labeled position are indicated on the p24TMD sequence. ... 159 Figure 72: Superimposition of the 15N ssNMR spectra (left) of A) [15N L23-2H A20]-p24TMD, B) [15N L18-2H A15]-p24TMD and C) [15N L16-2H A15]-p24TMD in oriented POPC (black) or POPC/SM (95/5) (grey) membranes and 31P spectra (left). The 15N chemical shift values of the different label residues are summarized in the table below.. 160 Figure 73: Effect of the increased proportion of SM C18. (A) The 15N ssNMR spectra of [15N L18-2H A20]-p24TMD in oriented POPC (black), POPC/SM (95/5) (grey) and POPC/SM (90/10) (purple) membranes and B) the 31P spectra of each membrane calibrated to 0ppm. All spectra were recorded 9.4 Tesla RT. The 15N label residue within p24TMD sequence above is highlight in green and the 2H residue in red ... 162 Figure 74: (A) Simulated spectrum of 2H3-alanine with an angle of 48°±1° between the Cα-Cβ bond and the magnetic field when a static quadrupolar coupling constant of 72 kHz is assumed. (B) Experimental 2H solid-state NMR spectra of [2H
3Ala15- 15N Leu18]-p24TMD reconstituted into oriented POPC (black) and POPC/SM (95/5) (gray) bilayers. Spectra were recorded on a 400MHz spectrometer at RT and LB of 500Hz applied for each spectrum. The DHO peak in the middle of each spectrum was calibrated to zero. (C) The zoom of the experimental spectra superimposition. For the spectrum obtained in POPC, ∆ν was determined by 2-fold multiplication of the measured ν as indicated. ... 164 Figure 75: (A) 2H solid-state NMR spectra of [2H
3 Ala15- 15N Leu16]-p24TMD and [2H3Ala15- 15N Val19]-p24TMD reconstituted respectively into oriented POPC (black) and POPC/SM (95/5) (grey) bilayers, at -20°C. 15N spectrum of [2H3 Ala15- 15N Leu16]-p24TMD in POPC (black) at -20°C is shown on top of the 2H spectrum. (B) 2H solid-state NMR spectrum of [2H3Ala15- 15NVal19]-p24TMD into oriented POPC/SM (95/5) (purple) at 4°C. The spectra below represent the superimposition of this spectrum with the one recorded in POPC/SM (95/5) bilayers at RT (grey). All spectra were recorded on a 400MHz Advance Bruker NMR spectrometer and a LB of 500Hz was applied. ... 165 Figure 76: (A) 2H solid-state NMR spectra of [2H3 Ala20- 15N Leu18]-p24TMD and [2H3 Ala20- 15N Leu23]-p24TMD reconstituted into POPC bilayers with the lipids oriented parallel (black) and perpendicular (pink) to the magnetic field respectively. (B) 2H solid-state NMR spectrum of [2H3 Ala20- 15N Leu18]-p24TMD into POPC/SM (95/5) (gray) and POPC/SM (90/10) (blue) bilayers, with the normal oriented parallel to B0. The spectra below represent the superimposition of the different spectra. Spectra were recorded at 9.4 Tesla on the Advance Bruker NMR spectrometer except the one POPC/SM (95/5) (gray) which was recorded at 11.7 RT. A LB of 500Hz was applied to all spectra. ... 167 Figure 77: (A) The contour plot that results from experimental measurements of the 2H quadrupolar splitting of Ala-15 (20±3) kHz in black, the 15N chemical shift are
xxi turquoise. These restraints were all obtained for thr p24TMD into POPC/SM (95/5).The angular pairs that agree with both the 2H quadrupolar splitting of Ala-15 and the 15N chemical shift are circled and (B) the corresponding topology relative to the membrane illustrated. ... 170 Figure 78: 2H quadrupolar spectra of the 2H3leucine23 (d10) side chain at RT (left) and -20°C (right) in POPC (A) and POPC/ SM (95/5) (B) membranes when the lipid bilayers are oriented with the lipids normal parallel to the magnetic field. All the spectra were recorded on the 400MHz ssNMR spectrometer. (C) Superimposition of spectra. ... 171 Figure 79: 2H quadrupolar spectra of the 2H3leucine23 (d10) side chain at RT (left) and -20°C (right) in POPC (A) and POPC/ SM (95/5) (B) membranes when the lipid bilayers are oriented with the lipids normal parallel ( black and gray) or perpendicular to the magnetic field. All the spectra were recorded on the 400MHz ssNMR spectrometer ... 172 Figure 80: (A) 1H-15N ssNMR spectra of [2H
3 Val19- 15N Leu23]-p24TMD in POPC/POPE/POPS/Chol/SM (52/19/5/16/8) membrane bilayer, recorded at different temperatures on the 400MHz. The air under each peak was integrated and plot with temperature. A ratio of 1 corresponds to half of transmembrane and half in plane peptide orientation. (B) 2H quadrupolar spectra were recorded at different temperature in POPC/POPE/POPS/Chol/SM (52/19/5/16/8) and POPC/POPE/POPS/Chol (60/19/5/16) membranes and the quadrupolar splitting was estimated at the half maximum without the water peak (define as shown) and plot with the temperature ... 174 Figure 81: (A) Simulated 2H solid-state NMR spectrum of oriented (left) and non-oriented (right) sample carrying a single deuterated site. The frequency separation between the two main intensities gives the deuterium quadrupolar splitting (∆νQ). (B) Simulated 2H solid-state NMR spectrum of non-oriented POPC-d31 with the different quadrupolar powder pattern of 2H labelled CD2 and CD3 segments add up (left). The comparison of the measured quadrupolar splitting with that of static sample allows the determination of the different order parameters (SCD) which is plotted in a position-dependant manner (right). The structure of POPC-d31 with the corresponding deuterated CH2 and CH3 segments are represented. SCD increases with the packing (rigidity) of the lipid acyl chain. (C) The experimental quadrupolar echo spectra of POPC-d31 (black) and POPC-d31/SM C18 (kaki) recorded at RT, on a Bruker Advance 300MHz spectrometer (left). The order parameters were obtained from the ∆νQ extracted from 2H echo spectra (left) divided by a constant (167 kHz) and plot in a position dependent-manner ... 176 Figure 82: Comparison of 2H echo spectra acquired for lipid vesicles of (A) POPC-d31, (B) POPC-d31 /SM (95:5) either alone (full line) or in the presence of 1 mol% peptide (dash line) at 37°C, (C) The superimposition of all the spectra. The respective smoothed order parameter (SCD) profiles are shown to the right of the spectra ... 178
xxiii Lipids: PC: phosphatidylcholine POPC: 1-palmitoyl-2-oleoyl-sn-glycero-3-phosphocholine DPPC: di-palmitoyl-phosphatidylcholine POPG: 1-palmitoyl-2-oleoyl-sn-glycero-3-[phospho-rac-(1-glycerol)] POPE: 1-palmitoyl-2-oleoyl-sn-glycero-3-phosphoethanolamine POPS: 1-palmitoyl-2-oleoyl-sn-glycero-3-phospho-L-serine DOPC: 1,2-dioleoyl-sn-glycero-3-phosphocholine SM: N-octadecanoyl-D-erythro-sphingosylphosphorylcholine (Sphingomyelin) CL: cardiolipin Others:
NMR: Nuclear Magnetic Resonance ssNMR: solid state NMR
PAF: Principal Axis Frame
REDOR: Rotationnal Echo Double Resonnance MAS: Magic Angle Spinning
PISEMA: Spin Polarization Inversion Exchange at the Magic Angle MLV: multilamellar vesicle
SUV: small unilamellar vesicle CP: Cross-Polarization
CD: Circular Dichroism
Fmoc: 9-Fluorenylmethoxycarbonyl
HPLC: High Performance Liquid Chromatography RP-HPLC: Reverse Phase HPLC
CSA: Chemical Shift Anisotropy CS: Chemical Shift
ppm: parts per million LB: Lysogeny Broth
IPTG: IsoPropyl β-D-1-ThioGalactopyranoside
pTIPX-4: Taf12 Insoluble -mediated peptide eXpression FID: Free Induction Decay
PAGE: Polyacrylamide Gel Electrophoresis SDS: Sodium Dodecyl Sulfate
HRP: Horse Radish Peroxidase AP: Alkaline Phosphatase EtBr: Ethidium Bromide TFA: Tri-Fluoro-Acetic acid
MALDI-TOF: Matrix-Assisted Laser Desorption/Ionization-Time-Of-Flight LM : Linear Mode
xxiv MCS: Multiple Cloning Site
MBP: Maltose-Binding Protein SPPS: Solid Phase Peptide Synthesis DMF: N,N-dimethylformamide TMD: Trans Membrane Domain P/L: Protein/ lipid ratio
OD : Optical Density
DPC: n-dodécylephospholine
EDTA : EthyleneDiamineTetraacetic Acid
IMAC: Immobilized Metal Afiinity Chromatography DNA: Desoxyribonucleic Acid
1
GENERAL INTRODUCTION
This chapter is meant to give a general overview on biological
membranes, and highlights the features that distinguish them from
each other in terms of compositions and properties. As lipids
represent the basic element of these membranes, their synthesis and
sorting to the cellular plasma membrane are described here as well
as their physical chemical properties. Furthermore, this part also
emphasis on how lipids are used in model systems when we try to
make sensible emulations of in vivo systems because the complexity
of natural membranes hampers their biophysical investigation.
Moreover, the properties that trigger their interaction with proteins
within the membrane are also presented.
2
General Introduction
Chapter 1.
1.1. Generalities on biomembranes
Biological membranes are essential for life as they play a central role in both the structure and function of all cells, prokaryotic and eukaryotic, plant and animal. They define the boundaries of the cell and are the point of contact between the cell and its environment. They also define cellular compartments, like numerous membranous organelles in eukaryotic cells (Figure 1) Membranes do not only define compartments, they also play an important role in all communication between the cell and its environment. They provide specialized permeability barriers for cells and cell organelles, in which the interplay of lipids and membranes proteins facilitates basic cellular processes as ions exchange. Moreover, most of the fundamental biochemical functions in cells involve membranes at some point, including such diverse processes as prokaryotic DNA replication, protein biosynthesis, protein secretion, bioenergetics, and signal transduction.
The structure and organization of biomembranes have been a matter of debate until the late 1970s. For many years, biologists thought the protein covered the outer surfaces of the phospholipid bilayer like a coat of paint. The initial model for membrane structure was proposed by Davson and Danielli in 1935. It portrayed the membrane as a phospholipid bilayer coated on both sides by protein. Thereafter, Michael Robertson proposed in 1960 the Unit Membrane Hypothesis which suggests that all biological membranes have a similar basic structure. This was consistent with what researchers were learning about the structure of membrane proteins.In 1972, S. Singer and G. Nicolson revised the Davson and Danielli model in a simple but profound way and proposed a new model called the fluid mosaic model (Figure 2). It suggested that proteins are inserted into the lipid bilayer, with their nonpolar segments in contact with the hydrophobic interior of the bilayer and their polar portions protruding out from the membrane surface. The lipid bilayer supplies the backbone of the membrane, and proteins associated with the membrane are not fixed in regular positions instead they float in the fluid lipid bilayer with occasional occurrence of proteins in this lipid matrix. The lipids forming the bilayer are also assumed to be dynamic and are randomly distributed in the membrane. This model is widely accepted till this date. However, through several later studies this model became more complex with the discovery of membrane ordered domains (Presti, 1982; Somerharju, 1985; Virtanen, 1995) named “raft”. These domains have a specific lipids and proteins composition. They are rich in cholesterol and sphingomyelin and are detergent resistant (Simons and Ikonen, 1997; Mukherjee and Maxfield, 2000; London, 2002; McMullen T.P.W and al 2003; Dufourc E.J, 2008; Pike L.J, 2009). They are believed to have certain specific functions such as lipid composition regulation (Virtanen, 1998), protein binding and lipid protein interaction (Simons and Ikonen 1997), enzyme regulation (Somerharju, 1999), proteolysis (Brown and London, 1998), signal transduction (Simons and Toomre, 2000; Brown and London, 1998), and intracellular trafficking (Mukherjee and Maxfield, 2000).
3
Figure 1: Representation of eukaryotic cell with the complex organization of organelles imbibed in the cytoplasm. Extract from Becker W.M and al, 2003.
Figure 2: The fluid mosaic model of the plasma membrane proposed by Singer and Nicolson, in 1972. Extract from Biology of the cell, Part II chapiter 6.
4 1.2. Composition and organisation of biological membranes
This section gives an overview on biological membranes, their composition, how lipid components influence their physical properties and heterogeneity.
1.2.1. Membrane Components:
Biological membranes are composed of lipids, proteins and carbohydrates, with lipids as major component. Although lipids form most of the surface area of membranes, they account for only about 42% in weight for a typical human cell, while proteins account for roughly 55 wt% as they are much denser than lipids and carbohydrates for 3 wt%. The carbohydrates are generally bound either to the lipid or protein. In the cell membrane they are components of complex molecules such as proteoglycans, glycoproteins, and glycolipids.
Membrane Proteins: 1.2.1.1.
Proteins are large polymers of natural amino acids amide bonded to each other. Early studies into the mechanism of protein secretion established the endoplasmic reticulum (ER) as the site of secretory and membrane protein synthesis (Palade and Siekevitz, 1956; Siekevitz and Palade, 1958). Membrane proteins form key nodes in mediating the cell's interaction with his envinronment, which is one of the main reasons why the majority of drug targets are membrane proteins. They represent an estimated 50% of the modern drugs targets, whereas 20-30% of all genes in most genomes encode membrane proteins (Krogh et al., 2001). Moreover, 15 to 39% of the human proteome is dedicated to be membrane proteins (Ahram et al., 2006). In January 2013, less than 0.1% of protein structures determined were those of membrane protein, although the deposit structures in the Protein Data Bank (PDB) continuously increase (http://blanco.biomol.uci.edu/mpstruc/). Membrane proteins are involved in many important cellular processus for instance molecules transport, energy provision, signal transduction and they also provide mechanical support to the bilayer. Accordingly, a large proportion of membrane proteins can be assigned a function either as receptors, transporters, or enzymes.
The amounts and types of proteins in a membrane are highly variable. For example, in the myelin membrane, 25% of the membrane mass is protein while it is approximately 75% in mitochondrial membranes. A typical plasma membrane is somewhere in between, with protein accounting for about 50% of its mass. Depending on how they associate with the lipid bilayer, membrane proteins fall into two broad categories: integral and peripheral proteins. While integral membrane proteins contain transmembrane domains that interact with membrane lipids, peripheral membrane proteins are associated with membranes via GPI-anchores or non-covalent binding (Figure 3 A and B respectively). Most biological membranes contain both of these categories.
Integral membrane proteins, also called intrinsic proteins, have one or more segments that cross the phospholipid bilayer. Although some integral proteins can anchor to one of the membrane leaflets, the most common type of integral membrane are those which span the entire membrane. They contain one or more domains that span entirely the membrane as
5 well as domains extending into the aqueous medium on each side of the bilayer. Membrane-spanning or transmembrane domains (TMD) are found in the so-called transmembrane proteins. They contain residues with hydrophobic side chains that interact with fatty acyl groups of the membrane lipids, thus anchoring the protein to the membrane. This anchoring is steered both by hydrophobic interactions between the phospholipids and the TMD, and likely by the polar lipid headgroups. In all the transmembrane proteins examined to date, two types of membrane-spanning domains are defined: either with one or more α helices, or less commonly with multiple β strands. Among them, proteins containing seven membrane-spanning α helices form a major class that includes bacteriorhodopsin and many cell-surface receptors. Proteins with multiple β strands are often found in porins present in the outer membrane of gram-negative bacteria such as E.
coli.
The topology of transmembrane proteins can be describe by the number of segments passing through the membrane, as well as the orientation in the membrane (von Heijne, 2006) (Figure 3A) :
- Single pass TM proteins can be categorized as Type I or Type II, depending if their carboxy- terminus or their amino-terminus is positioned towards the cytosol, respectively
- Multi pass membrane proteins are divided in Type III and IV in which the multiple TMDs are present in a single polypeptide, or consist of several different polypeptide chains respectively. Type V proteins are anchored to the lipid bilayer through covalently linked lipids and Type VI through both TMDs and lipid anchors.
Peripheral membrane proteins, or extrinsic proteins, are weakly attached to the membrane and do not interact with the hydrophobic core of the phospholipid bilayer. Instead they are usually bound to the membrane either indirectly to integral membrane proteins or directly to the lipid bilayer. Their interactions with membranes mainly result on electrostatic forces with polar head groups of lipids or extending part of integral proteins. Thus, they are easily dissociated from membrane by changing of the pH or upon high salt concentrations. In contrary, integral membrane are removed from the membrane under chaotropic conditions such as > 6M urea or 6M guanidinium and the use of detergeant to disrupt the membrane.
6
Figure 3: The different type of membrane proteins and the ways they bind to lipid bilayers.
Adapted from (Alberts et al., 2002)
Membrane lipids: 1.2.1.2.
Lipids are the main constituent of biological membranes. They are amphipathic molecules that are hydrophilic on one side and hydrophobic on the other side. When brought into contact with water, most lipids spontaneously form bilayer membranes due to the propensity of there hydrophobic moieties to self-associate by minimizing interaction with water, and their hydrophilic moieties to interact with water and with each others. The typical thickness of this lipid bilayer is 5 nm with a continuous surface area of hundreds of square microns. Lipids that are found in cellular membranes can be categorized into three major classes: the glycerophospholipids (GPLs), spingolipids (SLs) and sterols.
GPLs are the predominant lipids in most eukaryotic and prokaryotic membranes, excluding archaebacteria (by). They consist of a glycerol-3-phosphate esterified with fatty acids at the C1 and C2 positions. The phosphoryl group at the C3 position in addition is attached to various group 'x' as shown in the figure 3A, leading to a number of different phosphatidyl lipids headgroup such as phosphatidylcholine (PC), ethanolamine (PE), serine (PS), -glycerol (PG), -inositol (PI) or the unmodified phosphatidic acid (PA). PC accounts for more than 50% of the GPLs in most eucaryotic membranes while in PE is abundant in procaryotic membranes. The esterified fatty acid at position C1 and C2 contains saturated or cis-unsaturated acyl chains of varying lengths. Acyl chains ranging from 16 to 20 are commonly found in plants and animals; among them palmitate (C16, saturated), stearate (C18, saturated) and oleate (C18, one double bond) are predominant. The type of the linkage to the glycerol backbone varied also (ester or ether bonds) (Figure 4A). For example plasmogens are phosphoglycerides present in myelin and in cardic sarcoplasmic reticulum (Gross, 1985) which have hydrocarbon chains that are linked via ether bond.
7 Cardiolipids is another important class of GPLs that are significantly present in inner membranes of mitochondria, choraplast membranes, and some bacterial membranes, but rarely in other membranes.
The second class of membrane lipids SL, is a derivative of spingosine (Figure 4B). The amide bounded fatty acid to spingosine results in ceramides from which most of SLs are formed.
The ceramide can be further modified with phosphochloline or glycans to form sphingomyelin (SM) and glycosphingolipids (GSLs), respectively. GSLs can be classified as cerebrocides (containing a head group with a single sugar unit) and gangliocides (ceramides attached with oligosaccharides that contain at least one sialic acid residue). SM is the major sphingolipid in the plasma membrane. It represents for example 1/3 of the total lipids in myelin that protect and electrically isolate neurons. SLs acyl chain can be saturated or tans-unsaturated. Both glycerophospholipids and spingolipids thus have a polar head group and non-polar tails made up of acyl chains.
Another important class of lipid in membranes are sterols. Cholesterol is by far, the most commonly represented sterol in PM. Sterols are compact and rigid hydrophobic entity made of a saturated tetracyclic nucleus, with a polar hydroxyl headgroup. It has a four-ring structure with 17 carbon atoms, to which two methyl groups and an iso-octyl side chain are attached (Figure 4C). Whereas cholesterol is the major sterol in animal plasma membranes, other sterols are found in plants (sitosterol, stigmasterol), in yeast and other eukaryotic microorganisms (ergosterol) and in bacteria (hapanoids, a sterol-like).
The proportion of these lipids varies with the type of cells (Table 1). The variation in headgroups and aliphatic chain contribute to create the variety of lipid species; up to thousands different species in eukaryotic cells (Coskun and Simons, 2011; Sud et al., 2007). Their repartition between organelles and the leaflets of the same membrane varies (Figure 5). To generate such a huge variety of lipid species varying in head group and fatty acyl chain composition, a considerable part of our genome is required in order to synthetize, metabolize, and regulate such a complex array of lipids. Cells invest about 5% of their genes to create this diversity (van Meer et al., 2008). The reason why cells build such a large repertoire of lipids and the role of their heterogeneous distribution between organelles is a continuous topic of research in membrane biochemistry. The difference in membrane lipid composition is the base of membrane heterogeneity in cells that plays an important role in cellular process such as membrane trafficking, cellular homeostasis, etc. For example, the gradient of cholesterol along the secretory pathway from the ER to the PM (van Meer et al., 2008), has been shown to regulate the sorting of proteins (Coskun and Simons, 2011; Kaiser et al., 2011; Nilsson et al., 2001; Sharpe et al., 2010). The membrane asymmetry is also due the uneven distribution of lipids but also proteins, between the leaflets of membrane bilayers. The parameters that are though to create and maintain this membrane heterogeneity will be presented later.