Effect of additives, heat treatment and mechanical deformations on hydrogen storage properties of BCC alloys
147
0
0
Texte intégral
(2)
(3)(4)
(5)
(6)
(7)
(8)
(9)
(10)
(11)
(12)
(13)
(14)
(15)
(16)
(17)
(18)
(19)(20)
(21)
(22)
(23)
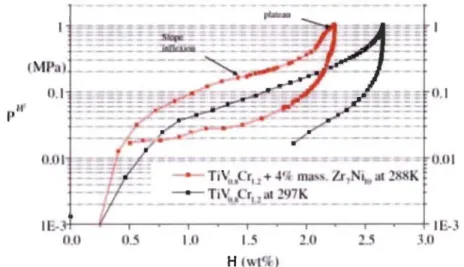
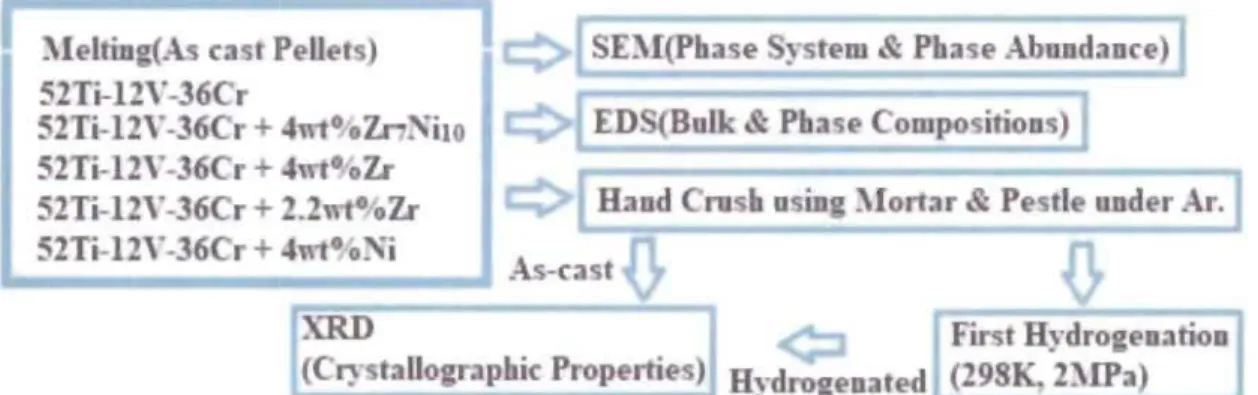
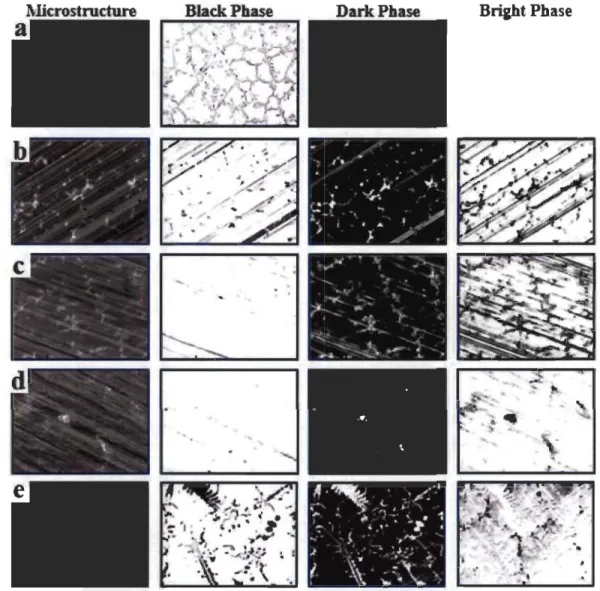
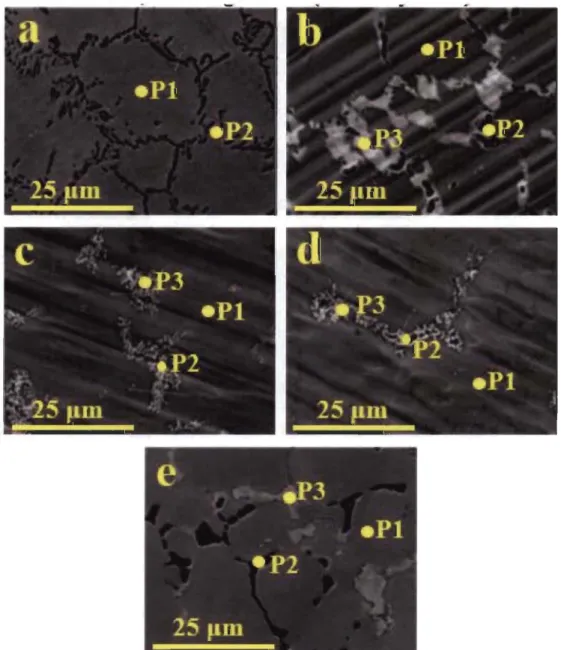
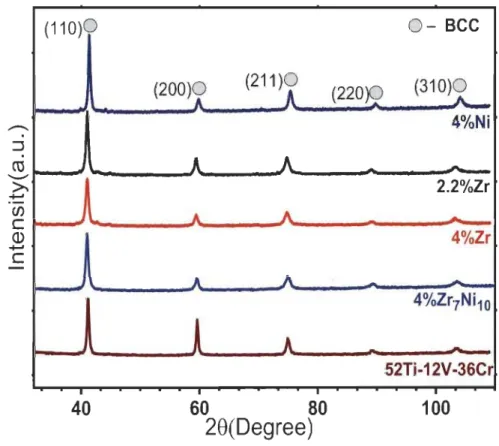
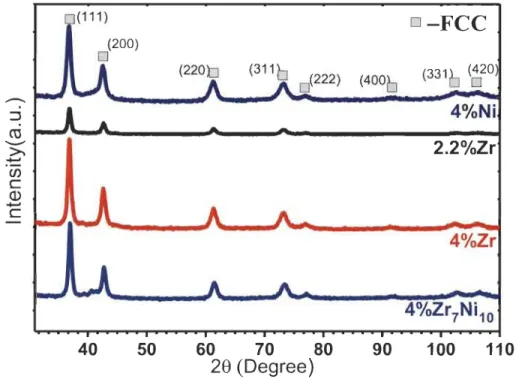
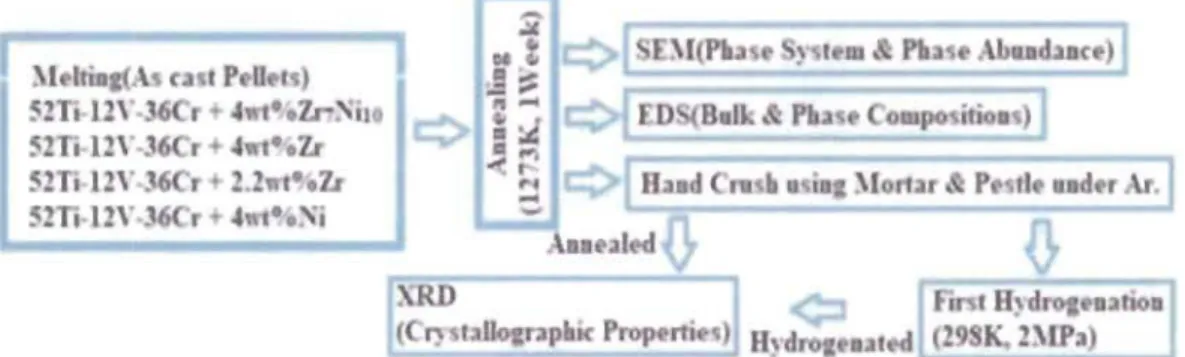
Figure

+7

Documents relatifs
Il en ressort que la majorité des femmes ont des connaissances médiocres et insuffisantes en matière de contraception: Seulement 40% des femmes ont appris leurs informations sur
Abstract: Duplex stainless steels 2205 are widely used in constructional and petrochemical applications because of their good mechanical and corrosion properties. The objective of
Boîte de liste orientée données pour afficher à l'exécution les valeurs trouvées dans les colonnes d'une autre table.. DBLookupCombo Boîte à options de référence de base
Effect of oil palm shell treatment on the physical and mechanical properties of lightweight concrete
Five different treatments were applied to the OPS, then their effects on the following properties of concrete were studied: apparent density, porosity accessible to water,
For each treated wood species, ANOVA analyses highlighted the fact that thermal modification process has a significant effect on the modulus of rupture of the heat treated
2 0 This will overestimate the value of reserves because this rental component of the price includes quasi rents from the investment/exploration phase (oil reserves
One first year ridge representative of the ridges characterized during a field program off West Coast Newfoundland in March 1999 is used to develop a comprehensive methodology for
S'intéresser à cet objet est d'autant plus pertinent qu'il nous semble que la gestion, en tant que processus spécifique de rationalisation porté par des principes, des acteurs,
