HAL Id: hal-00687945
https://hal.archives-ouvertes.fr/hal-00687945
Submitted on 10 May 2021
HAL is a multi-disciplinary open access
archive for the deposit and dissemination of
sci-entific research documents, whether they are
pub-lished or not. The documents may come from
teaching and research institutions in France or
abroad, or from public or private research centers.
L’archive ouverte pluridisciplinaire HAL, est
destinée au dépôt et à la diffusion de documents
scientifiques de niveau recherche, publiés ou non,
émanant des établissements d’enseignement et de
recherche français ou étrangers, des laboratoires
publics ou privés.
Distributed under a Creative Commons Attribution| 4.0 International License
Frontal and Subantarctic Zones of the Southern Ocean
François Fripiat, Karine Leblanc, Marc Elskens, Anne-Julie Cavagna, Leanne
Armand, Luc André, Frank Dehairs, Damien Cardinal
To cite this version:
François Fripiat, Karine Leblanc, Marc Elskens, Anne-Julie Cavagna, Leanne Armand, et al.. Efficient
silicon recycling in summer in both the Polar Frontal and Subantarctic Zones of the Southern Ocean.
Marine Ecology Progress Series, Inter Research, 2011, 435, pp.47-61. �10.3354/meps09237�.
�hal-00687945�
INTRODUCTION
Diatoms, eukaryotic unicellular microalgae with cell walls made of a composite of organic material and
silica (i.e. biogenic silica, bSiO2), are an ecologically
significant group since they (1) account for ~40% of the upper ocean biological carbon pump (Buesseler 1998, Jin et al. 2006, Hildebrand 2008) and (2) control the
oceanic silicon cycle through bSiO2production (P) and
dissolution (D) in surface waters (Tréguer et al. 1995). The relative importance of these 2 processes (D:P)
reg-ulates the ability of the system to export bSiO2, thereby
stripping silicic acid (Si[OH]4) from the surface ocean
and defining the silica pump efficiency, which in turn affects global biogeochemistry (Sarmiento et al. 2004). The variability of D:P in the surface ocean is large, with values ranging from as low as 0.1 to >1.0 (Nelson et al. 1995, Brzezinski et al. 2003, Beucher et al. 2004). This
© Inter-Research 2011 · www.int-res.com *Email: ffripiat@ulb.ac.be
Efficient silicon recycling in summer in both the
Polar Frontal and Subantarctic Zones of the
Southern Ocean
François Fripiat
1, 2,*, Karine Leblanc
3, Marc Elskens
4, Anne-Julie Cavagna
4,
Leanne Armand
5, Luc André
1, Frank Dehairs
4, Damien Cardinal
1, 61Geology and Mineralogy, Section of Mineralogy and Petrography, Royal Museum for Central Africa, 3080 Tervuren,
Belgium
2Department of Earth and Environmental Sciences, Université Libre de Bruxelles, 1050 Brussels, Belgium 3Aix-Marseille Université (CNRS – LOPB), UMR 6535, Laboratoire d’Océanographie Physique et Biogéochimique,
OSU/Centre d’Océanologie de Marseille, 13288 Marseille Cedex 09, France
4Earth System Sciences & Analytical and Environmental Chemistry, Vrije Universiteit Brussel, 1050 Brussels, Belgium 5Department of Biological Sciences, Faculty of Science, Macquarie University, New South Wales 2109, Australia
6Present address: Laboratoire d’Océanographie et du Climat: Expérimentations et Approches Numériques,
Université Pierre & Marie Curie, 75252 Paris Cedex 05, France
ABSTRACT: We measured biogenic silica (bSiO2) dissolution and production rates at 3 Southern
Ocean sites with contrasting biogeochemical regimes (SAZ-Sense cruise, January to February 2007). Two sites were located in the Subantarctic Zone (SAZ) southeast and southwest of Tasmania, and 1 site was in the Polar Frontal Zone (PFZ). The measurements were repeated 3 times within a time
frame of 4 to 7 d. In the PFZ and the western SAZ, the release of silicon from dissolving bSiO2,
follow-ing a productive period, appeared sufficient to entirely sustain Si demand in surface waters. Biogenic silica dissolution was more efficient in the SAZ, likely owing to stronger microzooplankton grazing
and bacterial activity. The degree of iron co-limitation correlated to bSiO2growth rates (VSi, d–1).
Highest rates were observed in the SAZ, southeast of Tasmania, a region influenced by iron-enriched East Australian Current water advecting through the Subtropical Front. The diatom communities appeared differently adapted and conditioned, in terms of uptake ability, for growth under low
Si(OH)4availability. Combining our results with existing bSiO2dissolution and production data, we
estimate a spring to summer net bSiO2production for the circumpolar SAZ and PFZ regions of 7.4 and
3.6 Tmol yr–1, respectively, representing 4.3 and 2.1% of the global net bSiO
2production for each
region. Furthermore, a clear seasonal pattern emerges with (1) higher bSiO2production in spring (0.9
to 12.7 and 6.8 to 60.7 mmol Si m–2d–1for the SAZ and PFZ, respectively) compared to summer (0.1
to 6.6 and 0.3 to 9.1 mmol Si m–2d–1for the SAZ and PFZ, respectively) and (2) a bSiO
2dissolution to
production ratio of <1 in spring (~0.4) and generally >1 in summer (~1.7).
KEY WORDS: Diatoms · Biogenic silica · Silicon cycle · Dissolution · Production · Southern Ocean
range suggests that silica recycling in the surface ocean is variable, which must impact on the efficiency of the silica pump. Brzezinski et al. (2003) suggested that there is a shift in the silicon cycle mode.
Dissolu-tion of bSiO2 supports either a small fraction of the
gross bSiO2production during diatom blooms (i.e.
effi-cient silica pump), or most of the gross bSiO2
produc-tion during non-bloom periods (i.e. inefficient silica
pump). Direct measurements of bSiO2dissolution rates
are scarce for the ocean (some 57 individual profiles to date; Ragueneau et al. 2000, Brzezinski et al. 2003, Beucher et al. 2004), mainly because the methodolo-gies used were time consuming (Nelson & Goering 1977a, Corvaisier et al. 2005). This has led to poor
knowledge of the processes driving bSiO2dissolution.
The effect of the efficiency of the biological pump (C, Si, N, P, ...) on global biogeochemistry is especially pro-nounced in the Southern Ocean (Sarmiento et al. 2004, Sigman et al. 2010). Regarding the silicon cycle, much more attention has been given to the southern
Antarc-tic Circumpolar Current where the bulk of the bSiO2
production occurs (see e.g. Pondaven et al. 2000, Brzezinski et al. 2001, Jin et al. 2006). However, the northern part of the Antarctic Circumpolar Current (including the Polar Frontal Zone [PFZ] and Subantarc-tic Zone [SAZ]) is of prime importance regarding the occurrence of nutrient leakage to lower latitudes (Sarmiento et al. 2004). The efficiency of the silica pump in the PFZ and SAZ directly affects the potential of the nutrient-advecting intermediate water masses to
fertilize low-latitude thermocline waters. The bSiO2
production and dissolution rates vary widely; ranging
from 0.2 to 60.7 and 0.2 to 5.8 mmol Si m–2d–1,
respec-tively, in the PFZ and from 0.0 to 3.05 and 0.4 to 5.2
mmol Si m–2 d–1, respectively, in the SAZ (Nelson &
Gordon 1982, Brzezinski et al. 2001, Quéguiner 2001, Quéguiner & Brzezinski 2002, Leblanc et al. 2002, Beucher et al. 2004). Up until now, results for only 4
bSiO2dissolution profiles have been published for the
SAZ, and 6, for the PFZ (Nelson & Gordon 1982, Brzezinski et al. 2001, Beucher et al. 2004). A better assessment of the variability of these production and dissolution rates is required to quantify (1) the impact of these areas on the global silicon budget and (2) the strength of the silicate pump in these regions.
The present study assessed summer bSiO2
produc-tion (both by 30Si and 32Si) and dissolution (30Si) in 3
biogeochemically contrasting environments of the SAZ and PFZ, south of Tasmania. The SAZ-Sense cruise objectives were to understand the mechanisms driving the observed zonal variability in chlorophyll biomass within the SAZ and between the SAZ and the PFZ (Bowie et al. 2011a). During the SAZ-Sense study it was shown by Herraiz-Borreguero & Rintoul (2011) that this variability was driven by the Tasman Outflow
and the East Australian Current (EAC) affecting the eastern SAZ. Through migrating eddies, interleaving at the Subtropical Front, the EAC provided the input of warm and salty subtropical waters that were also Fe enriched (Bowie et al. 2009, Lannuzel et al. 2011, Mongin et al. 2011). In contrast, in the western SAZ, regional circulation was dominated by northwestward circulation and a deep-reaching anticyclonic recircula-tion, with cooler and fresher waters resulting (Herraiz-Borreguero & Rintoul 2011). Despite this fertilization
and the resulting higher chlorophyll a (chl a)
concen-trations, in summer the eastern SAZ region was only marginally more productive (Cavagna et al. 2011) and exported less particulate carbon (Jacquet et al. 2011) than the western SAZ and PFZ regions, which both exhibited lower biomasses.
MATERIALS AND METHODS
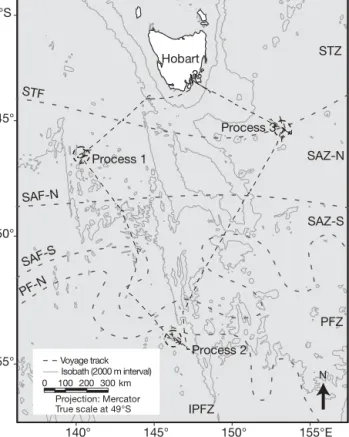
Oceanographic settings and sampling strategy.The SAZ-Sense cruise track (21 January to 19 February 2007, RV ‘Aurora Australis’) followed a diamond-shaped grid in the Australian sector of the Southern Ocean, south of Tasmania (Fig. 1). Three process stations were selected on the basis of their contrasting hydrodynamics, physicochemical and ecosystem char -acteristics. The objective was to occupy a station for 6 to 8 d to conduct process studies with incubation experiments and to replicate sampling over several days. Process Station 1 (P1, 46.3° S, 140.6° E; 22 to 29 January 2007) was located in northwestern SAZ waters, Process Station 2 (P2, 54.0° S, 145.9° E; 1 to 6 February 2007) was in the PFZ, and Process Station 3 (P3, 45.5° S, 153.2° E; 10 to 15 February 2007) was located in a highly dynamic region at the northernmost edge of the eastern SAZ. P3 was enriched in iron (Lan-nuzel et al. 2011). These observations agreed well with simulated iron supply (Mongin et al. in press), which indicated that increased iron concentrations at P3 were due to both seasonal delivery from southward advec-tion of iron-rich subtropical waters (driven by the EAC) and to the dissolution of trace elements from wind-blown dust deposition off the Australian continent (Bowie et al. 2011a).
30Si incubations were performed at process stations
on 3 different days to cover short-term temporal
vari-ability. 32Si incubations were performed
simultane-ously (same CTD casts) with short-term 13C and 15N
incubations (Cavagna et al. 2011) and bacterial pro-duction/activity measurements (Dumont et al. 2011). Rates were determined at 4 depths corresponding to 100, 50, 25 and 1% of PAR (photosynthetic active radi-ation) light depths. Polycarbonate incubation bottles (4 l) were wrapped in neutraldensity screens simula
-ting incoming irradiance and were incubated for 24 h (t24) and 48 h (t48) at local surface water temperature in a flow-through, on-deck incubator.
Production and dissolution rates of bSiO2. Seawater
was spiked with 30Si-enriched solution (99.62%,
Chemgas; Nelson & Goering 1977a,b). The production
rate of bSiO2was assessed from the change in isotopic
composition of the particulate phase (increase in 30Si).
The bSiO2 dissolution rates were assessed from the
increase in 28Si in the dissolved phase, which resulted
from the dissolution of the initial bSiO2. For each light
level, 8 l of seawater were collected in a polycarbonate bottle; 2 l were then filtered immediately to serve as the natural abundance reference for sample bracket-ing durbracket-ing isotopic analysis back at the home labora-tory (see below, this section, and Fripiat et al. 2009).
The remaining 6 l were spiked with 30Si and
homoge-nized. A second 2 l aliquot was filtered for the initial conditions after spike addition, and the remaining vol-ume was incubated in a 4 l polycarbonate bottle. After 24 h (t24) of incubation, a 2 l subsample was filtered, and the final 2 l was filtered after 48 h (t48).
It is common experimental practice to limit the 30
Si-spike addition to <10% of the initial concentration, so that the system is not excessively perturbed (Nelson & Goering 1977a,b). Nevertheless, 12 of our 36 incuba-tions had a tracer addition of between +10% and + 20%, and 1, of more than + 30%. However, as shown
later, the high degree of consistency between 30
Si-uptake results and 32Siuptake results for which Si ad
-ditions were always <10% suggests that results have
not been biased by over-addition of 30Si (see ‘Results —
Comparison between t24 and t48 and uptake rates from 32Si and 30Si methods’).
Si(OH)4was analyzed on board using a segmented
flow auto-analyzer (Lachat Quickchem Series 8000
FIA), and bSiO2 was filtered (2 l) onto polycarbonate
membranes (47 mm diameter Nuclepore filters, 0.4 μm porosity). These were dried at 60°C and stored at room
temperature. On return to the laboratory, bSiO2 was
digested during a 1-step process (adapted from Rague-neau et al. 2005) using 0.2 M NaOH and heating at 100°C for 40 min. Digests were subsequently
neutral-ized with 1 M HCl. The bSiO2 concentrations were
determined colorimetrically using a spectrophotometer (Genesys 10S UV) following the procedure of Grass -hoff et al. (1983).
For assessing the 30Si atomic percent of Si(OH)
4
(iso-topic abundance) we applied a preconcentration proto-col adapted from the MAGIC method (adapted
accord-ing to Karl & Tien 1992). The Si(OH)4 present in 1 l
of filtered seawater was scavenged by a brucite
(Mg[OH]2) precipitate obtained by increasing pH with
a 14 μM NaOH solution (1 ml l–1). The Mg(OH)
2
precip-itate was dissolved with 3 μM HCl (4.3 ml). This
pre-concentration step increases the Si(OH)4:salinity ratio
of the samples in a step considered beneficial for inductively coupled plasma–mass spectrometry (ICP-MS) analysis, as highly saline solutions may clog the plasma interface (Fripiat et al. 2009). Regardless,
mixed layer Si(OH)4concentrations were still very low
during the SAZ-Sense cruise (< 2.8 μmol l–1; except for
the 1% PAR depth at P2) to allow for direct analysis of the isotopic abundance without prior purification (dilu-tion of the preconcentrated solu(dilu-tion is too low; Fripiat et al. 2009). Therefore, we removed the saline matrix from all samples by cation-exchange chromatography (BioRad cation exchange resin DOWEX 50W-X12 [200
to 400 mesh] in H+form) using a protocol adapted from
Georg et al. (2006). The Si species do not bind to the resin, which effectively retains most seawater cationic species. The method allowed for the complete recovery of Si.
Purified Si(OH)4 samples and digested bSiO2
solu-tions were diluted to ~100 ppb Si in double-distilled
0.65% HNO3and analyzed for 30Si isotopic abundance
(in 30Si at.%, = 100% [30Si] / ([28Si] + [29Si] + [30Si])), by
? Process 1 Process 3 Process 2 Hobart 155°E 150° 145° 140° 40°S 45° 50° 55° N Voyage track Isobath (2000 m interval) km 0 100 200 300 Projection: Mercator True scale at 49°S STF SAF-N SAF-S PF-N STZ SAZ-N SAZ-S PFZ IPFZ
Fig. 1. SAZ-Sense voyage track (dashed line) and station loca-tions (from de Salas et al. 2011). STZ: Subtropical Zone; STF: Subtropical Front; SAZ-N: Northern Subantarctic Zone; SAF-N: North Subantarctic Front; SAZ-S: Southern Subantarctic Zone; SAF-S: South Subantarctic Front; PFZ: Polar Frontal Zone; PF-N: North Polar Front; IPFZ: Inter-Polar-Frontal Zone;
high resolution–sector field –ICP-MS (HR-SF-ICP-MS, ELEMENT2; Thermo) in wet plasma (Fripiat et al. 2009). The instrumental mass bias was corrected by the standard bracketing methodology. As described above, the standard consists of an unspiked sample treated in the same way as the spiked samples, thus avoiding any matrix effect. Each analysis was
dupli-cated, and the reproducibility of 30Si isotopic
abun-dance (at.%) was better than 1% (relative standard deviation). This method is much easier and faster than methods using an isotope ratio mass spectrometer (Nelson & Goering 1977a) or a quadrupole thermal ion-ization mass spectrometer (Corvaisier et al. 2005).
The production (= Si-uptake at such incubation time
scale) and dissolution rates of bSiO2 (respectively,
ρuptake and ρdiss) were calculated using a model. We
tested the linear 1-compartmental model developed for assessing production (Nelson & Goering 1977a) and dissolution (Nelson & Goering 1977b) and the non-lin-ear 2-compartmental model developed by Elskens et
al. (2007). The classical approach for assessing bSiO2
production and dissolution following the linear 1-com-partmental model is derived as follows:
(1)
where C represents either bSiO2or Si(OH)4
concentra-tions, æC is the 30Si isotopic abundance in excess (by
subtracting the natural 30Si isotopic abundance) either
of bSiO2or Si(OH)4and ρ is either the bSiO2production
or dissolution fluxes. By integration of the differential
equation associated with this model, the bSiO2
produc-tion and dissoluproduc-tion can be solved as follows:
(2)
(3)
with t0and tfrepresenting the initial and final
incuba-tion times. The mass and isotopic balance operating during the course of the incubation is not taken into account in the 1-compartmental model. In the 2-com-partmental model, parameters are constrained by the requirement to fit mass and isotopic balances of dis-solved and particulate phases (Elskens et al. 2007). It is derived as follows:
(4) The important features of the 2-compartmental model are that (1) all Si atoms that leave the dissolved
phase appear as bSiO2and (2) all Si atoms that leave
bSiO2appear as Si(OH)4. The latter model takes into
account any isotopic dilution and concentration changes occurring over the course of the incubation,
which, when ignored, may induce significant bias (Elskens et al. 2007). The 2 models have been tested on the SAZ-Sense data and are compared in the section ‘Results — Choice of model’.
Si-uptake estimates from 30Si and 32Si methods were
compared for most of the incubation experiments (32
out of 36). For the 32Si method, 275 ml seawater
sam-ples were spiked with 800 Bq of radioactive 32Si isotope
(32Si[OH]
4, specific activity 19.97 KBq μg–1 Si;
corre-sponding to an addition of Si of 0.006 μmol l–1sample–1)
produced by the Los Alamos laboratory (Tréguer et al. 1991) and incubated for 24 h in the same deck
incuba-tors used for 30Si. After 24 h, the samples were filtered
(0.4 μm porosity, polycarbonate membranes) and filters were stored in PE scintillation vials at ambient
temper-ature until analysis.32Si-uptake rates were assessed by
measuring the retained radioactivity in Cerenkov counting (Bq, number of disintegrations per second) on the filters using a Packard 1600-TR scintillation counter (Tréguer et al. 1991) and the following model described in Brzezinski et al. (1997):
(5)
Since dissolving bSiO2has a negligible 32Si
radioac-tivity, the dissolution of bSiO2 in the 32Si-enriched
Si(OH)4pool (high specific activity) does not affect its
radioactivity (number of disintegration per second). For this reason, there are no significant biases induced by the choice of a model for production fluxes
calcu-lated using the 32Si method, in contrast to those
calcu-lated by 30Si with the 1-compartmental model de
-scribed above. The relative precision of 32Si-uptake
rates is 10%, similar to the 30Si method.
The specific Si-uptake rate (VSi; d–1) gives the
frac-tion of the bSiO2pool produced in 1 d as follows:
(6)
From Eq. (4) we can calculate the doubling time (Td;
d–1) assuming exponential growth:
(7)
RESULTS
Accuracy of the bSiO2production and dissolution rates
Detection limit of the bSiO2dissolution rate
No significant variations in the 30Si Si(OH)
4atomic
percent were observed over the various durations encompassed by the different incubation experiments conducted in the eastern SAZ, or for the last
incuba-ρprod bSiO ( ) Si(OH) ( ) 2 æ æ bSiO 2 f 4 0 = t ⋅ ⋅ t t [ ] ρdiss Si(OH) ( ) Si(OH) ( ) Si(OH) ( ) æ æ æ 4 0 4 f 4 0 = t − ⋅ t t tt ⋅[ ] Si(OH)4 Si(OH) æSi(OH) , æ , æ 4
prod Si(OH)4 diss
4
[ ]
(
,)
(ρ ) (−ρ bbSiO2 bSiO æbSiO2) , ←⎯⎯⎯⎯⎯⎯⎯⎯⎯ [→
(
2])
ρprod bSiO Total Bq Bq Si(OH) 2 = ⋅t⋅[ 4] VSi prod 2 bSiO =[
]
ρ Td Si = ln 2( ) V ( , , ρ æ) C æ ⎯⎯⎯→(C )tion experiment in the western SAZ. The results
indi-cate bSiO2 dissolution in these experiments was too
small to be detected. Larger 30Si-spike additions, as in
Brzezinski et al. (2001), would have increased the sensitivity of the method. Unfortunately, such experi-ments were not performed on board during the SAZ-Sense study. To improve the sampling strategy in the
future, the detection limit for 28Si-isotopic dilution
was estimated by solving the mass and isotopic bal-ance for incubations where the difference between
initial and final 30Si-isotopic abundances were set at
1% (~1 relative standard deviation analytical
preci-sion; Fripiat et al. 2009) (Fig. 2). The bSiO2
produc-tion and concentraproduc-tion had no significant influence on
the detection limit of bSiO2dissolution. We tested the
effect of the Si(OH)4 concentration (from 0.25 to
6 μmol l–1) and initial Si(OH)
4 30Si-isotopic
abun-dances (12 ± 6 at.% 30Si, i.e. a spike addition of ~10 ±
5%). The detection limit of the bSiO2dissolution rate
as a function of Si(OH)4concentration follows a linear
relationship. The detection limit of the bSiO2
dissolu-tion rate (μmol Si l–1) for a 10% spike addition was
determined at 0.014 × [Si(OH)4] (μmol l–1). The
detec-tion limit for the eastern SAZ (P3) experiments and the final experiment in the western SAZ (P1) was
estimated at ~0.010 μmol Si l–1d–1.
Choice of model
In order to assess the discrepancy between the observations (yi) and the model counterparts (xi) for the
4 parameters used ([Si(OH)4], [bSiO2], 30SibSiO2isotopic
abundance and 30Si
Si(OH)4 isotopic abundance), the
residual (yi– xi) needs to be transformed to a common
scale by the standardized residual (SRi) approach
(Elskens et al. 2007):
(8)
where σi represents the relative standard deviation
expected for each parameter. Thus, SRirepresents the
deviation of the modeled value from the measurement value normalized by the expected uncertainty of the parameter. Considering the complete set of sampling treatments and analyses, we consider relative standard
deviations of 2, 7 and 1% for [Si(OH)4], [bSiO2], and
30Si-isotopic abundances, respectively. Compared to
the initial methodology published in Fripiat et al. (2009), estimates of the standard deviations were
fur-ther refined using data acquired for 42 triplicate 30Si
incubations during the BONUS-GoodHope cruise (RV ‘Marion Dufresne’ in 2008) (Fripiat 2010). In cases where the model successfully describes the main fea-tures of the uptake and dissolution processes, it was
expected that SRiscores for each parameter would be
symmetrically distributed around a mean of zero and < 3, i.e. < 3 times the expected standard deviation (Elskens et al. 2007).
The 2 models (see ‘Materials and methods —
Pro-duction and dissolution rates of bSiO2’) fit the ideal
zero-centered distribution (Fig. 3), even though the 2-compartmental model appears to more adequately describe the mass and isotopic balance than the
1-compartmental model. Only SRiscores for incubations
where bSiO2 dissolution rates were above the
detec-tion limit are shown in Fig. 3 (see ‘Results — Detecdetec-tion
limit of the bSiO2dissolution rate’). At t48 the models
do not perfectly fit the zero-centered distribution, but generally the outcomes still fit within the expected
experimental uncertainties, except for æSi(OH)4 in the
compartmental model (Fig. 3b). Generally, the 1-compartmental model yielded acceptable results, but
the SRi scores were always better under the
2-com-partmental model. Therefore, the uptake and dissolu-tion rates calculated with the 2-compartmental model will be discussed. Note that actual measurements of
bSiO2and Si(OH)4concentrations (and not optimized
contents recalculated from the models) are used in both the model and discussion.
Comparison between t24 and t48 and uptake rates from 32Si and 30Si methods
Si-uptake rates estimated at t24 and t48 were not
sig-nificantly different (Table 1; slope = 1.01 ± 0.03, R2=
0.94, n = 36, p < 0.01). Si-uptake estimated via 30Si and
32Si methods were also compared for the complete set
of incubations (Table 1). A good correlation for the
SRi i i i = − ⋅ y x 2σ Si(OH)4 (µmol Si l–1) 0 1 2 3 4 5 6
Isotopic dilution detect
ion lim it (µm o l Si l –1 d –1 ) 0.00 0.05 0.10 0.15 0.20 t0 atom 12% 30Si-Si(OH) 4 t0 atom 6% 30Si-Si(OH) 4 t 0 atom 18% 30Si-Si(OH) 4 P1 P2 P3
Fig. 2. Detection limit of 28Si-isotopic dilution for measuring
biogenic silica (bSiO2) dissolution as a function of Si(OH)4
con-centration and 30Si spike addition. Circles represent the
SAZ-Sense dataset. The continuous line represents the detection limit for a 10% spike addition; the dashed lines show ± 5%. P1,
whole data set between the 2 methods was obtained (slope = 0.96 ± 0.06, R2= 0.85, n = 32, p < 0.01). At P3,
however, 32Si-uptake rates exceeded 30Si-uptake rates,
yet the former uptake rates were still very low
(<12 nmol Si d–1; Table 1). At this station, bSiO
2
con-centrations of 30Si-spiked incubations were
systemati-cally higher than for 32Si samples (0.025 ± 0.004 [1 SD]
and 0.016 ± 0.001 [1 SD] μmol l–1, respectively,
Mann-Whitney rank sum test, p < 0.001), suggesting possible Si-contamination. Any contamination with Si having natural isotopic composition would have decreased the
final 30Si-isotopic abundance of bSiO
2, thereby leading
to an underestimation of the true Si-uptake.
The bSiO2 dissolution rates from t24 and t48 were
also very similar (Table 1; slope = 0.91 ± 0.05, R2= 0.86,
n = 35, p < 0.01, 1 outlier excluded). The outlier
repre-sents the deep bSiO2maximum at P2 in the PFZ (Cast
58, 1% PAR), where bSiO2 dissolution at t24 largely
exceeded dissolution at t48. For the deep bSiO2
maxi-mum at P2, the t48 30Si-uptake was closer to t24 32
Si-uptake and achieved a better SRiscore than the 30
Si-uptake at t24 (not shown).
To summarize, the following results will be used in the discussion (Table 1): (1) Si-uptake rates are based
SR i sco re –6 –4 –2 0 2 4 6 –6 –4 –2 0 2 4 6 a b c d bSiO 2 Si(OH) 4 æSi(OH) 4 æbSiO 2 bSiO 2 Si(OH) 4 æSi(OH) 4 æbSiO 2
Fig. 3. SRi scores for the 1-compartmental model for (a) t24
and (b) t48 and for the 2-compartmental model for (c) t24 and (d) t48. Only values where bSiO2 dissolution is above the
detection limit are shown (see ‘Results — Detection limit of the bSiO2dissolution rate’). Si(OH)4, bSiO2, æSi(OH)4and æbSiO2are
silicic acid and biogenic silica concentrations, and 30Si isotopic
abundance in excess for silicic acid and biogenic silica, respectively. The boxes, whiskers and symbols cover the 25th to 75th, the 10th to 90th and the 5th to 95th percentiles,
respectively µmol Si l–1 d–1 0.00 0.05 0.10 0.15 0.20 0 20 40 60 80 0.00 0.02 0.04 0.06 0.08 0.10 0 10 20 30 40 bSiO2 dissolution Si-uptake 0.00 0.02 0.04 0.06 0.08 0.10 Dept h ( m ) 0 10 20 30 40 50 60 1st sampling 2nd sampling 3rd sampling 0.0 0.2 0.4 0.6 0.8 1.0 0 P1 P2 P3 10 20 30 40 50 60 µmol l–1 0 1 2 3 4 5 6 0 20 40 60 80 [Si(OH)4] [bSiO2] 0.0 0.2 0.4 0.6 0.8 1.0 0 10 20 30 40
a
b
c
d
e
f
Fig. 4. (a,b,c) Vertical distribution of Si(OH)4and bSiO2(μmol l–1) and (d,e,f) bSiO2production and dissolution (μmol Si l–1d–1) in
the euphotic layer (100–50 to 25–1% photosynthetically active radiation). Process 1 (P1, western SAZ) is shown in Panels a and d, Process 2 (P2, PFZ) is shown in Panels b and e, and Process 3 (P3, eastern SAZ) is shown in Panels c and f. PFZ: Polar Frontal
on results from t24 incubation experiments, except (a) for the deep (1% PAR) P2 samples for which results from t48 incubations were used and (b) for P3 samples
with uptake results deduced from 32Si experiments;
and (2) bSiO2 dissolution rates were based on results
from the t24 incubation experiments, with the
excep-tion of the deep P2 samples (1% PAR) where dis
-solution results were based on results from the t48 incubations.
Production and dissolution of bSiO2across the
SAZ-Sense data
The mixed layer in the western SAZ (P1) had lower
and more variable Si(OH)4 concentrations (0.38 ±
0.28 μmol l–1) than in the eastern SAZ (P3; 0.78 ±
0.08 μmol l–1) and the PFZ (P2; 0.74 ± 0.13 μmol l–1),
both stations having indistinguishable Si(OH)4
concen-trations (Fig. 4a,b,c). Kruskal-Wallis 1-way analysis Station Cast PAR Depth Temp. Si(OH)4 bSiO2 ρuptake (30Si) ρuptake(32Si) ρdiss(30Si) VSi Vdiss
sampling no. (%) (m) (°C) (μmol l–1) (μmol l–1) (μmol l–1d–1) (μmol l–1d–1) (μmol l–1d–1) (d–1) (d–1)
date 2007 30Si 32Si t24 t48 t24 t24 t48 Process 1 22 Jan 9 100 5 13.1 0.16 0.176 0.200 0.039 na 0.044 0.075 0.088 0.22 0.43 50 10 13.0 0.13 0.184 0.210 0.046 na 0.033 0.057 0.091 0.25 0.31 25 17 12.9 0.13 0.174 0.205 0.047 0.031 0.019 0.021 0.041 0.27 0.12 1 50 12.1 0.47 0.295 0.295 0.020 0.021 0.036 0.040 0.036 0.07 0.14 24 Jan 17 100 5 12.8 0.10 0.109 0.126 0.029 0.029 0.033 0.020 0.020 0.26 0.18 50 10 12.8 0.10 0.105 0.131 0.017 0.015 0.021 0.021 0.012 0.16 0.20 25 15 12.8 0.10 0.085 0.076 0.016 0.018 0.026 0.020 0.011 0.19 0.23 1 50 11.3 0.60 0.118 0.168 0.015 na 0.015 0.017 na 0.13 0.14 29 Jan 34 100 5 11.3 0.65 0.016 0.026 0.003 0.003 0.001 0.000 0.000 0.18 na 50 10 11.3 0.70 0.020 0.025 0.003 0.004 0.001 0.002 0.000 0.16 na 25 15 11.3 0.71 0.017 0.025 0.001 0.000 0.001 0.001 0.000 0.04 na 1 50 11.3 0.71 0.016 0.025 0.001 0.001 0.003 0.000 0.000 0.08 na Process 2 2 Feb 42 100 5 5.4 0.88 0.702 0.774 0.049 0.057 0.065 0.027 0.022 0.07 0.04 50 12 5.4 0.89 0.777 0.858 0.040 0.046 0.057 0.040 0.011 0.05 0.05 25 24 5.4 0.90 0.852 0.980 0.060 0.068 0.044 0.025 0.020 0.07 0.03 1 80 2.2 5.60 2.768 2.703 0.074 0.067 0.064 0.217 0.182 0.02 0.07 3 Feb 47 100 10 5.3 0.73 0.909 0.508 0.046 0.050 0.044 0.027 0.026 0.05 0.03 50 20 5.3 0.73 0.817 0.392 0.037 0.043 0.050 0.032 0.024 0.05 0.04 25 30 5.3 0.72 0.782 0.392 0.038 0.039 0.027 0.032 0.043 0.05 0.04 1 80 2.2 5.12 3.098 3.036 na 0.062 0.046 0.087 0.113 0.02 0.04 6 Feb 58 100 10 5.2 0.62 0.450 0.277 0.017 0.015 0.016 na 0.023 0.04 0.05 50 20 5.2 0.57 0.418 0.277 0.011 0.009 0.014 0.023 0.009 0.03 0.06 25 30 5.2 0.61 0.412 0.323 0.013 0.010 0.013 na 0.068 0.03 0.17 1 80 3.5 1.98 1.310 1.549 0.014 0.023 0.027 0.364 0.092 0.02 0.07 Process 3 12 Feb 81 100 5 13.6 0.70 0.029 0.016 0.001 0.005 0.010 0.001 0.004 0.60 na 50 10 13.6 0.70 0.028 0.016 0.001 0.003 0.009 0.001 0.005 0.56 na 25 15 13.3 0.67 0.029 0.016 0.004 0.001 0.010 0.000 0.008 0.64 na 1 30 12.6 0.68 0.028 0.016 0.002 0.002 0.007 0.002 0.004 0.42 na 13 Feb 85 100 5 13.3 0.76 0.025 0.014 0.003 0.004 0.012 0.003 0.003 0.87 na 50 10 13.4 0.75 0.022 0.016 0.003 0.006 0.010 0.001 0.000 0.59 na 25 15 13.6 0.74 0.022 0.016 0.003 0.007 0.008 0.001 0.001 0.49 na 1 30 12.3 0.86 0.018 0.015 0.001 0.001 0.003 0.000 0.001 0.18 na 15 Feb 96 100 5 13.6 0.85 0.025 na 0.003 0.006 na 0.004 0.003 na na 50 10 13.6 0.89 0.025 na 0.004 0.005 na 0.004 0.000 na na 25 15 13.6 0.88 0.022 na 0.001 0.002 na 0.001 0.000 na na 1 30 13.0 0.87 0.022 na 0.001 0.002 na 0.001 0.002 na na
Table 1. [Si(OH)4], [bSiO2], Si-uptake (ρuptake, both with 30Si and 32Si), bSiO2dissolution (ρdiss) for each cast of each process station.
The italic values for bSiO2dissolution are below the detection limit (see section ‘Detection limit of the bSiO2dissolution rate’).
PAR: photosynthetically active radiation; na: not available. Bold values for bSiO2concentration, ρuptake, and ρdissare the ones used
indicated that the 3 stations are significantly different (p < 0.001). Dunn’s post hoc comparison indicated that,
indeed, the western SAZ Si(OH)4 concentration was
significantly lower (p < 0.05) than those of the the east-ern SAZ and PFZ, which were similar (p > 0.05). The
Si(OH)4 concentration in the SAZ subsurface layers
was rather uniform, though showing a slight increase
with depth ([Si(OH)4] at 400 m ≈ 5 μmol l–1; Fig. 4a,b).
In contrast, a large vertical gradient was observed in the PFZ ([Si(OH)4] at 400 m ≈ 70 μmol l–1; Fig. 4c).
The mixed layer bSiO2concentrations were highest
in the PFZ (0.68 ± 0.20 μmol l–1), intermediate in the
western SAZ (0.11 ± 0.09 μmol l–1), and lowest in the
eastern SAZ (0.02 ± 0.00 μmol l–1; Fig. 4a,b,c).
Kruskal-Wallis 1-way analysis confirmed that there is a differ-ence among the stations (p < 0.001). Nevertheless, Dunn’s post hoc comparison indicated that the value in the PFZ was significantly higher (p < 0.05) than those in the eastern and western SAZ, which were similar
(p > 0.05). In the PFZ, below the mixed layer, a bSiO2
maximum (2.39 ± 0.95 μmol l–1) was associated with a
subsurface chl a maximum. This is a recurrent feature
in this area (Parslow et al. 2001, Quéguiner 2001).
As observed from the bSiO2 concentration results,
the mixed layer Si-uptake (ρSi) was highest in the PFZ
(0.035 ± 0.017 μmol l–1d–1), intermediate in the western
SAZ (0.020 ± 0.017 μmol l–1d–1), and lowest in the
east-ern SAZ (0.008 ± 0.003 μmol l–1 d–1; Fig. 4d,e,f).
Kruskal-Wallis 1-way analysis indicated that there is a significant difference among the 3 stations (p = 0.001). According to Dunn’s post hoc comparison, the signifi-cant difference is between the PFZ and eastern SAZ (p < 0.05). In the PFZ, a slight increase in the Si-uptake
rate coincided with the bSiO2maximum (0.051 ± 0.024
μmol l–1d–1), although this increase was not significant
when contrasted with the large increase in the bSiO2
concentration. Our integrated Si-uptake rates are indistinguishable from results previously published for the SAZ and PFZ (Fig. 5; Caubert 1998, Brzezinski et al. 2001, Quéguiner 2001, Leblanc et al. 2002, Beucher et al. 2004). We are unaware of any study reporting Si-uptake rates for other naturally iron-fertilized SAZ areas similar to those encountered at P3 (see Bowie et al. 2009, Lannuzel et al. 2011).
During the SAZ-Sense study, specific Si-uptake rates
(VSi; d–1) varied widely between the studied sites
(Fig. 6a; Eq. 6). The occurrence of such a gradient of specific Si-uptake rates has also been observed by oth-ers along 2 transects, with rates increasing from 0.01 to
0.40 d–1between the PFZ and STZ (Quéguiner 2001,
Leblanc et al. 2002). Specific uptake rates at the differ-ent SAZ-Sense sites, on the contrary, remained quite
uniform over time — PFZ: 0.02 to 0.07 d–1with a
dou-bling time from 10 to 40 d; western SAZ: 0.04 to 0.27
d–1 with a doubling time from 3 to 17 d; and eastern
SAZ: 0.18 to 0.87 d–1with a doubling time from 1 to 4 d.
The values in the eastern SAZ were especially high for the Southern Ocean, compared to published results of
specific uptake rates, which do not exceed 0.32 d–1
(Nelson & Gordon 1982, Brzezinski et al. 2001, Quéguiner 2001, Leblanc et al. 2002, Beucher et al. 2004).
Across the SAZ-Sense area, bSiO2 dissolution (i.e.
ρdiss) generally exceeded, or was slightly lower, than
production (Fig. 4d,e,f). The mixed layer bSiO2
dissolu-tion rates were similar (Mann-Whitney rank sum test,
p = 0.27) between the PFZ (0.033 ± 0.014 μmol Si l–1d–1)
Cast 9 Cast 17 Cast 34 Previous studies
Cast 42 Cast 47 Cast 56 Previous studies
Cast 81 Cast 85 Cast 96 Previous studies 0
2 4 6 8
Si-uptake = bSiO2 production Si bSiO2 dissolution D:P mmol S i m –2 d –1 0 2 4 6 8 0.00 0.05 0.10 0.15 0.20 0.25 0.30 a b c
Fig. 5. Integrated (100 to 1% photosynthetically active radia-tion) Si(OH)4uptake (i.e. bSiO2production) and bSiO2
dissolu-tion rates, and dissoludissolu-tion:producdissolu-tion ratios (D:P). Panels a, b, and c represent P1 (western SAZ), P2 (PFZ), and P3 (eastern SAZ), respectively. Previous studies show the summer values of earlier studies for each area (Caubert 1998, Brzezinski et al. 2001, Quéguiner 2001, Leblanc et al. 2002, Beucher et al. 2004). PFZ: Polar Frontal Zone; SAZ: Subantarctic Zone. Val-ues for Cast 96 were below detection limit, and no previous
and the western SAZ (first 2 experiments only: 0.034 ±
0.022 μmol Si l–1d–1), except for the deep bSiO
2
maxi-mum in the PFZ where the highest rates were
mea-sured (0.129 ± 0.047 μmol Si l–1d–1). Dissolution rates
were below the detection limit in the eastern SAZ and, for the last experiments, in the western SAZ (both < 0.010 μmol Si l–1) (see ‘Results — Detection limit of the
bSiO2dissolution rate’). Integrated bSiO2dissolution in
the western SAZ and in the PFZ were in the range reported by others for the summer period (Fig. 5; Brzezinski et al. 2001, Beucher et al. 2004).
Higher specific bSiO2dissolution rates (Vdiss= ρdiss/
[bSiO2]; d–1) were observed in the western SAZ than in
the PFZ (Mann-Whitney rank sum test, p < 0.001;
0.22 ± 0.10 and 0.06 ± 0.04 d–1, respectively; Fig. 6b).
Published values of Vdiss in the PFZ and SAZ range
from 0.01 to 0.13 d–1(Nelson & Gordon 1982,
Brzezin-ski et al. 2001, Beucher et al. 2004).
DISCUSSION
Control of bSiO2production and dissolution rates
Production rates
The contribution of any detrital bSiO2would
under-estimate the specific uptake rate (VSi; d–1) since the
lat-ter is obtained by normalizing the uptake rate to the
bulk bSiO2concentration (living + detrital; Eq. 4). The
contribution of detrital bSiO2 to bulk bSiO2 was not
measured during the SAZ-Sense study. Using the PDMPO probe, Leblanc & Hutchins (2005) observed that, in general, only certain diatom species in the bulk diatom community were actively taking up Si, though the situation was different in the eastern SAZ (see be
-low). Since only a small fraction of bSiO2was actively
silicifying, it follows that bulk specific uptake rates were probably significantly underestimated. Taking the largest value for the relative contribution of dead diatom cells to bulk diatom abundance, reported for the Southern Ocean (i.e. 0.5; Beucher et al. 2004,
Armand et al. 2008), our VSivalues increased from 0.04
to 0.07 d–1 and from 0.22 to 0.36 d–1for the PFZ and
western SAZ, respectively. It thus appears that the
con-tribution of any non-living diatom-associated bSiO2is
unlikely the main reason for the observed VSi
distribu-tion (Fig. 6a).
A relatively large number of studies have examined the kinetics of Si-uptake by both natural diatom
assem-blages and cultured clones. VSi (d–1) generally in
-creases with increasing extracellular Si(OH)4in a way
that closely follows the Michaelis-Menten saturation function (e.g. Del Amo & Brzezinski 1999, Thama-trakoln & Hildebrand 2008):
(9)
where Vmax(d–1) represents the maximum rates of up
-take at infinite substrate concentration and KSi(μmol
l–1) is the Si(OH)
4 concentration at 0.5Vmax. KSi is in
-versely proportional to the diatom (Si-) affinity, e.g. the
relative ability of diatoms to use low levels of Si(OH)4.
During the SAZ-Sense study a strong gradient in VSi
(from 0.02 to 0.87 d–1) was observed despite similar
Si(OH)4concentrations (~0.7 μmol l–1), exceptions were
noted at the 2 first stations in the western SAZ and for
the deep PFZ bSiO2maximum (Fig. 7). However, these
outliers were also different compared to the trend expected from Eq. (9), as they either revealed an
inter-mediate VSi with a lower Si(OH)4 concentration or a
lower VSiregardless of higher Si(OH)4concentrations.
This uncoupling of VSi(d–1) from the Si(OH)4
concen-tration, suggests differences in kinetic parameters
(Vmaxand KSi) related to differences in biogeochemical
V V K Si Si Si(OH) Si(OH) =
[
]
⋅[
]
+ 4 4 maxSpecific Si-uptake rate, VSi (d–1)
0.0 0.2 0.4 0.6 0.8 1.0 0 20 40 60 80 Eastern SAZ: P3 Western SAZ: P1 PFZ: P2
Specific bSiO2 dissolution rate, Vdiss (d–1)
0.0 0.2 0.4 0.6 0.8 1.0 De pt h (m ) 0 20 40 60 80 1st sampling 2nd sampling 3rd sampling a b
Fig. 6. Vertical distribution of specific (a) Si-uptake and (b) bSiO2dissolution rates for each cast of each process station,
except for stations below the detection limit for bSiO2
dissolu-tion rates (P3 and third sampling of P1). The black, white, and gray dots represent Process Stations 1, 2, and 3 (P1 to P3), respectively. For P3, only the 32Si results are presented (see
‘Materials and methods’). PFZ: Polar Frontal Zone; SAZ: Subantarctic Zone
conditions and/or diatom communities (Cassar et al. 2011, de Salas et al. 2011).
During summer different co-limitations are expected for the PFZ and SAZ, and these could influence the Si-uptake mechanism, thus providing an explanation for
the observed VSidistribution (Boyd et al. 1999, De La
Rocha et al. 2000, Franck et al. 2000, 2003, Hutchins et
al. 2001, Leynaert et al. 2004). Si(OH)4, nitrate and
phosphate concentrations increased with latitude and with depth from the STZ to the PFZ in the present study. Nitrate and phosphate were expected to be non-limiting (Sedwick et al. 2002, Bowie et al. 2009).
Although the Si(OH)4concentration (<1 μmol l–1) was
near or below the half-saturation constants for
Si-uptake (from 0.7 to 10 μmol l–1; Nelson et al. 2001), V
Si
(d–1) was independent of the Si(OH)
4 concentration
(Fig. 7). The dissolved iron concentration generally decreased from north to south (Bowie et al. 2009, Lan-nuzel et al. 2011). This gradient is most likely due to a large supply of iron further north, from both the advec-tion of East Australian Current iron-rich subtropical
waters and the Aeolian deposition of dust coming from the Australian continent (Bowie et al. 2009). Cassar et al. (2011) provide evidence for the critical roles of iron and light as limiting factors for primary production across the SAZ-Sense area: the net community produc-tion was: (1) strongly correlated with dissolved iron concentration and iron sufficiency and (2) uncorrelated with mixed layer depth. Such co-limitations are likely to have impacted Si-uptake processes and conse-quently Si-uptake kinetic parameters (Eq. 9; De La Rocha et al. 2000, Claquin et al. 2002, Franck et al. 2000, 2003, Leynaert et al. 2004). During the
SAZ-Sense cruise iron limitation matched with VSi
distribu-tion, both showing higher values in the eastern SAZ, intermediate values in the western SAZ, and lowest
values in the PFZ (Fig. 6a). Also VSishows a decreasing
trend with depth along with light availability (Fig. 6a).
Although the cellular silicon cycle (the bSiO2
polymer-ization process) is not strictly light dependent, photo-synthesis is clearly involved in supplying energy, at least for the synthesis of the organic compounds involved in the Si-uptake machinery (Martin-Jézéquel et al. 2000, Claquin et al. 2002). Our data suggest that, despite the decoupling of cell Si and C cycles, Si-uptake kinetics are not strictly independent of light levels.
Diatom communities differed between the SAZ and PFZ, with lightly silicified pennate diatoms in the for-mer and heavily silicified diatoms (pennate and centric diatoms) in the latter (de Salas et al. 2011). It is likely that SAZ diatom communities are adapted to year-round low Si(OH)4concentrations (< 4 to 5 μmol l–1). In
the PFZ, relatively high Si(OH)4concentrations at the
onset of the growth period (>10 μmol l–1; Rintoul &
Bullister 1999, Cardinal et al. 2005) combined with a strong iron/light co-limitation could favor the growth of heavily silicified diatoms that could efficiently
deplete the Si(OH)4pool (Takeda 1998, Claquin et al.
2002, Franck et al. 2003). It is possible that the late summer PFZ diatom community was poorly adapted to
the low Si(OH)4 concentrations, explaining the lower
VSi (d–1) values there. Furthermore, large inter- and
intra-specific variations of VSican be expected (De La
Rocha et al. 2000, Leynaert et al. 2004, Sarthou et al. 2005). Taken together with the discussed effects of co-limitation this indicates a greater ability of SAZ diatoms to use silicic acid more efficiently at prevailing
low Si(OH)4concentrations, compared to PFZ diatoms.
Dissolution rates
In the marine environment, bSiO2 dissolution has
been shown to be influenced by temperature, diatom species composition, trace metal content of the
frus-0 1 2 3 4 5 6 VSi (d –1 ) 0.0 0.2 0.4 0.6 0.8 1.0 Si(OH)4 (µmol l–1) 0.0 0.2 0.4 0.6 0.8 1.0 0.0 0.2 0.4 0.6 0.8 1.0 Western SAZ PFZ Eastern SAZ a b
Fig. 7. Specific Si-uptake versus Si(OH)4concentration for the
3 process stations—black: western SAZ (P1); white: PFZ (P2); gray: eastern SAZ (P3). Panel b shows Si(OH)4on a smaller
scale (<1 μmol l–1). Consequently, the deep PFZ bSiO 2
maxi-mum is not seen in Panel b. PFZ: Polar Frontal Zone; SAZ: Subantarctic Zone
tules, grazing, bacterial activity, and the relative abun-dance of dead diatoms (e.g. Ragueneau et al. 2000, Beucher et al. 2004).
During the SAZ-Sense study we observed a positive
relationship between bSiO2 concentration and bSiO2
dissolution rates (Table 1; R2= 0.72, p < 0.01, n = 20, not
shown), suggesting that the contribution of dead
diatoms increases with the increase of bSiO2. Higher
dissolution rates in the western SAZ and PFZ co-occurred with observations that a large fraction of the diatom community was not silicifying (Leblanc & Hutchins 2005), suggesting that a large fraction of the
bSiO2pool there was detrital. Similarly, Beucher et al.
(2004) report a correlation between the fraction of dead
diatom cells and bSiO2dissolution during summer.
The SAZ environment appeared more susceptible to
bSiO2dissolution than that of the PFZ (Fig. 6b).
Evi-dence from the literature indicates that higher
temper-atures enhance specific bSiO2 dissolution rates
(Kamatani 1982, Hurd & Birdwhistell 1983). Therefore, differences in sea surface temperature between these 2 areas (~11 vs. ~5°C, respectively) could, at least in
part, explain the difference in specific bSiO2
dissolu-tion rates. Assuming a Vdiss of 0.06 ± 0.04 d–1 (mean
PFZ) and the Kamatani (1982) relationship (Vdiss
increases by a factor of 2.27 for each rise in 10°C
temperature), Vdissshould increase from 0.06 ± 0.04 to
0.11 ± 0.05 d–1. It thus appears that higher SAZ
temper-atures might only partly explain the observed gradient
in Vdiss; though there are uncertainties concerning
such a temperature-dependent relationship (Kamatani 1982).
Any process that induces an increase in bSiO2
-specific surface and/or a build-up of small amorphous
bSiO2 objects with long residence times in surface
waters favors bSiO2 dissolution. Based on culture
experiments, Schultes et al. (2010) reported enhanced
dissolution of bSiO2following ingestion of diatoms by
microzooplankton grazers. Pearce et al. (2011) ob
-served during the SAZ-Sense study that a large frac-tion of primary producfrac-tion was consumed by
micro-zooplankton and heterotrophic nanoflagellates. Thus, micro zooplankton feeding on diatoms could produce
light-weight detritus, easily accessible to the hydro
-lyzing activity of bacteria, which removes the organic matrix from diatom frustules and exposes them to the ambient under-saturated seawater environment (Bidle & Azam 1999). Dumont et al. (2011) report that bacterial activity during the SAZ-Sense study was higher in the SAZ than in the PFZ. To conclude, the
conditions favoring a more efficient bSiO2dissolution
in the SAZ (higher Vdiss) were probably induced by
biological processes such as microzooplankton her-bivory and bacterial activity (Bidle & Azam 1999, Schultes et al. 2010, Dumont et al. 2011, Pearce et al. 2011), as well as by other factors such as
species-dependent Vdissvalues (Kamatani 1982, Hurd &
Bird-whistell 1983).
Importance of SAZ and PFZ in the global silicon budget
From a compilation of published results it appears
that higher bSiO2 production values in the SAZ and
PFZ were more often observed in spring than in sum-mer (Table 2). As expected, the PFZ was characterized
by higher bSiO2production compared to the SAZ, re
-sulting in greater PFZ seasonal Si(OH)4 depletion by
dia toms (< 20 and < 5 μmol l–1, respectively) and a
larger contribution of diatoms to primary production (Kop czynska et al. 2001, 2007, de Salas et al. 2011).
The daily integrated bSiO2 production in the SAZ
(Table 2) was intermediate between the values re
-ported for oligotrophic areas (0.1 to 2.9 mmol Si m–2)
and areas south of the Polar Front (1.8 to 93 mmol Si
m–2) (see review in Ragueneau et al. 2000, and
subse-quent studies by Brzezinski et al. 2001, Quéguiner 2001, Leblanc et al. 2002, Quéguiner & Brzezinski 2002, Beucher et al. 2004, Krause et al. 2009, 2010).
The PFZ bSiO2 production values were closer to the
values reported south of the Polar Front.
Zone Season bSiO2production bSiO2dissolution D:P
(mmol m–2d–1) (mmol m–2d–1)
Mean Range Mean Range Mean Range
SAZ Spring 4.8 ± 4.7 (n = 7) 0.9–12.7 0.9 ± 0.7 (n = 5) 0.4–2.0 0.43 ± 0.22 (n = 5) 0.18–0.71 Summer 1.1 ± 1.7 (n = 14) 0.1–6.6 2.7 ± 2.2 (n = 3) 0.9–5.2 1.74 ± 1.18 (n = 3) 1.0–3.1 PFZ Spring 26.5 ± 16.3 (n = 13)0 6.8–60.7 5.1 ± 1.0 (n = 2) 4.4–5.8 0.42 ± 0.28 (n = 2) 0.22–0.61 Summer 3.0 ± 2.1 (n = 16) 0.3–9.1 4.5 ± 1.8 (n = 4) 2.2–6.5 1.70 ± 1.23 (n = 4) 0.73–3.50 Table 2. Mean and range of daily integrated bSiO2production and dissolution data and the dissolution to production (D:P) ratio
for the euphotic layer in the Polar Frontal Zone (PFZ) and Subantarctic Zone (SAZ). Data from: Nelson & Gordon (1982), Caubert (1998), Brzezinski et al. (2001), Quéguiner (2001), Leblanc et al. (2002), Quéguiner & Brzezinski (2002), Beucher et al. (2004),
For both the PFZ and SAZ, a net increase in the
bSiO2 pool has generally been observed in spring
(mean D:P = 0.43 and 0.42, respectively), while in
sum-mer it is generally characterized by a net bSiO2 loss
(mean D:P = 1.74 and 1.70; Table 2). Brzezinski et al. (2003) suggested that a shift occurs from a condition in
which bSiO2dissolution supports only a small fraction
of the gross silica production that prevails during diatom blooms to a condition in which silica dissolution
supports the major portion of the gross bSiO2
produc-tion during non-bloom periods. With this scenario in mind, it would appear that during the SAZ-Sense study the second condition (non-bloom) prevailed both in the SAZ and PFZ. Our study suggests that the
accumula-tion of dissolving detrital bSiO2 following a diatom
bloom can indeed sustain an efficient supply of Si through biologically mediated recycling in SAZ and PFZ surface waters.
Taking into account the mean integrated net bSiO2
production for the spring and summer seasons (Table 3; October to March) and the PFZ and SAZ sur-face areas (JGOFS Synthesis Group 2001), we
esti-mated the spring to summer net bSiO2production for
the SAZ and PFZ to be 7.4 ± 13.2 and 3.6 ± 3.3 Tmol
Si yr–1, respectively. Tréguer & Van Bennekom (1991)
estimated a PFZ gross bSiO2 production at 2 Tmol
Si yr–1, significantly lower than our estimate (7.9 ±
4.4 Tmol Si yr–1). They argued that their PFZ gross
bSiO2production was probably underestimated since
it was based on (lower) autumnal bSiO2 production
estimates. Using the early spring values of Nelson & Gordon (1982), Tréguer & Van Bennekom (1991)
esti-mated a SAZ gross bSiO2production of 15.6 Tmol Si
yr–1, a value not very different from our estimate
(23.0 ± 19.4 Tmol Si yr–1). However, the dataset used in
our study has been expanded considerably and is thus far more representative than the one utilized by Tréguer & Van Bennekom (1991). We also calculated that the SAZ and PFZ areas contributed to 4.3 ± 7.8 and 2.1 ± 2.0%, respectively, to the average global net
bSiO2production of 171 ± 35 Tmol Si yr–1(mean from
Nelson et al. 1995, Usbeck 1999, Heinze et al. 2003, Jin et al. 2006). The PFZ has higher values by unit surface area, but the greater surface area of the SAZ explains
its higher contribution to global bSiO2 production
(Table 3).
Si-dynamic at the deep PFZ bSiO2maximum
The subsurface chl a and bSiO2maxima at the base
of the seasonal pycnocline have been a recurrent fea-ture in the summer PFZ (Fig. 4b; Parslow et al. 2001, Quéguiner 2001, Bowie et al. 2011b). The origins of these deep maxima are unclear and vary according to location. Processes responsible for the formation of such features could be: (1) the development of an ac-tive community supported by a deep nutricline (Holm-Hansen & Hewes 2004), (2) the photophysiological ac-climation of algal cells to low irradiance levels (Cullen 1982, Parslow et al. 2001), and (3) the sinking and ac-cumulation of particles from the overlying mixed layer into a secondary pycnocline (Uitz et al. 2009).
C- and N-uptake rates in the deep bSiO2maximum
decreased to minimal values, and production was mainly sustained by regenerated nutrients (Cavagna et al. 2011). There was no significant increase in the Si-uptake rate (Fig. 4d), and the large increase in the
bSiO2 D:P ratio at this depth also indicated efficient
recycling of silicon. These observations argue against the development of an active community (see the first process possibility, above) but are more in favor of
accumulation and recycling of both bSiO2and organic
matter at the base of the seasonal pycnocline, just above the subsurface temperature minimum (100 to 250 m; Bowie et al. 2011b; the third process possibility).
CONCLUSIONS
The present study has significantly improved the quantification of the Si-budget in the euphotic layer for Zone Season bSiO2gross production bSiO2net production bSiO2net production
(mmol m–2season–1) (mmol m–2season–1) Tmol yr–1zone–1 % total zone–1
SAZ Spring 433 ± 423 246 ± 259 7.4 ± 13.2 4.3 ± 7.8 Summer 101 ± 153 –75 ± 165 Spring + Summer 534 ± 449 171 ± 307 PFZ Spring 2382 ± 1467 1393 ± 1081 3.6 ± 3.3 2.1 ± 2.0 Summer 271 ± 189 –190 ± 3590 Spring + Summer 2653 ± 1479 1203 ± 1139
Table 3. Annual gross and net bSiO2production for the spring and summer seasons by zone in the Polar Frontal Zone (PFZ) and
Subantarctic Zone (SAZ). The mean values from Table 2 have been used for these estimations. Measurements were taken from October to March. Surface area: PFZ = 3 × 10⁶km2: SAZ = 43.1 × 10⁶km2(JGOFS Synthesis Group 2001, Tomczak & Godfrey 1994)
the Southern Ocean SAZ and the PFZ regions. By
com-piling previous bSiO2production and dissolution data,
a clear seasonal pattern emerges with (1) a higher pro-duction rate in spring than in summer and (2) a net
gain of bSiO2production in the mixed layer in spring
(D:P ratio ≈ 0.4), in contrast to a net loss in summer (D:P
ratio ≈ 1.7). The PFZ has higher bSiO2production rates
by unit surface area than the SAZ, in agreement with the higher diatom contributions to primary
productiv-ity there. We estimate the spring to summer net bSiO2
production in the SAZ and the PFZ at 7.4 and 3.6 Tmol
Si yr–1, respectively, representing 4.3 and 2.1% of the
global net bSiO2production (171 Tmol Si yr–1).
Both in the late summer PFZ and SAZ, bSiO2
dissolu-tion is able to sustain the entire Si demand by diatoms.
Such bSiO2 dissolution suggests bSiO2 accumulation
within the mixed layer following upon bloom events. The SAZ environment appears to be characterized by
more efficient dissolution (higher specific bSiO2
disso-lution rates) than the PFZ, likely induced by biological processes such as microzooplankton herbivory and bacterial activity, together with species-specific varia-tion of Vdiss.
Co-limitations (mainly iron) and the composition of diatom communities have been suggested as factors impacting Si-uptake kinetics and, consequently, the
ability of diatoms to grow at low Si(OH)4
concentra-tions. Specific Si-uptake rates (VSi; d–1) followed iron
concentrations and were higher, intermediate, and lower in the eastern SAZ, western SAZ and PFZ, respectively.
At the deep bSiO2maximum in the PFZ we observed
a decrease in gross primary production and an increase in the regenerated production for both Si and
C. These observations argue against significant in situ
growth of diatoms that are capable of extending pro-ductivity through easier access to deep, nutrient-rich pools. Instead our study provides evidence for the accumulation and recycling of settling detritic or living (partly inactive) cells at the base of the seasonal deep pycnocline (Bowie et al. 2011b).
Acknowledgements. Our warm thanks go to the officers and
crew of RV ‘Aurora Australis’ during the SAZ-Sense cruise and also to B. Griffiths (chief scientist). We are also grateful to V. Barthaux (COM), J. Navez, L. Monin, and N. Dahkani (RMCA) for their help in sample processing and to I. Dumont (ULB) for bacterial activity measurements. This work was con-ducted within the BELCANTO III network (Contract SD/ CA/ 03A of SPSDIII [Support Plan for Sustainable Development] funded by BELSPO [the Belgian Science Policy]) and within the EUR-OCEANS network of excellence (No. 511106, FP6, European Commission). L.A. acknowledges the support of Lotto and the FWO (Project FWONL36) in the acquisition of the HR-SF-ICP-MS. F.F. is a post-doctoral fellow of the ‘Fonds de la Recherche Scientifique’ (FNRS, Belgium), and D.C. was funded by BELSPO.
LITERATURE CITED
Armand LK, Cornet-Barthaux V, Mosseri J, Quéguiner B (2008) Late summer diatom biomass and community struc-ture on and around the naturally iron-fertilized Kerguelen Plateau in the Southern Ocean. Deep-Sea Res II 55: 653–678
Beucher C, Tréguer P, Hapette AM, Corvaisier R, Pichon JJ (2004) Intense summer Si-recycling in the surface South-ern Ocean. Geophys Res Lett 31:L09305. doi:10.1029/ 2003GL018998
Bidle KD, Azam F (1999) Accelerated dissolution of diatom silica by marine bacterial assemblages. Nature 397: 508–512
Bowie AR, Lannuzel D, Remenyi TA, Wagener T and others (2009) Biogeochemical iron budgets of the Southern Ocean south of Australia: summertime supply de -couples iron and nutrient cycles in the subantarctic zone. Global Biogeochem Cycles 23:GB4034 doi: 10.1029/ 2009 GB003500
Bowie AR, Trull TW, Dehairs F (2011a) Editorial. Estimating the sensitivity of the Sub-Antarctic Zone to environmental change: The SAZ-Sense project. Deep-Sea Res II (in press) doi: 10. 1016/ j.dsr2.2011.05.034
Bowie AR, Griffiths FB, Dehairs F, Trull TW (2011b) Oceano -graphy of the sub-Antarctic and Polar Frontal Zones south of Australia during summer: setting for the SAZ-Sense study. Deep-Sea Res II (in press) doi:10.1016/ j.dsr 2.2011.05.033
Boyd PW, LaRoche J, Gall M, Frew R, McKay RML (1999) Role of iron, light, and silicate in controlling algal biomass in subantarctic waters SE of New Zealand. J Geophys Res 104: 13395–13408
Brzezinski MA, Phillips DR, Chavez FP, Friederich GF, Dug-dale RC (1997) Silica production in the Monterey, Califor-nia, upwelling system. Limnol Oceanogr 42:1694–1705 Brzezinski MA, Nelson DM, Franck VM, Sigmon DE (2001)
Silicon dynamics within an intense open-ocean diatom bloom in the Pacific sector of the Southern Ocean. Deep-Sea Res II 48:3997–4018
Brzezinski MA, Jones JL, Bidle KD, Azam F (2003) The bal-ance between silica production and silica dissolution in the sea: insights from Monterey Bay, California, applied to the global data set. Limnol Oceanogr 48:1846–1854 Buesseler KO (1998) The decoupling of production and
partic-ulate export in the surface ocean. Global Biogeochem Cycles 12:297–310
Cardinal D, Alleman LY, Dehairs F, Savoye N, Trull TW, André L (2005) Relevance of silicon isotopes to Si-nutrient utilization and Si-source assessment in Antarctic waters. Global Biogeochem Cycles 19:GB2007. doi:10.1029/ 2004 GB 002364
Cassar N, DiFiore PJ, Barnett BA, Bender ML and others (2011) The influence of iron and light on net community production in the Subantarctic and Polar Frontal Zones. Biogeosciences 8:227–237
Caubert T (1998) Le cycle du silicium dans l’océan Austral: determination par spectrométrie de masse de la produc-tion de silice biogénique dans le secteur Indien. PhD the-sis, Université de Bretagne Occidentale, Brest
Cavagna AJ, Elskens M, Griffiths FB, Fripiat F, Jacquet SHM, Dehairs F (2011) Contrasting regimes of productivity and potential for carbon export in the Subantarctic and Polar Frontal Zones south of Tasmania. Deep-Sea Res II (in press) doi:10. 1016/ j.dsr2.2011.05.026
Claquin P, Martin-Jézéquel V, Krompkamp JC, Veldhuis MJ, Kray GW (2002) Uncoupling of silicon compared to carbon