HAL Id: ensl-00875187
https://hal-ens-lyon.archives-ouvertes.fr/ensl-00875187
Submitted on 21 Oct 2013
HAL is a multi-disciplinary open access
archive for the deposit and dissemination of
sci-entific research documents, whether they are
pub-lished or not. The documents may come from
teaching and research institutions in France or
abroad, or from public or private research centers.
L’archive ouverte pluridisciplinaire HAL, est
destinée au dépôt et à la diffusion de documents
scientifiques de niveau recherche, publiés ou non,
émanant des établissements d’enseignement et de
recherche français ou étrangers, des laboratoires
publics ou privés.
Networks as Signals, with an Application to Bike
Sharing System
Ronan Hamon, Pierre Borgnat, Patrick Flandrin, Céline Robardet
To cite this version:
Ronan Hamon, Pierre Borgnat, Patrick Flandrin, Céline Robardet. Networks as Signals, with an
Application to Bike Sharing System. GlobalSIP 2013, Dec 2013, Austin, United States. pp.IPN.PB.8.
�ensl-00875187�
Networks as Signals, with an Application to a Bike
Sharing System
Ronan Hamon, Pierre Borgnat, Patrick Flandrin
Physics Laboratory, CNRS UMR 5672ENS Lyon, Universit´e de Lyon Lyon, France
C´eline Robardet
LIRIS, CNRS UMR 5205 INSA Lyon, Universit´e de LyonVilleurbanne, France [email protected]
Abstract—Dynamic graphs are commonly used for describing networks with a time evolution. Shimada et al. [1] recently proposed to transform these graphs into a collection of signals indexed by vertices. This approach is here further explored in a number of different directions. First, the importance of a good indexing of a graph is stressed, and a solution is proposed using a node labeling algorithm which follows the structure of the graph. Second, a spectral analysis of identified signals is performed to compute features linked to graph properties such as regularity or structure in communities. Finally, these features can be tracked over time to evidence the structure evolution of the graph. As a case study, the approach is applied to a dynamic graph based on a dataset of trips made using the bike sharing system V´elo’v in use in Lyon, France. This is shown to offer specific insights on behaviors of bike users over time in two districts of the city.
Index Terms—Dynamic networks, transportation networks, classical multidimensional scaling, cyclic bandwidth, bike sharing system
I. INTRODUCTION
Many data associated to networks, whether physical, biolog-ical or social, can be described by graphs that can become large when the data gets big. Also, the size of the data increases when the network becomes dynamic with some time evolution. These graphs are difficult to study because there exist only a few tools to describe these objects. A method to map a graph into a collection of signals has been proposed by Shimada et al. [1], based on classical multidimensional scaling (CMDS). The interest of this transformation is that it allows for a possible data reduction by restricting the expansion to a limited number of dominant contributions.
A first objective of the present work is to show how this idea can be made practical for arbitrary networks if care is taken to estimate a suitable labeling of the nodes reflecting the “bigger picture” of the network [2]. Indeed, the order in which the nodes are taken is critical to uncover information on the structure of the network using the approach described in [1]. An originality of our analysis is to adopt a signal theory approach by computing frequency analysis on signals representing the graphs. A second contribution is to show how to use the method to visualize synthetically the evolution of dynamic graphs.
Finally, an example of such a complex network evolving in time is visualized and studied thanks to the proposed approach
on the basis of a dataset of trips made using the bike sharing system of Lyon, called V´elo’v.
Section II recalls the mapping from network to signals, and its shortcoming on unsorted nodes. A labeling algorithm is proposed in Section III. Then, we study the frequency analysis of the components for some examples of networks in Section IV, and show how to visualize thanks to that a simplified dynamics of a network. Section V applies the methodology to provide a simplified representation of the evolution of the V´elo’v bike sharing system. A conclusion is given in Section VI.
II. FROM NETWORKS TO SIGNALS
Let G = (V, E ) a simple undirected and unweighted graph where V is the set of nodes (or vertices) of size #V = n and E is the set of links (or edges) of size #E = m. We note A = (aij)i,j=1,..,n its adjacency matrix.
A. Method using CMDS
Shimada et al. [1] proposed a method to transform a graph into a collection of signals with n points indexed by the vertices of the graph by using classical multidimensional scaling (CMDS). The interest of this transformation is based on the fact that if n signals enable us to reconstruct exactly the original graph, it is also possible to reduce the representation retaining only a small number of signals, yet with a good approximation.
This transformation consists of applying CMDS on a matrix distance between vertices of a graph, noted ∆ = (δ)i,j=1,..,n
and defined for i, j ∈ V by
δij = 0 if i = j 1 if aij = 1 and i 6= j w > 1 if aij = 0 and i 6= j Following [1], we choose w = 1.1.
Multidimensional scaling (MDS) [3] is a set of mathemat-ical techniques used to represent measurements of similarity (or dissimilarity) among pairs of objects as distances between points in a multidimensional space whose dimension is low. Classical MDS is a particular case of metric MDS where the dissimilarities are assumed to be Euclidean distances.
Watts-Strogratz model with n = 100 and p = 0.0 Graph with 3 communities
(a1) (a2) (a3) (b1) (b2) (b3)
Fig. 1. Examples of transformation for 2 graphs with 100 nodes (a) Watts-Strogatz with k = 4 and p = 0.0 (b) Graph with 3 communities. 1. Representation of the graph. 2. Visualization of the 1st 4 components when the labeling is ordered. 3. Visualization of the four first components when the labeling is random. The obtained signals with an ordered labels highlights the structure of graphs while a random labeling ends up with signals with high variability.
The matrix X of coordinates in the low-dimensional, trans-formed space can be computed analytically. Starting with the distance matrix ∆, we first compute a double centering of the matrix whose terms are squared : B = −12J∆(2)J with J = In−1n1n1Tn where In is the identity matrix and 1n1Tn
an n × n matrix of ones.
The CMDS solution is given by X = Q+Λ
1 2
+ with Λ+ a
diagonal matrix whose terms are the eigenvalues of the matrix B sorted in an increasing order and Q+ is the matrix of
the corresponding eigenvectors. The obtained signals are the components (or columns) of the matrix X and the j-th signal is noted X(j). These signals are indexed by the vertices of the
graph.
B. The necessity of ordering labels of nodes
Shimada et al. show that ring lattices are transformed to periodic signals : each component is a cosine whose frequency depends on the number of the components. More generally, it can be relevant to describe signals using spectral analysis and hence link frequency features with graph properties. Neverthe-less the spectral analysis is closely related to the indexation of signals and so to the numbering of the graph. It becomes necessary to find a good numbering of nodes in order to have therefore good spectral properties. We propose a method based on the fact that we want to avoid brutal variations of signals. That means that it is necessary to have close indices between neighbor vertices, which are defined closer in the distance matrix than unlinked vertices. We propose in the next section an algorithm to relabel nodes such that the indices between neighbors nodes are close. In particular, abrupt variations of signals are to be avoided. Figure 1 shows examples of transformation for two graphs with 100 nodes. The first one is a Watts-Strogatz graph with a degree k = 4 and and no probability of relinkage (p = 0) [4] (Figure 1a) which is transformed into cosines if the label of nodes follows the cycle. A random labeling gives signals with high variability. The second example consists of the transformation of a graph with 3 communities (Figure b1). The first two components highlight the community structure of the graph when the labeling browses nodes by community. In both graphs, when the labeling is random, the signals have a high variability.
III. ALGORITHM OF NODE LABELING
The labeling of a graph with n nodes assigns to each node an integer between 0 and n − 1. One possible labeling that will have the property advocated above comes from the cyclic bandwidth sum problem [5] that can be formalized as follows. Let d be a distance between two labels i and j defined by d(i, j) = min(|i−j|, n−|i−j|). Solving the cyclic bandwidth
Before After
Fig. 2. 2d grid graph of 5*20 nodes, each connected to its nearest neighbors with periodic boundary conditions, before (a) and after (b) nodes relabeling. The color of nodes denotes the labels according to the cyclic bandwidth i.e. two close colors mean two close labels. The labeling clearly follows the structure of the graph.
problem consists of finding a one-to-one and onto mapping ˆλ of V to {0, · · · , n − 1} defined by ˆ λ = min λ f (λ) with f (λ) = X {u,v}∈E d(λ(u), λ(v))
We propose to solve this problem thanks to a two-step algorithm. The first step is based on the depth-first search algorithm and enables us to obtain a collection of independent paths. An approximation of the longuest path starting from node u is computed using the following procedure, where u is the node with highest eccentricity [4] :
Require: G = {V, E}, u the starting node, AllPaths the collection of already computed paths
Ensure: P a path
1: NextNode ← u
2: while NextNode 6= ∅ do
3: NextNode ← ∅
4: Push u in P
5: for all v such that (u, v) ∈ E, v /∈ AllPaths, v /∈ P do
6: if degree of v = 1 then
7: Push v in P
8: else
9: if NextNode = ∅ or Topological Similarity(u,v) >
Topological Similarity(u, NextNode) then
10: NextNode ← v
The topological similarity is an index based on a Jaccard index which considers both local and global structure of the graph. The procedure is repeated until all nodes are in a path.
The second step aims to aggregate these paths in order to minimize the cyclic bandwidth sum . The paths are considered following their decreasing lengths. The longest path is first considered and inserted into a empty list called labeling. The second longest path is then considered and inserted at all available indices in the labeling : for each insertion, the cyclic bandwidth sum is computed limited to the labeled nodes. The path is inserted definitively at the index which minimized this criterion. The algorithm goes on until all the paths have been inserted.1
1The full description of this algorithm can be found at http://perso.ens-lyon.
Watts-Strogratz model with n = 100 and p = 0.0 Graph with 3 communities
(a4) (a5) (a6) (b4) (b5) (b6)
Fig. 3. (a) and (b) refer to the graphs defined in Figure 1. 4. Energy with respect to components and frequencies. The color is coded from dark blue (low value) to dark red (high value) 5. Energy of components. 6. Energy of frequencies averaged over components. Both graphs have specific signatures : the regular graph has only one frequency per component while the graph with communities has a high energy for low frequencies in the first components.
Figure 2 shows the labeling of a 2d grid graph before and after nodes relabeling : the labeling follows the structure of the graph.
IV. FREQUENCY ANALYSIS OF NETWORK’S SIGNALS
Let us consider a collection of K signals indexed by n ver-tices. Several features can be computed to describe the com-ponents. We note S(k, f ) = |F X(k)(f )|2 which is estimated,
for positive frequencies, on n2+ 1 bins, ∀k ∈ {1, · · · , K}, F being the Fourier transform. We then compute the following features : 1) Energy of components: ∀k ∈ {1, · · · , K}, Ek = kX(k)k2 2) Energy of frequencies: ∀f ∈ {1, · · · ,n 2 + 1}, ¯S(f ) = PK k=1S(k, f )
Figure 3 shows the frequency analysis corresponding to graphs introduced in section II, evidencing that specific fre-quency patterns can be linked to graph properties such as regularity or presence of communities.
Extension to dynamic graphs
Spectral analysis of signals derived from a transformation of a graph enables us to highlight relations between feature patterns and graph properties. This approach can be extended to dynamic graphs : considering that at each time step a the snapshot of a dynamic graph as a static graph, the extension to dynamic graphs consists of the application of the method described previously on the derived static graph. The features described for static graphs can be visualized over time and hence help to track the structure of the dynamic graph.
V. APPLICATION TO THEV ´ELO’V BIKE SHARING SYSTEM
Many big cities in the World propose a bike sharing system in which bikes are made available at any time for short trips. In Lyon, the V´elo’v program2has been deployed since May 2005 and consists of 350 stations spread over all the urban area in which bikes can be hired or returned back. Anonymized data for the year 2011 were made available to us by the operator JCDecaux and the “Grand Lyon” City Hall. Data consists of the records of trips, each documented with its starting date and departure station, its ending date and destination station and specific tags. Using these trips, we built a dynamic graph of the system V´elo’v for the year 2011: for each time step of 1 hour, a static graph is generated where the vertices are the stations which have an activity and an edge between two stations denotes that at least one user has been riding a bike from one of the two stations to the other one. The system
2http://www.velov.grandlyon.com/
V´elo’v has been intensively studied in [6] for the period from May 2005 to December 2007.
A. View of the complete graph
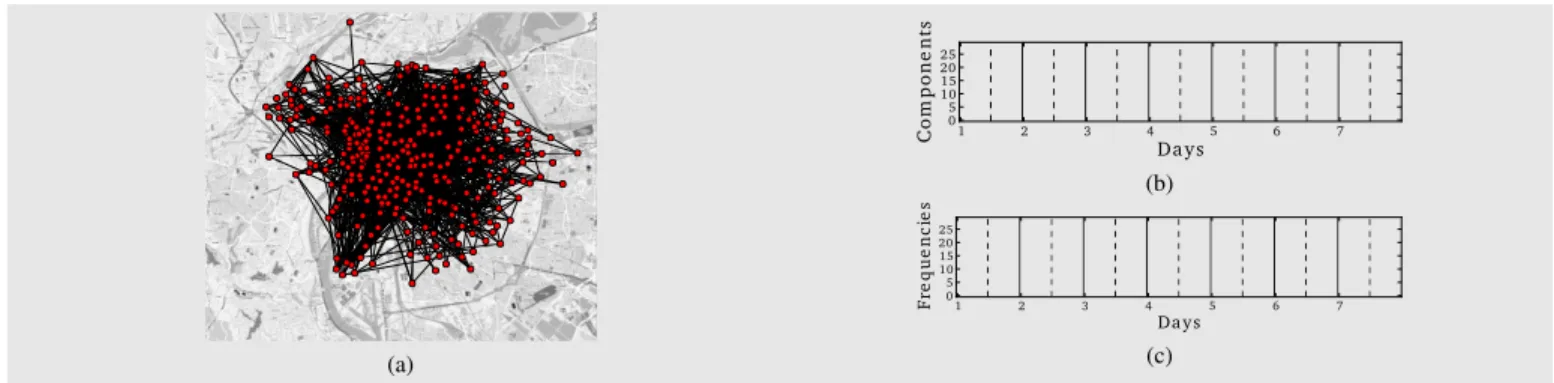
We focus for the analysis on seven consecutive days of 2011 from Monday 6th June to Sunday 12th June. These days are a typical working week without public holiday nor school holidays. Figure 4a shows the graph for the time step in June 6th, 2011 at 8am. The transformation described in section II is performed on the dynamic graph to reduce the collection of graphs at each time step in a collection of signals. Figure 4b shows the energy of components of these signals over time. We can easily notice the presence of a weekly cycle with the five working days and the week-end where the energy is lower. It is closely related to the activity of the system which has also peaks during the busiest times of highest usage as described in [6]. The analysis of the energy of frequencies in Figure 4c over all components is less obvious. It shows nonetheless the presence of high energy of low frequencies in the first few components which indicates the presence of hidden structures inside the graph as suggested in Figure 3b. In order to highlight these structures, a subgraph of the V´elo’v graph based on geographical consideration is generated and analyzed in the next section.
B. Study of a subgraph
A subgraph is generated from the V´elo’v graph where the retained nodes correspond to the stations belonging either to the 7th district of Lyon or to the city of Villeurbanne. The study is hence focused on the relation between these two geographical areas which are not contiguous but close enough to enable short distance trips by bike. To determine if there two areas can be considered as two communities, i.e. in this context an area where users who rent a bike tend to stay, a normalized averaged distance in labeling between the two areas is computed. This criterion is equal to zero if all edges between both communities link stations whose labels are contiguous and is equal to 1 if these labels have the highest distance. Figure 5c displays this value over time : at 10am, this value is minimum, meaning that the areas are not separated by labeling, and the opposite occurs at 9pm where the value is maximal, meaning that the two areas are well separated. Figures 5a and 5b illustrate this results by displaying colors of nodes using geographical positions, highlighting the fact that geographical areas can be seen as communities at 9pm. Finally the spectra of graphs enable us to find a structure in communities as described in section IV at time 9pm while the much less concentrated energy at time 10am suggests no such organization.
(a) 1 2 3 4 5 6 7 Days 0 5 10 15 20 25 C o m p o n e n ts (b) 1 2 3 4 5 6 7 Days 0 5 10 15 20 25 Fr e q u e n ci e s (c)
Fig. 4. Analysis of the V´elo’v graph for one week (a) Snapshot of the graph in June 6, 2011 at 8am. The red circles represent the stations and the black links the connection between stations. (b) Energy of components over time. (c) Energy of frequencies averaged over all components over time. The color is coded from dark blue (low value) to dark red (high value). The high energy of components reflects the high activity of the system as described in [6].
(a) 10am (b) 9pm 89 10 11 12 13 14 15 16 17 18 19 20 21 22 Hour 0.0 0.1 0.2 0.3 0.4 0.5 0.6 N o rm a liz e d la b e lin g d is ta n ce (c) 0 2 4 6 8 Components 0 2 4 6 8 Frequencies 0.02 0.04 0.06 0.08 0.10 0.12 0.14 0.16 0.18 (d) 10am 0 2 4 6 8 Components 0 2 4 6 8 Frequencies 0.00 0.05 0.10 0.15 0.20 0.25 0.30 0.35 0.40 (e) 9pm
Fig. 5. Analysis of a subgraph of the V´elo’v graph composed of the stations of the 7th district of Lyon and the city of Villeurbanne. (a) (b) Snapshots of the graph. The color of nodes denotes the labels according to the cyclic bandwidth. (c) Normalized labeling distance between linked nodes belonging to two different areas. A high value means a strong separation in labeling between the two areas. (d) (e) Energy with respect to frequencies and components.
VI. CONCLUSION
A signal theory approach has been proposed for studying dynamic graphs. It has been shown to offer new ways of highlighting key features in time evolving networks, and in particular in social networks such as bike sharing systems.. Paving the way for further extensions and investigations, the present study is expected to contribute to a better understand-ing of urban rhythms and, more generally, of the structure evolution over time of complex networks in other domains.
ACKNOWLEDGEMENT
This work is supported by the programs ARC 5 and ARC 6 of the region Rhˆone-Alpes
REFERENCES
[1] Y. Shimada, T. Ikeguchi, and T. Shigehara, “From networks to time series,” Phys. Rev. Lett., vol. 109, no. 15, p. 158701, Oct. 2012. [2] A. Bertrand and M. Moonen, “Seeing the bigger picture: How nodes
can learn their place within a complex ad hoc network topology,” Signal Processing Magazine, IEEE, vol. 30, no. 3, pp. 71–82, 2013.
[3] I. Borg and P. Groenen, Modern multidimensional scaling: Theory and applications. Springer, 2005.
[4] M. Newman, Networks: An Introduction. New York, NY, USA: Oxford University Press, Inc., 2010.
[5] H. Jianxiu, “Cyclic bandwidth sum of graphs,” Applied Mathematics-A Journal of Chinese Universities, vol. 16, no. 2, p. 115121, 2001. [6] P. Borgnat, P. Abry, P. Flandrin, C. Robardet, J.-B. Rouquier, and
E. Fleury, “Shared bicycles in a city: a signal processing and data analysis perspective,” Advances in Complex Systems, vol. 14, no. 03, pp. 415–438, Jun. 2011.