RESEARCH OUTPUTS / RÉSULTATS DE RECHERCHE
Author(s) - Auteur(s) :
Publication date - Date de publication :
Permanent link - Permalien :
Rights / License - Licence de droit d’auteur :
Bibliothèque Universitaire Moretus Plantin
Institutional Repository - Research Portal
Dépôt Institutionnel - Portail de la Recherche
researchportal.unamur.be
University of Namur
Establishing expectations for pan-European diatom based ecological status
assessments
Kelly, M.G.; Gómez-Rodríguez, C.; Pardo, I.; Kahlert, M.; Almeida, S.F.P.; Bennett, C.; Bottin,
M.; Delmas, F.; Rosebery, J.; Descy, J.-P.; Dörflinger, G.; Kennedy, B.; Marvan, P.;
Opatrilova, L.; Pfister, P.; Schneider, S.; Vilbaste, S.
Published in:
Ecological Indicators
DOI:
10.1016/j.ecolind.2012.02.020
Publication date:
2012
Document Version
Early version, also known as pre-print
Link to publication
Citation for pulished version (HARVARD):
Kelly, MG, Gómez-Rodríguez, C, Pardo, I, Kahlert, M, Almeida, SFP, Bennett, C, Bottin, M, Delmas, F,
Rosebery, J, Descy, J-P, Dörflinger, G, Kennedy, B, Marvan, P, Opatrilova, L, Pfister, P, Schneider, S &
Vilbaste, S 2012, 'Establishing expectations for pan-European diatom based ecological status assessments',
Ecological Indicators, vol. 20, pp. 177-186. https://doi.org/10.1016/j.ecolind.2012.02.020
General rights
Copyright and moral rights for the publications made accessible in the public portal are retained by the authors and/or other copyright owners and it is a condition of accessing publications that users recognise and abide by the legal requirements associated with these rights. • Users may download and print one copy of any publication from the public portal for the purpose of private study or research. • You may not further distribute the material or use it for any profit-making activity or commercial gain
• You may freely distribute the URL identifying the publication in the public portal ?
Take down policy
If you believe that this document breaches copyright please contact us providing details, and we will remove access to the work immediately and investigate your claim.
EcologicalIndicators20(2012)177–186
ContentslistsavailableatSciVerseScienceDirect
Ecological
Indicators
j ou rn a l h o m e pa g e :w w w . e l s e v i e r . c o m / l o c a t e / e c o l i n d
Establishing
expectations
for
pan-European
diatom
based
ecological
status
assessments
Martyn
G.
Kelly
a,∗,
Carola
Gómez-Rodríguez
b,
Maria
Kahlert
c,
Salomé
F.P.
Almeida
d,
Cathy
Bennett
e,
Marius
Bottin
f,
Franc¸
ois
Delmas
f,
Jean-Pierre
Descy
g,
Gerald
Dörflinger
h,
Bryan
Kennedy
i,
Petr
Marvan
j,
Libuse
Opatrilova
k,
Isabel
Pardo
b,
Peter
Pfister
l,
Juliette
Rosebery
f,
Susanne
Schneider
m,
Sirje
Vilbaste
naBowburnConsultancy,11MonteigneDrive,Bowburn,DurhamDH65QB,UK
bDepartamentodeEcologíayBiologíaAnimal,FacultaddeBiología,CampusLagoas-Marcosende,36200Vigo,Spain
cDepartmentofAquaticSciencesandAssessment,SwedishUniversityofAgriculturalSciences,POBox7050,SE75007Uppsala,Sweden
dGeoBioSciences,GeoTechnologiesandGeoEngineering(GeoBioTec)ResearchUnit,DepartmentofBiology,UniversityofAveiro,3810-193Aveiro,Portugal eScottishEnvironmentProtectionAgency,InverdeeHouse,BaxterStreet,Torry,AberdeenAB119QA,UK
fREQUEResearchUnit,Cemagref–BordeauxCentre,50,AvenuedeVerdun,Gazinet,France
gLaboratoired’EcologiedesEauxDouces,URBO,DépartementdeBiologie,UniversitédeNamur,RuedeBruxelles61,B-5000Namur,Belgium hDivisionofHydrometry,WaterDevelopmentDepartment,Cyprus
iEPA,JohnMooreRoad,Castlebar,Co.Mayo,Ireland jLimnis.r.o.,Kalvodova13,61600Brno,CzechRepublic
kVyzkumnyustavvodohospodarskyT.G.Masaryka,v.v.i.Podbabska30,16000Praha6,CzechRepublic lARGELimnologie,Hunoldstr.14,A-6020Innsbruck,Austria
mNorwegianInstituteofWaterResearch,Gaustadalleen21,0349Oslo,Norway
nEstonianUniversityofLifeSciences(formerEstonianAgriculturalUniversity),Riia181,51014Tartu,Estonia
a
r
t
i
c
l
e
i
n
f
o
Articlehistory:
Received3November2011
Receivedinrevisedform31January2012 Accepted7February2012
Keywords:
Waterframeworkdirective Diatoms
Phytobenthos Rivers Monitoring
a
b
s
t
r
a
c
t
TheEuropeanUnion(EU)WaterFrameworkDirectivedepends,foreffectiveimplementation,on Mem-berStates(MSs)agreeingtoaconceptoftheunimpacted“reference”state,whichwillthenprovide the“expected”valueinEcologicalQualityRatio(EQR)calculations.Referenceassemblagesoforganism groupswill,inturn,vary,duetogeological,hydrological,climatic,physicochemicalandbiological fac-tors.MemberStatestacklethisbyestablishing“types”whichsharecommoncharacteristics.However, forthepurposesofensuringconsistentapplication,broadtransboundarytypeswerealsoestablished withinfiveGeographicalIntercalibrationGroups(GIGs,referredtohereas“regions”)aspartoftheEU’s intercalibrationexercise.Inthispaper,weevaluatethesetypesusingriverdiatomassemblagesandalso providereferencethresholdvaluesfortwocommonmetricsusedinpan-Europeandiatomassessments. Adatabasewasassembled,representing14EUMemberStatesfromIrelandandPortugalintheWest,to EstoniaandCyprusintheEast,inordertoexplorebiogeographicalpatternsinassemblagesunaffected byanthropogenicpressures.Multivariateanalyseswereusedtoexaminethispatternanditsrelationship withgeographic,typologicalandabioticparameters.Aftertaxonomicharmonisation,NMDSordination ofsamplesindicatedweakdifferencesinassemblagecompositionamongregions.ANOSIManalyses,in turn,indicatedthatMSwasthebestfactortogroupsimilarsampleswhereasalkalinity,recognisedas theprimaryenvironmentalvariablestructuringdiatomcommunities,althoughsignificant,explained lessvariabilityinthedataset.This,webelieve,reflectstheimportanceofmethodologicalfactorsother thantaxonomy(e.g.countingprotocol,sampleseason)thatmaybeconstantwithinaMSbutwhich varybetweenMSs.Whentwodiatommetrics,theTIandIPS,wereappliedtothedata,differencesin thedistributionofthemetricscoresbetweenMSweregenerallynotstatisticallysignificanteventhough somedifferencesbetweenregionswereapparent.AtrendofincreasingvaluesofTI(decreasingvaluesof IPS)wasobservedinthesequence:Nordic<Alpine<Mediterranean<Central-Baltic<Eastern Continen-talregions.Additionally,somedifferenceswereobservedamongtypeswithintheMediterraneanand Nordicregions,thoughnotforotherregions.Thedatausedinthisexerciseprovidesuswitharegionand, insomecases,atypespecificbenchmarkdatasetagainstwhichnationalreferencedatacanbecompared.
©2012ElsevierLtd.Allrightsreserved.
∗ Correspondingauthor.
E-mailaddress:[email protected](M.G.Kelly). 1470-160X/$–seefrontmatter©2012ElsevierLtd.Allrightsreserved. doi:10.1016/j.ecolind.2012.02.020
1. Introduction
TheprincipleunderlyingtheWaterFrameworkDirective(WFD: EuropeanUnion,2000)isthatallwaterbodies,regardlessoftypeor location,throughouttheEUshouldbemanagedinaconsistentand transparentmanner,withcommonunderstandingofhowmuch deviationfromthenaturalstatewaspermissiblebefore preventa-tiveorrestorativeactionwasneeded.
Althoughmemberstates(MSs)wereeachexpectedtodevelop nationalmethodstoevaluate“ecologicalstatus”,theWFDrequires that methods are expressed as Ecological Quality Ratio (EQR), definedasthe“observed”(O)valueofacandidatemetric,divided bythatvalue“expected”(E)atreferencecondition(O/E). Conse-quently,itisimportantthatallMSshaveacommonunderstanding ofthebiologicalstateat“reference condition”,asitisfromthis thattheexpectedvalueisderived.Inpractice,evenifallother vari-ableswereheldconstant,theexpectedvaluewillvarydepending uponthetypeofwaterbodyunderconsideration.Forthisreason, theEUestablishedfiveGeographicalIntercalibrationGroups(GIGs; referredtointhispaperas“regions”)and,withineachregion, differ-entiatedanumberofwaterbodytypes(“types”)inordertoensure like-with-likecomparisonsofbiologicalcommunities.
TheWFDspecifiestheuseofabioticfactorssuchasaltitude, catchmentsizeandgeologytodefinetypeswithinMSandthese same principles were applied tothe development of intercali-brationtypes(ECOSTAT,2004).Thesetypesweredesignedtobe commontypesfor allbiological quality elements(BQEs) which couldbeeasilyappliedbyallMSs.Consequently, thetypesare notoptimisedforanyparticularBQEandfirstattemptsat inter-calibrationindicatedsignificantdifferencesinvaluesofEamong MSswithinaregion.Whilstthismayreflectgenuinedifferences inthenaturaldiatomassemblages,thepossibilitythatdifferent approachesand criteria had beenusedtoselect referencesites couldnotberuledout(Kellyetal.,2009)
Inpractice,thisissuedividesintotwocomponents:the neces-sity for an underlying concept of what “reference condition” actuallyrepresentsandappropriatescreeningstrategiestoselect samplesthatmatchthisconcept.Theconceptispartdetermined bytheWFD,whichrequiresMStocharacterisehydromorphological andphysicochemicalconditionsforwaterbodytypesthatsupport “highecologicalstatus”(HES),andpartbysubsequent documenta-tionfromECOSTAT(e.g.Wallinetal.,2005).Thisworkrecognised that“referencecondition”wasnotnecessarilythe“pristine”state whichis,acrossmuchofEurope,impossibletofindduetohigh pop-ulationdensitiesandalonghistoryofanthropogenicalterationof landscapes.Thereis,inevitably,atensionbetweenecologicaland statisticalfactorsinderivingaviablereferenceconceptand“best attainablecondition”(sensuStoddardetal.,2006)willvaryfrom regiontoregion.Themiddlewayistopursue“minimallydisturbed conditions”,whichattemptstoderive,throughaniterativeprocess, explicitcriteriawhichestablishtheleastamountofambienthuman disturbanceinaregion(Stoddardetal.,2006).
Thecriteriaforselectingsitesunderreferenceconditionshould bebased initially and primarilyon non-biological measuresto avoidcircularity(Baileyetal.,2004;Stoddardetal.,2006).Primary screeninguseddataonlanduseinthecatchment,supplementedby valuesofchemicalvariablesassociatedwithpressures.However, fewsitessurvivedthisintensivescreeningprocessinMSdatasets, leadingtoarisk that,forsomecountries, Ewouldbebasedon limiteddata.AsErepresentsthevalueofbiologicalquality ele-mentsatreferenceconditions,thereferenceconceptneedstoyield sufficientdatabeforerobustinferencestobedrawn.Thiscanbe overcome,tosomeextent,bypoolingdatafromseveralMStoform abenchmarkdataset.Analternativewouldbetouseinformation fromsitesthatfailthefullscreeningbutwhichmaystillbe suit-ableasreferencesitesforcertaincombinationsofbiologicalquality
elements(BQEs)andpressures(theseare“partial”referencesites” sensuECOSTAT,2010).Forexample,hydromorphologicalchanges whichmayimpactthebenthicinvertebrateormacrophyte assem-blagesareunlikelytoaffectmetricsusedtoassessphytobenthos responsetonutrients.Siteswheretherearehydromorphological changesmight,therefore,qualifyas“partial”referencesites.The ideaexploredinthisstudyisthatthesuitabilityofsuchsitescanbe evaluatedbycomparisonwithabenchmarkdatasetof“true” refer-encesites.Thisisapragmaticsolutionbalancingthestatisticaland conceptualneedsofareferencesitenetworkwithinaMS.
One of theBiological QualityElements (BQEs) that MSsare requiredtoassessis“MacrophytesandPhytobenthos”andmany MSsusediatomsasproxiesforphytobenthos.Europe-wide com-parisonsareaidedasmethodsforsamplingandanalysisofdiatoms (CEN, 2003, 2004) are consistent and yield datasets that are amenabletopan-Europeancomparisons.Thefirstintercalibration exercise(Kellyetal.,2009)indicatedvariabilityinreference val-ues,withconsequencesforthecalculationofEQRs.However,due tothevariablequalityofreferencescreeninginthisearlierphase, coupledwiththesmallsizeofdatasetsandthelackofaharmonised approachtotaxonomy,itwasunclearhowmuchofthisdifference representedtruedifferencesindiatomassemblagesatthe refer-encestate,orhowmuchwasmethodological.
Theaimofthispaperistoexaminetheissueofreference condi-tionsforphytobenthos,payingparticularattentiontotheextentto whichdiatomassemblagecompositionandthemetricsusedto cal-culatethephytobenthosIntercalibrationCommonMetric(pICM:
Kellyetal.,2009)varywithinandbetweenregions.Inparticular, wewillevaluatewhethertheintercalibrationtypologyisadequate forphytobenthosataEuropeanscale,whetheranalternative typol-ogyneedstobederivedorwhethercomparisonsshouldbemade onlyattheregionlevel.Weuseadatasetof“true”reference sam-plesandtheoutputswillthenprovidebiologicalcriteriaagainst which“partial”referencesamplesmaybeassessed.Anexample of the latter case would be a sample from an otherwise pris-tineriverthatisdownstreamofaphysicalbarrier,e.g.adam.As manyMSshave onlyalimited numberof referencesites,there arebenefits(e.g.morestatisticallyrobustsamplesizes)inbeing abletousesuchsitestocomputeEfornationalassessment sys-tems.
2. Methods
2.1. Datasetandscreeningprotocols
ThedatausedinthispaperwascollectedbyEUMemberStates, eitheraspartofresearchstudiestodevelopmonitoringtoolsfor theWFD,oraspartofroutinemonitoringprogrammes.Diatom samplecollectionandanalysisfollowedCENguidance(CEN,2003, 2004).Biologicaldata(diatomassemblagecomposition,asrelative abundance–RA)andgeographiclocationandenvironmentaldata werestoredinAccess2000databases.MSsassignedeachsiteto theappropriateregion–Alpine(ALP),Central-Baltic(CB), Eastern-Continental(EC),Mediterranean(MED)orNordic(N)and,within eachregion,totheappropriatetype(Table1)althoughthiswas notalwaysstraightforwardastheintercalibrationtypologyrarely alignedwithnationaltypologies.
Allsitesweresubmittedtoascreeningprocessbasedon thresh-oldsagreedinCB-GIGforartificialandintensiveagriculturalland useaswellaswaterchemistryparameters,i.e.BOD5,O2,NH4,NO3,
NO2,PO4(Bennettetal.,2011).Rejectionthresholdswereapplied
forlanduseandtheleaststringentwater-chemistrythresholdfor CB-GIGtypeswasusedforscreeningpurposes.Allparameterswere evaluatedsimultaneouslyandallsamplesthatdidnotcomplywith, atleast,oneofthethresholdswereremoved.1096samplesfrom
M.G.Kellyetal./EcologicalIndicators20(2012)177–186 179
Table1
Briefsummaryoftheintercalibrationtypology,describedinmoredetailinECOSTAT (2004).
Type Rivercharacteristics
Nordicregion
R-N1 Smalllowlandcatchments,siliceousgeology, moderatealkalinity,clear
R-N2 Small-mediumlowlandcatchments,siliceous geology,lowalkalinity,clear
R-N3 Small-mediumlowlandcatchments,siliceous geology,lowalkalinity,humic
R-N4 Mediumlowlandcatchments,siliceous
geology,moderatealkalinity,clear R-N5 Smallmid-altitudecatchments,siliceous
geology,lowalkalinity,clear
R-N7 Smallhighlandcatchments,siliceousgeology, lowalkalinity,clear
R-N9 Small-mediummid-altitudecatchments,
siliceousgeology,lowalkalinity,humic Central-Balticregion
R-C1 Smalllowlandcatchments,siliceousgeology, sandysubstratum
R-C2 Smalllowlandcatchmentssiliceousgeology, rockysubstratum
R-C3 Smallmid-altitudecatchments,siliceous geology
R-C4 Mediumlowlandcatchments,mixedgeology
R-C5 Largelowlandcatchments,mixedgeology
R-C6 Small,lowlandcatchments,calcareousgeology Alpineregion
R-A1 Pre-alpine;smalltomedium–sizedhigh altitudecatchments,calcareousgeology
R-A2 Alpine;smalltomediumhighaltitude
catchments,siliceousgeology Mediterraneanregion
R-M1 Small,midaltitudecatchments,highly seasonal
R-M2 Medium,lowlandcatchments,highlyseasonal R-M3 Large,lowlandcatchments,highlyseasonal
R-M4 Small/mediumhighaltitudecatchments,
seasonal,highsedimenttransport
R-M5 Smallcatchments,temporary
EasternContinentalregion
R-E1 Carpathians:smalltomedium,mid-altitude catchments
R-E2 Plains:medium-sized,lowlandcatchments R-E3 Plains:largeandverylarge,lowland
catchments
R-E4 Plains:medium-sized,mid-altitude
catchments
R-E5 Balkans:medium-sized,mid-altitude
catchments
R-E6 DanubeRiver:middleanddownstream
stretches
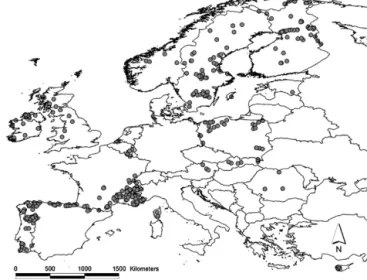
Fig.1.Mapshowinglocationofsamplesites.
533referencesitesin14countriesdistributedacrossallfiveregions passedallofthesecriteria(Fig.1;Table2).
In order toensure that thedataset wasnot biased towards particularregionsorstreamtypes,alimitof20samplesperMS pertypewasestablished;wherethislimitwasexceeded,20 sam-pleswereselectedatrandombutwithanoverridetoensurethat thissamplingmaximisedthenumberofsitesselected(i.e. multi-plesamplesfromthesamesitewereonlyallowedIFthiswasnot attheexpenseofahithertounrepresentedsite).Finally,alltaxa identifiedonlytogenuswereremoved,alongwithtaxawitha pre-dominatelyplanktonichabit,inordertoremovetheinfluenceof upstreamimpoundments.Ifthesecriteriaresultedintheremovalof ≥20%ofthetotalvalves,thesamplewasexcludedfromtheanalysis. Thesescreeningstagesreducedthenumberofreferencesamples availableforanalysesto409samples.
2.2. Diatomtaxonomyandharmonisation
Taxonomicharmonizationtookplace inseveralstages. First, synonymsweremerged,afterwhichweappliedtheconventionsof
Kahlertetal.(inpress)andKellyandEctor(inpress)andremoved anytaxawithamaximumRA≤2%andwithlessthan10records. However,evenafterthistherewerestillsometaxawhose differen-tialtreatmentbyMSmayhaveasignificanteffectontheoutcomes ofanordinationandoverridethetrueecologicalsignal.
Table2
Summaryofthephytobenthosreferencedatabasebyregion.ValuesshownumberofsitesthatfulfilallscreeningcriteriaforeachMemberState,withthenumberofsamples inbrackets.
MS ALP CB EC MED N Totalsites Totalsamples
AT 2(2) 2(2) 4 4 BERW 5(15) 5 15 CY 8(13) 8 13 EE 1(1) 1 1 ES 48(58) 48 58 FI 55(55) 55 55 FR 98(189) 5(5) 57(118) 160 312 IE 1(1) 15(23) 16 24 NO 10(10) 10 10 PL 30(30) 30 30 PT 34(36) 34 36 RO 11(20) 11 20 SE 19(19) 46(46) 65 65 SK 47(169) 48 169 UK 40(199) 20(85) 60 284 533 1096
In order to solve this problem, a second stage of taxa har-monization used Canonical Correspondence Analysis (CCA, Ter Braak1986,1994,1995;Palmer1993;softwarePASTversion1.65, Hammer &Harper March 2007,Hammer et al., 2001)to anal-ysethe dataset.Each MS wasentered as a dummy categorical variable. CCA outcomes were examined for taxa that resulted in the formation of distinct clusters of samples from particu-lar MS at the margins of the data “cloud”. These taxa were thenstudiedmore closelytoseeifthere maybereasons asso-ciatedwithidentificationconventionsfortheirseparation;ifso, apragmaticsolutionwasappliedtothedatasetandtheprocess wasrepeateduntilnoobviousnomenclaturalproblemsappeared after CCA. As a result of this, Diadesmis gallica and D. pusilla were merged,along with Encyonopsis cesatii var. cesatii and E. cesatiivar. geitleri,Navicula symmetricaand N.schroeteri, Tabel-lariaflocculosaandT.fenestrata.Somepracticalidentificationissues remainedbutwouldhaverequiredare-examinationofthe origi-nalmicroscopeslideswhichwasbeyondthescopeofthisparticular project.
2.3. Ordinationandclassification
Diatomassemblage datawereconverted topercentages and then square-root transformed. Non-metric Multi-Dimensional Scaling(NMDS) using Bray-Curtis dissimilarityindex was used to explore the structure of the data (command: metaMDS in Vegan). Analyses of similarity (“ANOSIM”: Clarke, 1993) were used toevaluate whether there were significantdifferences in assemblage composition among types, Member States (MSs), regionsoralkalinityclassesand,therefore,whetherthesefactors could be used to group similar samples. Alkalinity measure-mentsweredividedintofiveapproximatelyequallysizedclasses: very low (<0.1meq/l CaCO3), low (0.1–0.2meq/l), intermediate
(0.2–0.4meq/l),high(0.4–1.0meq/l)and veryhigh(>1.0meq/l). One ANOSIM analysis was conducted for each factor of inter-est. Additionally, independent analyses were carried out for each region, type, MSs or alkalinity classes as grouping factor. Bonferroni correction, to reduce the risk of wrongly rejecting thenull hypothesis, yielded a critical probability of 0.0036 for ˛=0.05 (14ANOSIM tests). “Type”was onlyused asa variable if it was represented in >1 MS. NMDS and ANOSIM analyses were performed using the Rsoftware package (R Project Core DevelopmentTeam,2005)withtheVeganpackage(Oksanenetal., 2007).
2.4. Calculationandanalysisofmetrics
Apreliminaryintercalibrationhasalreadybeenundertakenin Central-Balticregion,thelargestoftheregions, spanningmuch oflowlandEurope.Anintercalibrationmetric,pICM,was devel-oped,basedontwowell-establishedwaterqualitymetrics,Indice dePolluosensibilitéSpecifique(IPS:CosteinCEMAGREF,1982)and Trophieindex(TI:Rottetal.,1999).ThepICMwasthenregressed against national metrics and national EQRs for High/Good and Good/Moderatestatusboundariesconvertedtoequivalentvalues ofpICM.This,then,providedabasisforcomparingthepositionof nationalboundaries(Kellyetal.,2009).
ThecomponentmetricsofthepICM(IPSand TI)were calcu-latedusing queries withintheAccess databaseonall screened samples(theeffectoftaxonomicharmonisationontheoutcomesis minor:seeKellyandEctor,inpress).Differencesinmedianvalues ofIPSandTIbetweenregionsandbetweentypeswithinregions wereexploredusingthenon-parametricKruskal–Wallistestand theMann–Whitneytest.Notallsitescouldbereliablyassignedto
typesbyMS,sotheseanalyseswereperformedonasubsetof319 samples.
2.5. Applicationofresultstointercalibration
Thisexerciseprovidesaframeworkforstatisticalcomparisons ofreferenceconceptsacrossEurope,eveniffullscreening infor-mationisnotavailable.Threescenariosforhowthesebenchmark datasetsmaybeusedtovalidatereferenceandHESdataare exam-ined.Ineachcase,weuseddatasuppliedbyMSsto:
• testthevalidityof“nationalreference”(NR)samplesprovidedby aMSwhichcontributeddatatothebenchmarkdataset; • testthevalidityofreferencedataprovidedbyaMSwhichdidnot
contributedatatothebenchmarkexercise;and,testthevalidity ofhighstatusboundaryprovidedbyaMSwhichdoesnothave referencesites.
3. Results
3.1. Compositionofdiatomassemblagesfromreferencesamples 159harmonisedtaxa wereidentified fromthe409reference samples.Overall,Achnanthidiumminutissimumwasthemost con-stantand,often,mostnumericallyabundanttaxon,foundin98% of samplesacrossall five regions, witha maximum RAof 94% (Table 3). Thiswas followed by Fragilariacapucina (60%, 62.5% respectively)andEncynonemaventricosum(59%,89%respectively). Overall,thedifferencesbetweenregionswererelativelysmall:the mostdistinctoftheregionswasALP,whichwascharacterisedby theabsenceorinfrequentoccurrenceofacid-sensitivetaxa(e.g. Achnanthesoblongella,Eunotiaspp.)reflectingthepredominately calcareousnatureoftheseuplandareas.
Achnanthidiumminutissimumwas alsothetaxonmost likely to predominate in samples, forming the maximum RA of any taxon in 50% of all samples, followed by Cocconeis placentula (8%),Tabellariaflocculosa(6%)andAchnanthidiumpyrenaicum(5%). However,thereweresomeintra-regional differences:inALP, A. pyrenaicumdominatedmorefrequently(37%)thanA.minutisimum (32%)whilst,in EC, Cocconeisplacentula wasthemostcommon dominantspecies(23%),followedbyA. minutissimum(15%)and Gomphonemapumilum(11%).
3.2. Ordinationandclassification
TheordinationtechniqueNMDS(stress=20.9%withtwo dimen-sions)showedalimitedamountofaggregationforsomeregions. ALPregionisthemoststronglyaggregated,withlow valuesfor bothaxes1and2whilstECandMEDregionshaveoverlapping distributionswithlowAxis1scores.SamplesfromNregiontend tohavehighaxis1scoreswithsamplesfromCBregiondispersed throughoutthediagram(Fig.2).ANOSIManalysesdemonstrated significantdifferencesinassemblagecompositionamongregions, MSsandtypes(Table4).TheR-statisticintheregionalANOSIMwas lowerthanthatofeitherMSortype(Table4).TheANOSIMtesting alkalinityasagroupingfactorexplainedlessvariancethanregion, typeorMS.
3.3. Variationinmetrics
Asignificanteffectofregionwasalsoobservedwhenvaluesof theconstituentmetricsoftheICMwerecompared(Fig.3;Table5) withALPandNregionshavinghighermeanvaluesofIPSandlower valuesforTIthantheothers. ECregion,in particular,had some sampleswithlowvaluesofIPS/highvaluesofTI.
M.G.Kellyetal./EcologicalIndicators20(2012)177–186 181
Table3
Thethirtytaxamostcommonlyencounteredinallreferencesamplesinthedatasetalongwiththeirmaximumrelativeabundance(“Max”)andtheproportionofsamplesin whichthetaxawerefound(“constancy”).Inmostcases,taxanamesrefertospeciesasunderstoodbyKrammerandLange-Bertalot(1986,1997,2000,2004)andassociated varieties;exceptionsarelistedinKellyandEctor,inpressorSection2.
Taxon All ALP CB EC MED N
Max Constancy Max Constancy Max Constancy Max Constancy Max Constancy Max Constancy Achnanthidiumminutissimum (Kütz.)Czarnecki 95.5 69.0 88.5 38.7 95.5 90.7 93.7 31.9 93.6 52.8 92.4 86.8 Achnanthidiumpyrenaicum (Hustedt)Kobayasi 95.7 21.5 77.5 36.8 92.5 20.2 95.7 17.0 71.8 33.5 30.3 10.0
AchnanthesoblongellaOestrup 51.4 18.0 51.4 31.8 11.9 3.7 41.7 28.3
Amphorapediculus(Kützing) Grunow
60.5 21.9 23.0 18.9 22.3 33.6 21.3 21.5 60.5 24.8 1.3 4.1
Brachysiravitrea(Grunow) RossinHartley
31.5 14.4 8.6 14.0 0.8 2.5 31.5 39.7
CocconeisplacentulaEhrenb. 79.5 41.3 71.2 27.4 78.9 63.6 79.4 28.9 79.5 44.7 47.1 20.5
Eunotiabilunaris(Ehrenb.)F.W. Mills
32.7 16.0 32.7 17.8 1.2 0.7 1.2 5.0 19.8 38.8
EunotiaimplicataNörpel. Lange-Bertalot&Alles
36.9 15.5 10.4 15.0 36.9 44.7
Eunotiaminor(Kützing) GrunowinVanHeurck
15.8 14.6 15.8 16.2 0.3 0.7 8.9 8.1 13.9 32.9
EncyonemaneogracileKrammer 14.4 15.8 2.0 2.8 14.4 17.4 10.6 5.6 4.8 37.0
Encyonemaventricosum(Ag.) Grunow
89.2 41.7 89.2 34.0 36.2 56.1 29.3 20.7 9.7 43.8
Eolimnaminima(Grunow) Lange-Bertalot
61.6 17.6 3.8 3.8 18.6 29.3 14.8 9.6 53.7 19.9 61.6 10.5
Fragilariacapucina Desmazieres
62.5 48.6 3.3 16.0 58.8 70.1 6.1 10.4 49.4 27.3 62.5 72.1
Fragilariavaucheriae(Kutz.) J.B.Petersen
25.0 35.6 9.4 10.4 23.4 51.4 6.5 12.6 20.7 21.7 25.0 48.9
Gomphonemaolivaceum (Hornemann)P.Dawson
27.0 14.9 9.3 26.4 19.3 19.3 18.7 16.3 4.7 6.8 27.0 7.8
Gomphonemaparvulum(Kutz.) Kutz.
61.4 27.5 0.8 3.8 61.4 41.4 6.4 5.9 14.2 16.8 26.9 39.7
Gomphonemapumilum(Grun.) Reichardt&Lange-Bert
86.0 33.3 67.8 34.9 80.6 39.9 65.7 26.7 86.0 46.6 27.5 17.4
Hannaeaarcus(Ehr.)Patrick 76.3 23.4 9.6 22.6 76.3 30.8 36.4 5.2 5.1 11.8 17.9 32.4
Meridioncirculare(Greville) C.A.Agardh
22.6 15.5 1.5 8.5 5.4 21.8 10.9 15.6 13.9 5.6 22.6 16.9
NaviculacryptocephalaKützing 7.5 13.7 0.3 1.9 5.2 19.9 7.5 6.7 4.3 13.0 6.4 15.1
Naviculacryptotenella Lange-Bertalot
25.4 21.2 1.8 20.8 17.8 27.1 3.7 12.6 25.4 32.9 2.8 9.6
Nitzschiadissipata(Kützing) Grunow
15.0 22.6 6.5 19.8 11.4 36.1 15.0 16.3 8.7 16.8 3.8 12.3
NaviculagregariaDonkin 39.7 19.4 0.3 4.7 39.7 38.0 10.5 14.8 1.9 8.7 7.9 10.0
Naviculalanceolata(Agardh) Ehrenberg
64.3 17.2 1.5 2.8 59.0 34.0 64.3 20.7 0.9 2.5 16.3 8.2
Nitzschiapalea(Kutz.)W.Sm. 59.5 16.5 9.2 3.8 17.9 29.0 59.5 3.0 19.5 17.4 8.5 11.9
Naviculatripunctata (O.F.Müller)Bory
40.8 14.1 3.0 11.3 18.0 20.9 40.8 22.2 5.7 13.7 4.2 0.9
Planothidiumlanceolatum (Breb.)RoundetBukh.
42.3 16.6 2.5 11.3 9.4 21.5 42.3 21.5 10.6 14.3 3.6 10.5
Reimeriasinuata(Gregory) Kociolek&Stoermer
28.0 28.8 26.3 25.5 26.1 43.3 19.5 24.4 28.0 25.5 24.8 14.2
Synedraulna(Nitzsch)Ehr. 70.7 25.8 2.1 9.4 30.9 35.8 70.7 16.3 2.9 11.8 18.3 35.2
Tabellariaflocculosa(Roth) Kützing
88.2 31.2 88.2 36.1 18.2 1.5 8.8 4.3 86.2 77.2
N.taxa 192 95 186 108 145 169
N.samples 942 106 321 135 161 219
Table4
Anosimresultsforentiredatasetof409referencesamples.P-valueafterBonferronicorrectionis0.0036for˛=0.05.
Variable R Significance Comment Numberofsamples
Region 0.338 *** 409
MS 0.511 *** OnlyMSwith5ormoresamplesincluded.AT(3samples)
andEE(1sample)excluded(toofewsamples)
405 Type 0.355 *** RC1,RE4,RN4removed(toofewsamples)RA2excluded
(19samples,allinFR);RM3excluded(7samples,allinPT)
287
Alkalinity 0.285 *** Datamissingformanysamples 278
Fig.2.NMDSplotshowingtheordinationofsamples,classifiedbyregion,basedon speciesrelativeabundanceandBray-Curtisdissimilarity.
Therewerenosignificantdifferencesforeithermetricwithin ALP,ECandMEDregionsbutbothshowedsignificantdifferences forCBandNregions.Allregions,exceptALP,showedasignificant differencebetweenMSforTIwhilstCBandNregionsalsoshowed asignificanteffectforIPS.InthecaseofNregion,lowerIPSandTI valuesareassociatedwithhumicstreamtypesandtheremaybe acasefortreatingtheseseparately.However,moreworkwillbe neededtoensurethatthisisnotconfoundedbyaMSeffect. 3.4. Applicationoftheseresultstointercalibration
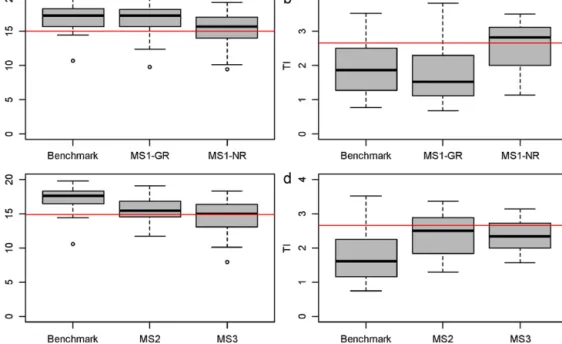
3.4.1. Scenario1:testingvalidityofNRsamplesprovidedbyaMS whichcontributeddatatothebenchmarkdataset
Thepopulationofreferencesamplesavailableforthistestwas greaterthanthatcontributedtothebenchmarkdataset,asefforts hadbeenmadewithintheMSinquestiontoexpandthepoolof referencesamplesavailable.Theseadditionalsamplesrepresent bothextrasitesandmoresamplesfromsitescontributingtothe benchmarkdataset.MS1-GR,thereforeisnotwhollyindependent ofthebenchmarkdataset;howeveritisclearfromFig.4aandb thatthetwodatasetshaveverysimilarvaluesforIPSandTI.By con-trast,MS1-NRissignificantlydifferentfromthebenchmarkdataset (p<0.001forbothIPSandTI).Hadtherebeennosignificant differ-ence,MS1-NRcouldqualifyas“partial”referencesites.However, asastatisticallysignificantdifferencewasfound,MS1nowneeds totakeextrastepstoensurethevalidityofpredictionsmadefrom
Table5
SignificanceofdifferencesinTIandIPSvaluesbetweenregionsandbetweentypes withinregions,assessedusingKruskal–Wallistest.
Betweentype BetweenMS Notes
TI IPS TI IPS Betweenregions <0.001 <0.001 <0.001 <0.001 Withinregions ALP 0.239 0.150 0.364 0.276 2MS: mostly FRdata CB 0.001 0.002 <0.001 <0.001 6MS EC 0.931 0.611 0.053 0.519 2MS MED 0.084 0.575 0.001 0.196 3MS N <0.001 <0.001 <0.001 <0.001 3MS
thesesamples(notethatsomeoftheMS1-NRsamplesrepresented the“bestavailable”sitesforstreamtypeswithno“true”reference sitesavailable).
3.4.2. Scenario2:testingvalidityofreferencedataprovidedbya MSwhichdidnotcontributedatatothebenchmarkexercise
Fig.4canddshowscleardifferencesinIPSandTI,bothofwhich arehighlysignificant(p<0.001)suggestingthatMS2ssamplesdo notfulfilthecriteria.MS2thenreconsidereditsreferencedataand adjusteditscriteria.Itcouldalsohavemadeareasonedcaseforthis discrepancy(itispossible,forexample,thattheirnationaltypes arenotrepresentedinthebenchmarkdataset).Hadtherebeenno significantdifference,therewouldhavebeen,attheveryleast, reas-surancethatMS2sEQRvalueswerecomparablewiththosefrom otherMS.
3.4.3. Scenario3:testingvalidityofhighstatusboundary providedbyaMSwhichdoesnothavereferencesites
Highecologicalstatus(HES)samplesfromMS3,whichset ref-erencevaluesbyexpertjudgement,arealsoplottedinFig.4candd alsoshowsasignificantdeviationinIPSvalues(p<0.001)forboth metrics,suggestingthatMS3sexpertjudgementofHESmayneedto bere-evaluated.Thebenchmarkdatasetprovidesaresourcewhich MS3’sexpertsmayusetocomparefuturedata.
4. Discussion
TheWFDembodiestheEU’sprincipleofsubsidarity,leavingthe detailsofimplementationtoindividualMSs.Theintercalibration exerciseexistsprimarilytoensureconsistentapplicationofthe ecologicalprinciplesoftheWFD;atthesametimethoseinvolved inintercalibrationneedtorecognisethatmultiplesolutionstothe challengesraisedbytheWFDarepossible.ByensuringthatMSs havecommonconceptsofreferenceconditionsandgood ecolog-icalstatus(“GES”),intercalibrationensuresconsistentapplication ofthereferenceconcept.
The harmonised ecological status class boundaries which emerge fromthe intercalibrationexercise are, however,legally bindingontheMS.TheGESboundary,inparticular,has signifi-cantregulatoryimplications,potentiallyleadingtohighercostsfor watertreatmentforbothindustryandconsumers.Thereare, there-fore,largefinancialconsequencesofthisworkandweneedtofind abalancebetweenanecologicallydefensibleapproachtoreference condition,andonethatispracticalforMSstoimplement. 4.1. Selectionofreferencesites
Theapproach todefining Europeanreferenceconditions has evolved in the decade since the WFD was first published. The definitionintheWFDitselfregardsthereferencestateasthe hydro-morphologicalandphysicochemicalconditionswhichsupportHES whilst,at thesame time, defining HESas thebiological condi-tionswhich“reflectthosenormallyassociatedwiththattypeunder undisturbedconditions”.Muchsubsequentworkhasinvolved try-ingtounpickthisingrainedcircularity,particularlyasthelackof referenceconditionsinmanyareasledtosubjectivedefinitionsof HESwhichweredifficulttovalidateinpractice.Theoutcomeof thishasbeenatrend,startingwithWallinetal.(2005),towards definingreferenceconditionsusingabioticcriteriaalone,andthen usingbiologicalassessmentsfromsiteswhichpassedthese crite-riatogenerate“expected”valuesofmetrics.Inthispaperwehave identifiedreferencesitesusingabioticcriteriaandthendefine bio-logicalreferencevaluesfortheintercalibrationmetricsfollowing AnnexIIIofthenewICguidance(Wallinetal.,2005;ECOSTAT, 2010).Thisdatasetcanthenbeusedasabenchmarkagainstwhich
M.G.Kellyetal./EcologicalIndicators20(2012)177–186 183
Fig.3.VariationbetweenvaluesofIPSandTIofreferencesampleswithinandbetweenthefiveregions.Horizontallinesshowmedianvalues;boxesshow25thand75th percentilesofthedata.(a,b)Comparisonbetweenregions;(c–f)comparisonswithinregions:(c,d)ALP;(e,f)CB;(g,h)EC;(i,j)MED;(k,l)N.
otherdatasetscanbeevaluated,evenifabioticpressuredataare notavailable.
However,a distinction needsto bedrawn betweena refer-encesiteandsamplescollectedfromthatsite.Inthis study,we notedoccasionalsamplesfromapparentlypristinesiteswhichhad diatomassemblagessuggestingimpactedconditions.However rig-orousthescreening,wecannotexcludeallshort-termincidents thatmayhave affectedthebiology andwe mustalsoallowfor thepossibilitythatentirelynaturaleventsmayleadtolocalised
enrichmentforaperiodoftime.Inotherwords,asinglesample whosecompositionsuggestsimpactis not,ofitself,groundsfor decidingthatasiteisnotinreferencecondition,solongasthesite fulfilstheabioticcriteria.Suchsituationsshould,however,prompt are-checkingofabioticcriteriaaswellasadditionalbiological sam-pling.Weregardtheabioticscreeningprocessandthebenchmark datasetswhichresultasthestartingpointfordebateand discus-sion,notasafinalandunambiguousstatementonthebiological assemblagesassociatedwith“referencecondition.”
Fig.4.Useofthebenchmarkdatasettovalidatereferenceandhighecologicalstatusconcepts:examplesfromtheCentral-Balticregion.Benchmark;MS1-GR:subsetof samplesfromsiteswhichfulfilallcriteriaforreferenceconditions,MS1-NR:samplesfromaMemberStatewhichparticipatedinthereferencescreeningexercisebutwhich alsohasapopulationof“nationalreference”samples;MS2:samplesfromaMemberStatewhichdidnotparticipateinthescreeningexercise;MS3:“highecologicalstatus” samplesfromaMemberStatewithnoreferencesites.Horizontallinesrepresentthe10thpercentileofIPSand90thpercentileforTI.Seetextformoredetails.
4.2. Testingtheintercalibrationtypology
Theintercalibrationtypologywasestablishedearlyinthe inter-calibrationprocess,based onknownpredictors of streambiota (ECOSTAT,2004);however,neitherthisstudynorearlierstudies onphytobenthos(Kellyetal.,2009)indicatethatitisa particu-larlyusefulapproachfordifferentiatingbetweendifferentstream types.Inthisprojectitwasanticipatedthat acombinationof a largerdatabasethanwasavailableinKellyetal.(2009)andthat ahighstandard ofreferencescreeningwould allowaworkable typology,perhapsstraddlingexistingGIGboundaries,toemerge. Thisprovednot tobethecase: althoughsignificantdifferences betweenregionswereobservedusingbothNMDS(Table4)and diatommetrics(Table6),itwasMSratherthantypeoralkalinity thatemergedasthemostpowerfulfactorstructuringthedataset. Thelackofeffectforalkalinitywasparticularlynoteworthy,asmost MSsrecognisethisasthekeyvariablestructuringdiatom assem-blagesintheabsenceofpressurewithintheirnationalassessment systems(Tisonetal.,2005;Kellyetal.,2008).
Itispossiblethatsomeofthecompromisesnecessarytoproduce aharmoniseddatasetdecreasedthesensitivityofthe multivari-ateanalysesbutalternatively,methodologicaldifferencesbetween MSmaskedtheexpectedalkalinity-drivensignal.AlthoughallMSs adheredtostandardmethods(CEN,2003,2004),thesearebroadly writtenandthereisscopeforinterpretationtosuitlocal circum-stances.Kahlertetal.(inpress)notedthatharmonisingtaxonomy followingsimilarconventionstothoseadoptedinthispaperhad
Table6
Medianplus10th(forIPS)and90th(forTI)percentilesofmetricsvaluesrecorded fromreferencesamplesforeachoftheregions.Valuesfortheentireregionarealso given(X-GIG).
ALP CB EC MED N X-GIG
IPS Median 18.8 17.7 16.7 17.7 19.3 18.3
10th%ile 15.5 15.0 14.9 14.3 18.0 15.0
TI Median 1.32 2.00 2.10 1.55 1.14 1.52
90th%ile 1.96 2.66 2.71 2.52 1.69 2.56
littleeffectonbetween-operatorvariationinapan-European ring-test,andsuggestedotheraspectsofprocedure(e.g.treatmentof brokenvalves)maycontributesystematicerrorstotheanalytical process.Inthepresentstudy,differentsamplingpracticesmayalso haveledtodifferencesinspeciescompositionforthesamples pro-videdbyindividualMS.Suchpracticeswillvaryforgoodreasons (seeKellyetal.,1998forafullerdiscussion)but,asstreamalgae displaydistinctperiodicity(e.g.Marker,1976),adjacentMSswhich adoptdifferentsamplingregimesfor otherwise similarstreams mayhavequitedifferentdiatomassemblages.TheICexercisehas toworkwithintheconstraintsimposedbysuchlimitations.We didattempttoaccountfor“season”inouranalyses;however,crisp delimitationofseasonsisdifficultina datasetspanninganarea from60◦Nto35◦Sand10◦Wto37◦E.
Althoughnocaseforatypologybasedonthediatom assem-blagewithinregionscanbemadefromthesedata,thisislikelydue tothenatureoftheintercalibrationexerciseratherthanreflecting thetrueconditionofphytobenthosassemblages.Akeyquestion forthepresentexercise,therefore,iswhetherornotfurtherwork wouldimproveintercalibrationofboundaries:eachMSmayhave aninternallyconsistentapproachwhichallowsspatialand tempo-ralcomparisonswithinapoliticalunit;differencesbetweenthese approachesmaythenhavetoberegardedas“noise”forthe pur-posesofintercalibration.
4.3. Implicationsfordiatombiogeographyandecology
Apositiveviewoftheresultspresentedhereisthatitis pos-sibletogotoastreamalmostanywhereinEuropewithafairly goodideaofwhatdiatomswemightexpecttofindintheabsence ofanthropogenicpressure.Table3showshowmanydiatomtaxa arecosmopolitanacrossthestudyareaandwhilstsome biogeo-graphicaldifferencesareapparent(lowRAofAchnanthesoblongella andEunotiaspp.coupledwithrelativelyhighRAof Achnanthid-iumpyrenaicuminALP,forexample),itistheconsistencyofthese assemblagesthatismoststriking.Thecounterview,however,is thatthisconsistencywasonlyobtainedbymergingseverallarge
M.G.Kellyetal./EcologicalIndicators20(2012)177–186 185 speciescomplexesandopinionamongsttheauthorsisdividedon
theextenttowhichthisrepresentsalossofecological informa-tion.Manynewspecieshavebeendescribedinrecentyears(e.g.
Krammer,1997a,b,Lange-Bertalot,2001;Mannetal.,2008); how-ever,theecologicalimplicationsofthisknowledgearenotyetclear. Thereissomeevidenceforspecieswithincomplexeshaving dis-tinctecologicalpreferences(Poulíˇckováetal.,2008,forSellaphora pupulaag.,inlakes;PotapovaandHamilton,2007,for Achnanthid-iumminutissimum)buttwoissuesarise:
• Can these fine-level differences be resolved reliably by ana-lysts(Kahlertetal.,2008,inpress)?Ifnot,additional“signal” isswampedbyanalytical“noise”;
• Dothesedifferencesactuallyrepresent differencesin ecologi-calfunctioning?Thisdecomposes“ecologicalstatus”intotwo components:theeffectofapressureonthephytobenthosand theconsequenteffect ofthe changestothe phytobenthoson othertrophiclevels.Fine-scaletaxonomymightprovideinsights intotheformerbutifgrazers,forexample,donotdifferentiate betweencloselyrelatedspeciesofdiatom,thendifferentiation willaddnothingtoourholisticviewofecologicalstatus. Devel-opmentandselectionofWFDtoolshasfocussedalmostentirely ontheformer(e.g.Heringetal.,2006)whereasgreaterfocuson thelatterwouldseemtoofferanumberofusefulinsightstowater managers.
Aninterpretationofourresults,bearingthesepointsinmindis thatthetaxonomyofKrammerandLange-Bertalot(1986,1997, 2000,2004) maybeadequate torepresentthe mainecological gradientsacrossEurope.Usingthistaxonomy,onlyweak biogeo-graphicpatternsemergesuggestingthattherearefew limitsto dispersionandthemainclimaticdriverssuchaslatitudinal tem-peraturegradientsarelessimportantthanmethodologyandlocal environmentalfactors(Bennettetal.,2010).Ifmorerefined tax-onomyisused,biogeographicaldifferenceswithinthesegradients mayemergebutinterpretationiscomplicatedwithinandbetween regionsbythelackoftaxonomicprecision.Onceagain,consistent taxonomyisbetterachievablewithinthanbetweenMSsandthe intercalibrationexerciseneedstoworkwithintheseconstraints. 4.4. Implicationsforintercalibration
Thisprojectallowedalargedatasettobecompiledalthoughstill only14ofthe27MSarerepresented.Althoughthegeographical spreadoftheseissufficientlywideforthistoberepresentativeof theEUasawhole,westillneedtointerpretresultswithcaution asthepositioningofecologicalstatusboundariesmayhave signif-icantfinancialimplicationsforMS.Resultspresentedheresuggest thatworkingatregionallevelismostappropriate;theremaybea fewtypeswithacharacteristicecologicalresponsebutwebelieve thattheseshouldonlybedistinguishedfromtheregionasawhole whereseveralMScontributedata.Wehave alsoemphasisedin thispaperthatgreatersensitivityshouldbeachievablewithinMS (although,evenhere,dataprecisionshouldnotbeautomatically assumed).
Theresultsalsopointtotheadvantagesofusingmetricssuch as the IPS and TI. Although potentially useful information on assemblagecompositionislostormergedintobroad“sensitivity” categories,suchmetricshelptoiron-outvariabilityduetofactors suchassubstratum,season,positionofthephytobenthos assem-blagewithinamicrosuccession,etc.Theoutcome,foreachregion, isa“benchmarkdataset”,integratingthediatomassemblagesof allsamplesthatsurvivethescreeningprocess.Nonetheless,some typesofstream(e.g.veryhighalkalinitystreamsinCBregion)will beunder-representedasveryfewsitesmeetallscreeningcriteria. Theimplicationofthisisthatthebenchmarkdatasetsshouldguide
theintercalibrationprocessbutnotbetreatedassettingabsolute limits.
ThevaluesinTable6arerecommendedaslimitsforthe con-stituentmetricsofthepICMthatcanbeappliedacrossaregion, forthepurposesofintercalibration.Thesevaluesalsoprovidea meansofvalidatingEforthoseMSwhodonothavereference val-uesoftheirown(e.g.BE-FL,NL).Wealsorecommendthemedian valuesofthebenchmarkdatasetsasinterimexpectedvaluesfor thoseMS whohavenot yetadoptedanationalmethod, believ-ingthattheintercalibrationprocesshasprovidedasimplemetric (pICM)that is effective acrossthe EUplus, now, validated ref-erencevalues. Incombination withthesamplingand analytical methods(CEN,2003,2004),theseprovidean“off-the-shelf” solu-tion for fulfilling obligations for assessing phytobenthos. Some furtherresearchis requiredtoexplorevariationwithinregions, to evaluateif within-region (oreven cross-region)super-types are valid, and whether this improves the sensitivity of inter-calibration. The principal limitation is the lack of comparable environmentaldatafrom MS.MostMSshave internally consis-tentenvironmentaldatasetsthathaveenabledthemtodevelop robusttypologiesormodelsthataremoresensitivetotheirown conditionsthanvaluesproducedhereandwemustemphasisethat thisexercisevalidatesbutdoesnotreplacenationalreference val-ues.
The expectation, therefore, is that metric values for a MS’s referencesitesshouldfallwithinthestatisticallimitsofthe bench-markdatasetfortheregioninquestion.Statisticaltestingofthe hypothesisthatsamplesaredrawnfromthesamepopulationis complicated bythenon-parametric distributionand interpreta-tionisnotstraightforwardasunderlyingtypologicalfactorsmay exertaninfluencewhichmayclustertheMS’sdatatowardsone endofthebenchmarkdataset.Finally,althoughwehavescreened sitesrigorouslyusingabioticcriteria,therewillbeafewsamples thatsuggestedenrichment,eitherduetounknownpollutionevents priortothesampling/screeningexercise,orduetonaturalcauses (deathand decayofananimalcarcassinthestream,for exam-ple).Aswedonotalwayshaveperfectknowledgeofasitepriorto samplingandastheremaybenaturalprocessesthatcould poten-tiallycontributetoanepisodicincreaseinnutrientconcentration, itwouldbeunwisetorejectthesesamplesoutright.Wetherefore suggestthatthe90thpercentileforTI(10thpercentileforIPS)as apragmaticcriterionforMStousetochecktheirownreference condition.ThoseNRsitesthatfalloutsidetheselimitswillneed tobere-evaluatedandtheexpectationshouldbethatmostofthe referencesiteschosenbyaMSnotinvolvedinthisexercisewill fallwithinthe90th(or10th)percentileunlesstheMScan other-wiseprovideanecologicaljustificationforthedeviation.Overall, ourambitionshouldbetominimisetheroleofexpertjudgement and“gardening”ofdatasetstopurgesitesthatdonotconformtoa subjective“ideal”.
4.5. Concludingcomments
Thenatureoftheintercalibrationexercise,followingaperiod ofmethoddevelopmentbyindividualMS,meansthattheprocess haslittleopportunitytoinfluencecollectionofthedatawithwhich ithastowork.Eventhoughcommonstandardsfordatacollection andanalysisareapparentlyinuse,therewasconsiderablevariation duetoMS,whichlimitsthesensitivityoftheanalysesperformed. Intercalibrationis,however,the“artofthepossible”,recognising thattheprimarypurposeofdatacollectedbyindividualMSistofit intoongoingwatermanagementprograms.Yet,atthesametime, theintercalibrationexercisehaspresentedanexcellent opportu-nitytogeta continent-wideviewofthecomposition ofdiatom assemblagesinnear-pristinecondition.
Acknowledgements
Contributorstothispaperacknowledgethesupportofnational environmentalagenciesforprovisionofdataandfinancialsupport. M.G.K.: Scottish and Northern Ireland Forum for Environmen-tal Research; M.K.: Swedish Environmental Protection Agency; S.F.P.A.:PortugueseWaterInstitute(INAG);L.O.andP.M.:Ministry oftheEnvironmentoftheCzechRepublicwithintheInstitutional researchplanMZP0002071101–ResearchandProtectionofthe Hydrosphere;S.S.:NorwegianDirectorateforNatureManagement. Inaddition,wearegratefultotheSwedishEnvironmental Protec-tionAgencyforsupportfortheworkshopattheErkenFieldStation inSwedenandtoRichardJohnson.(UniversityofAgricultural Sci-ences,Uppsala,Sweden)andEckhardCoring(EcoRing,Hardegsen, Germany)forhelpfulcommentsonadraftmanuscript.
References
Bailey,R.C.,Norris,R.H.,Reynoldson,T.B.,2004.BioassessmentofFreshwater Ecosys-tems:UsingtheReferenceConditionApproach.KluwerAcademicPublishers, NewYork.
Bennett,C.,Owen,R.,Birk,S.,Buffagni,A.,Erba,S.,Mengin,N.,Murray-Bligh,J., Ofenböck,G.,Pardo,I.,vandeBund,W.,Wagner,F.,Wasson,J.-G.,2011.Bringing Europeanriverqualityintoline:anexercisetointercalibratemacro-invertebrate classificationmethods.Hydrobiologia667,31–48.
Bennett,J.R.,Cumming,B.F.,Ginn,B.K.,Smol,J.P.,2010.Broad-scale environmen-talresponseandnicheconservatisminlacustrinediatomcommunities.Global EcologyandBiogeography19,724–732.
CEN,2003.Waterquality-Guidancestandardfortheroutinesamplingand pre-treatmentofbenthicdiatomsfromrivers.EN13946:2003.ComitéEuropeande Normalisation,Geneva.
CEN,2004.Waterquality–Guidancestandardfortheidentification, enumera-tionandinterpretationofbenthicdiatomsamplesfromrunningwaters.EN 14407:2004.ComitéEuropeandeNormalisation,Geneva.
Clarke,K.R.,1993.Non-parametricmultivariateanalysisofchangesincommunity structure.AustralianJournalofEcology18,117–143.
CEMAGREF,1982.EtudedeMéthodesBiologiquesQuantitativesd’Appreciationde laQualitédesEaux.RapportQ.E.Lyon-A.F.B.Rhône-Mediterrannée-Corse. ECOSTAT,2004.OverviewofCommonIntercalibrationTypes.WorkingGroup2.
AEcologicalStatus,Final Version5.1. Availablefrom: http://ec.europa.eu/ environment/water/water-framework/objectives/indexen.htm.
ECOSTAT,2010.GuidanceDocumentontheIntercalibrationProcess2008–2011.102 pp.CommonImplementationStrategyfortheWaterFrameworkDirective. Hammer,O.,Harper,D.A.T.,Ryan,P.D.,2001.PAST:palaeontologicalstatistics
soft-warepackageforeducationanddataanalysis.PalaeontologicaElectronica4(1), 9pp.
Hering,D.,Johnson,R.K.,Kramm,S.,Schmutz,S.,Szoszkiewicz,K.,Verdonschot, P.F.M.,2006.AssessmentofEuropeanstreamswith diatoms,macrophytes, macroinvertebratesandfish:acomparativemetric-basedanalysisoforganism responseduetostress.FreshwaterBiology51,1757–1785.
Kahlert,M.,Albert,R.-L.,Anttila,E.-L.,Bengtsson,R.,Bigler,C.,Eskola,T.,Gälman,V., Gottschalk,S.,Herlitz,E.,Jarlman,A.,Kasperoviciene,J.,Kokoci ´nski,M.,Luup,H., Miettinen,J.,Paunksnyte,I.,Piirsoo,K.,Quintana,I.,Raunio,J.,Sandell,B.,Simola, H.,Sundberg,I.,Vilbaste,S.,Weckström,J.,2008.Harmonizationismore impor-tantthanexperience–resultsofthefirstNordic-Balticdiatomintercalibration exercise2007(streammonitoring).JournalofAppliedPhycology21,471–482. Kahlert,M.,Kelly,M.G.,Albert,R-L.,Almeida,S.F.P.,Beˇsta,T.,Blanco,S.,Coste,M., Denys,L.,Ector,L.,Fránková,M.,Hlúbiková,D.,·Ivanov,P.,Kennedy,B., Mar-van,P.,Mertens,A.,·Miettinen,J.,·Picinska-Fałtynowicz,J.Rosebery,J.,Tornés, E.,·Vilbaste,S.,Vogel,A.Identificationisaminorsourceofuncertaintyin diatom-basedecologicalstatusassessmentsonacontinent-widescale:resultsofa Europeanring-test.Hydrobiologia,inpress.
Kelly,M.G.,Ector,L.Effectofstreamliningtaxalistsondiatom-basedindices: impli-cationsforintercalibratingecologicalstatus.Hydrobiologia,inpress. Kelly,M.G.,Cazaubon,A.,Coring,E.,Dell’Uomo,A.,Ector,L.,Goldsmith,B.,Guasch,H.,
Hürlimann,J.,Jarlman,A.,Kawecka,B.,Kwandrans,J.,Laugaste,R.,Lindstrøm, E.-A.,Leitao,M.,Marvan,P.,Padisák,J.,Pipp,E.,Prygiel,J.,Rott,E.,Sabater,S., vanDam,H.,Vizinet,J.,1998.Recommendationsfortheroutinesamplingof diatomsforwaterqualityassessmentsinEurope.JournalofAppliedPhycology 10,215–224.
Kelly,M.,Bennett,C.,Coste,M.,Delgado,C.,Delmas,F.,Denys,L.,Ector,L.,Fauville,C., Ferréol,M.,Golub,M.,Jarlman,A.,Kahlert,M.,Lucey,J.,NíChatháin,B.,Pardo,I., Pfister,P.,Picinska-Faltynowicz,J.,Rosebery,J.,Schranz,C.,Schaumburg,J.,van Dam,H.,Vilbaste,S.,2009.Acomparisonofnationalapproachestosetting eco-logicalstatusboundariesinphytobenthosassessmentfortheEuropeanWater FrameworkDirective:resultsofanintercalibrationexercise.Hydrobiologia621, 169–182.
Kelly,M.,Juggins,S.,Guthrie,R.,Pritchard,S.,Jamieson,J.,Rippey,B.,Hirst,H.,Yallop, M.,2008.AssessmentofecologicalstatusinUKriversusingdiatoms.Freshwater Biology53,403–422.
Krammer,K.,1997a.DieCymbelloidenDiatomeenEineMonographiederweltweit bekanntenTaxa.Teil1:AllgemeinesundEncyonemaPart.Bibliotheca Diatomo-logica36,1–382.
Krammer,K.,1997b.DieCymbelloidenDiatomeenEineMonographiederweltweit bekanntenTaxa.Teil2:Encyonemapart,EncyonopsisandCymbellopsis. Biblio-thecaDiatomologica37,1–469.
Krammer,K.,Lange-Bertalot,H.,1986.DieSüßwasserfloravonMitteleuropa2: Bacil-lariophyceae.Teil1:Naviculaceae.GustavFischerVerlag,Stuttgart.
Krammer,K.,Lange-Bertalot,H.,1997.DieSüßwasserfloravonMitteleuropa2: Bacil-lariophyceae.Teil2:Bacillariaceae,Epithemiaceae,Surirellaceae.2teAuflage. GustavFischerVerlag,Stuttgart.
Krammer,K.,Lange-Bertalot,H.,2000.DieSüßwasserfloravonMitteleuropa2: Bacil-lariophyceae.Teil3:Centrales,Fragilariaceae,Eunotiaceae.2teAuflage.Gustav FischerVerlag,Stuttgart.
Krammer,K.,Lange-Bertalot,H.,2004.SüßwasserfloravonMitteleuropa2: Bacil-lariophyceae.Teil4:Achnanthaceae.KritischeErgänzungenzuAchnanthess.l., Naviculas.str.,Gomphonema.SpektrumAkademischerVerlag/GustavFischer, Heidelberg.
Lange-Bertalot,H.,2001.DiatomsofEurope,vol.2.Naviculasensustricto,10Genera SeparatedfromNaviculasensulato,FrustuliaA.R.G.GantnerVerlagK.G.,Ruggell. Mann,D.G.,Thomas,S.J.,Evans,K.M.,2008.RevisionofthediatomgenusSellaphora: afirstaccountofthelargerspeciesintheBritishIsles.Fottea,Olomouc8,15–78. Marker,A.F.H.,1976.ThebenthicalgaeofsomestreamsinsouthernEnglandI Biomassoftheepilithoninsomesmallstreams.JournalofEcology64,343–358. Oksanen,J.,Kindt,R.,Legendre,P.,O’Hara,R.B.,2007.Vegan:CommunityEcology
Packageversion1.8-6.http://cran.r-project.org/.
Potapova,M.,Hamilton,P.B.,2007.Morphologicalandecologicalvariationwithin theAchnanthidiumminutissimum(Bacillariophyceae)speciescomplex.Journal ofPhycology45,561–575.
Poulíˇcková,A., ˇSpaˇcková,J.,Kelly,M.G.,Duchoslav,M.,Mann,D.G.,2008.Ecological variationwithinSellaphoraspeciescomplexes(Bacillariophyceae):specialists orgeneralists?Hydrobiologia614,373–386.
RProjectCoreDevelopmentTeam,2005.R:Alanguageandenvironmentfor sta-tisticalcomputing.RFoundationforStatisticalComputing,Vienna,Austria.
http://www.R-project.org.
Rott,E.,Pipp,E.,Pfister,P., vanDam,H., Ortler,K.,Binder,N.,Pall, K.,1999. IndikationslistenfürAufwuchsalgeninösterreichischenFließgewassern.Teil 2: Trophieindikation(sowiegeochemische Präferenzen,taxonomische und toxikologischeAnmerkungen).Wasserwirtschaftskatasterherausgegebenvom Bundesministeriumf.Land-u.Forstwirtschaft,Wien.
Stoddard,J.L.,Larsen,D.P.,Hawkins,C.P.,Johnson,R.K.,Norris,R.H.,2006.Setting expectationsfortheecologicalconditionofstreams:theconceptofreference condition.EcologyApplied16,1267–1276.
Tison,J.,Park,Y.-S.,Coste,M.,Wasson,J.G.,Ector,L.,Rimet,F.,Delmas,F.,2005. Typologyofdiatomcommunitiesandtheinfluenceofhydro-ecoregions:astudy ontheFrenchhydrosystemscale.WaterResearch39,3177–3188.
Wallin, M., Wiederholm, T., Johnson, R.K., 2005. Guidance on establishing reference conditions and ecological status class boundaries for inland surface waters. 93pp. CIS Working Group 2.3– REFCOND. http://www-nrciws.slu.se/REFCOND/7thREFCONDfinal.pdf.