RESEARCH OUTPUTS / RÉSULTATS DE RECHERCHE
Author(s) - Auteur(s) :
Publication date - Date de publication :
Permanent link - Permalien :
Rights / License - Licence de droit d’auteur :
Bibliothèque Universitaire Moretus Plantin
Institutional Repository - Research Portal
Dépôt Institutionnel - Portail de la Recherche
researchportal.unamur.be
University of Namur
Synthesis and characterisation of Fe and [Fe,Al]-MCM-22 zeolites
Testa, F.; Crea, F.; Diodati, G.D.; Pasqua, L.; Aiello, R.; Terwagne, Guy; Lentz, Patrick;
B.Nagy, Janos
Published in:
Microporous and Mesoporous Materials
Publication date: 1999
Document Version
Early version, also known as pre-print
Link to publication
Citation for pulished version (HARVARD):
Testa, F, Crea, F, Diodati, GD, Pasqua, L, Aiello, R, Terwagne, G, Lentz, P & B.Nagy, J 1999, 'Synthesis and characterisation of Fe and [Fe,Al]-MCM-22 zeolites', Microporous and Mesoporous Materials, vol. 30, no. 1, pp. 187-197.
General rights
Copyright and moral rights for the publications made accessible in the public portal are retained by the authors and/or other copyright owners and it is a condition of accessing publications that users recognise and abide by the legal requirements associated with these rights. • Users may download and print one copy of any publication from the public portal for the purpose of private study or research. • You may not further distribute the material or use it for any profit-making activity or commercial gain
• You may freely distribute the URL identifying the publication in the public portal ?
Take down policy
If you believe that this document breaches copyright please contact us providing details, and we will remove access to the work immediately and investigate your claim.
Synthesis and characterization of Fe- and
[Fe,Al ]-MCM-22 zeolites
F. Testa
a,*, F. Crea a, G.D. Diodati a, L. Pasqua a, R. Aiello a, G. Terwagne b,
P. Lentz
c, J.B. Nagy c
a Department of Chemical and Materials Engineering, University of Calabria, 87030 Rende (CS), Italy b L.A.R.N., Faculte´s Universitaires Notre-Dame de la Paix, 5000 Namur, Belgium
c Laboratoire de R.M.N., Faculte´s Universitaires Notre-Dame de la Paix, 5000 Namur, Belgium
Abstract
The synthesis of Fe-MCM-22 zeolite is reported for the first time. Its structure and characteristics are similar to those of the MCM-22 zeolite. The aluminum is in a framework tetrahedral position in the [Fe,Al ]-MCM-22 samples. The white color of the samples, the increase of the29Si and 27Al NMR linewidths with increasing Fe content and the constancy of the ( Fe+Al )/u.c. values all suggest that Fe is also incorporated in tetrahedral position of the framework. © 1999 Elsevier Science B.V. All rights reserved.
Keywords: Characterization; MCM-22; Iron; Synthesis; Zeolite
1. Introduction similar to a H-ZSM-5 zeolite [6 ]. Synthesis param-eters for the preparation of MCM-22 zeolite have been optimized. Only a low Si/Al ratio is conve-MCM-22 is synthesized under hydrothermal
nient for the synthesis of pure MCM-22 [7]. conditions using an organic template (generally
27Al and 29Si MAS NMR studies on hexamethyleneimine) and inorganic cations [1,2].
as-synthesized and dealuminated samples revealed The hexagonal structure contains two different
that the framework silicon and aluminum atoms independent porous systems. The first consists of
are located on at least five crystallographically a two-dimensional sinusoidal channel system,
non-equivalent tetrahedral ( T ) sites [6 ]. Certain accessible through 10-ring apertures. The layers
29Si NMR lines were characterized by T sites that containing this channel system are linked together
are distant from template molecules [8]. by oxygen bridges forming large supercages
char-Catalytic properties, cracking of alkanes, isom-acterized by 12-ring apertures of 7.1 A˚ inner free
erization of m-xylene, hydroisomerization of n-diameter and an inner height of 18.2 A˚ [3,4].
decane, etc. were also studied but they are only In recent years the properties of MCM-22 have
mentioned in this context. been thoroughly investigated [5–7]. Dealuminated
In this paper we report for the first time the acid forms of MCM-22 have been characterized,
synthesis and characterization of Fe-MCM-22 zeo-concluding that the acidic properties are very
lite. While this paper was being examined by the referees a short communication appeared in the
* Corresponding author. Fax:+39-984-493-073.
E-mail address: [email protected] (F. Testa) literature [9].
1387-1811/99/$ – see front matter © 1999 Elsevier Science B.V. All rights reserved. PII: S 1 3 8 7 -1 8 1 1 ( 9 9 ) 0 0 02 9 - 3
2. Experimental mixed, obtaining the final synthesis mixture: a=0
and b=1.6 in the gel.
Two different methods of synthesis are neces- Syntheses were carried out in PTFE autoclaves sary in order to obtain [Fe,Al ]-MCM-22 and pure under dynamic conditions (33 rounds per minute) [Fe]-MCM-22, respectively. For example, pure at a temperature of 150°C. The crystallinity of the [Fe,Al ]-MCM-22 was obtained by mixing 0.31 g samples was determined by comparing the intensity of Al(OH )3 (Pfaltz and Bauer), 6.4 g of NaOH of the peaks in X-ray diffraction spectra with the (Carlo Erba, 30% weight solution in water) and reference spectrum of an MCM-22 sample pre-7.2 g of fumed SiO
2 (Serva) in 64.8 g of distilled viously synthesized and taken as standard. X-ray water, so obtaining a solution named A. At the diffraction spectra (d=3.42 or 26.1° 2h) for the same time, 2.58 g of Fe(NO
3)3· 9H2O (Merck) was as-synthesized and calcined samples were collected dissolved in 32.4 g of distilled water, forming the on a Philips PW1710 diffractometer. A Cu Ka solution named B. After complete homogenization lamp was powered with 40 kV and 20 mA. Data solution B was added drop by drop to solution A. were acquired in the 2h range 5–40° with a step Finally, the synthesis mixture was obtained by size of 0.02° and a step time of 5 s.
adding 5.95 g of hexamethyleneimine (HMI, Samples 2, 3 and 4 exhibit 100% crystallinity Aldrich). The experimental protocol is similar to
after 7 days of synthesis of the reaction mixture. that used for the preparation of ferrisilicate ZSM-5
Samples 1 and 5 show complete crystallization zeolites [9–12]. For the procedure of synthesis
only after 11 days. In Table 1 the reaction mixture reported here, white [Fe,Al ]-MCM-22 (samples 2,
ratios are reported. 3, 4, see Table 1) products were obtained and
Samples were calcined in dry air flow of brown [Fe]-MCM-22 (sample 5). The general
com-10 cm3/min at a temperature of 600°C for 6 h. The position of the gels was: 6Na
2O–30SiO2–aAl2 heating rate was 1°C/min.
O3–bFe(NO3)3–15HMI–1350H2O with a=0, 0.2, Measurements of nitrogen adsorption at 77 K 0.5 and 0.8 and b=2, 1.6, 1 and 0.4, respectively.
were carried out using a Micromeritics ASAP 2010 (Note that Al+Fe=2 in the gel.)
apparatus. About 80 mg of the calcined sample A white crystalline sample of [Fe]-MCM-22
was degassed at 473 K and ~10−6 mmHg before (sample 1, Table 1) was synthesized using the
the acquisition of data. following procedure: 2.58 g of Fe(NO
3)3· 9H2O Thermal analysis (DSC and TG) was carried and 7.2 g of fumed SiO2 were added to 64.8 g of out using a Netzsch Model STA 409. The samples distilled water in order to obtain an iron silicate
were run from room temperature to 800°C at a gel. Simultaneously, 6.4 g of NaOH (30% weight
rate of 10°C/min under 15 cm3/min flow of dry air. solution in water) was added to 32.4 g of distilled
Atomic absorption analyses were carried out water. This solution was added drop by drop to
with a Shimadzu AA-660 spectrometer. About the iron silicate gel and, after complete
homogeni-zation, 5.95 g of hexamethylenimine (Aldrich) was 200 mg of the calcined samples was dissolved with
Table 1
Composition of the initial gel leading to Fe-MCM-22 and [Fe,Al ]-MCM-22 at 150°C
Sample Si/Al+Fe Fe/Al OH/tet.a Na/tet. HMI/tet. H
2O/tet. Color 1 20 8 0.38 0.38 0.48 42.9 White 2 15 4 0.375 0.375 0.47 42.2 White 3 15 1 0.375 0.375 0.47 42.2 White 4 15 0.25 0.375 0.375 0.47 42.2 White 5 15 8 0.375 0.375 0.47 42.2 Brown
5 ml of HF and 2 ml of H2SO4 and diluted in MCM-22 zeolite [Fig. 1(a)]. Tables 2 and 3 show distilled water at the desired volume. the comparison between the line positions and EPR spectra were reported at room temperature their relative intensities for the sample MCM-22 on a Bruker BER-420 spectrometer with a TE102 and the literature data [1]. Before calcination most
rectangular cavity. of the lines are broad and overlap. The calcined
The NMR spectra were recorded either on a Fe-MCM-22 sample also shows the characteristics Bruker MSL400 or on a CXP200 spectrometer. of calcined MCM-22 [5] [Fig. 1(b) and Tables 2 For 29Si (39.7 MHz), a 6 ms (h=p/2) pulse was and 3).
used with a repetition time of 6.0 s. For 27Al SEM photographs of the as-synthesized (104.3 MHz), a 1.0 ms (h=p/12) pulse was used Fe-MCM-22 samples 2, 3 and 5 are shown in with a repetition time of 0.1 s. For13C (50.3 MHz), Fig. 2. They are very similar to those reported for a 15 ms (h=p/2) pulse was used with proton high the MCM-22 zeolite samples [7,13]. The thin
plate-power decoupling. lets of ca. 1–2 mm diameter frequently form
spheri-For IR studies, thin self-supporting wafers of
cal aggregates of ca. 10–15 mm and the each sample were prepared and outgassed under
morphology does not depend on the Fe content. vacuum, in a home-made cell, at temperatures of Calcination of the samples did not affect the 550°C for 3 h. The IR spectra were taken on a
morphology of the crystals. FT-IR Bruker IFS-28 with a resolution of
In Table 4 are reported the content of iron, 2 cm−1.
aluminum and sodium determined by atomic The ion exchange experiments were carried out
absorption and the content of the organic molecule as follows: 0.5 g of the calcined product was treated
trapped in the zeolite channels determined by three times with a 1 M NH
4NO3aqueous solution thermogravimetric analysis. The values are (10 ml solution/g of solid) at 80°C. After each ion
expressed in moles per 100 g of activated samples, exchange the solid was filtered and washed with
distilled water. The NH
4form was calcined in air at 550°C for 6 h. The so-obtained H form of the products was ion exchanged with a 1 M KCl solution following the same procedure as the first exchange. The K form of the microporous solid was dried for 12 h at 120°C.
Transmission Mo¨ssbauer spectroscopy was also used to determine the site occupied by iron. The technique provides information about the local environment of the 57Fe nuclei randomly distrib-uted throughout the sample by measuring the perturbation of nuclear levels resulting from the interaction with local, internal magnetic fields and with the external electric field. The Mo¨ssbauer measurements were made using a 57Co source in a Rh matrix with an activity of 50 mCi. The specimen of interest was placed between the source and a Si(Li) detector where 14.4 keV c rays result-ing from the recoilless resonant absorption of 57Fe nuclei within the specimen were detected.
3. Results and discussion
The X-ray powder diffractogram shows clearly Fig. 1. XRD patterns of the as-made [Fe,Al ]-MCM-22 sample 3 and of the calcined Fe-MCM-22 sample 5.
Table 2 i.e. the sample from which the water and the Comparison between X-ray powder diffraction patterns of organic molecules were removed. The sum of iron as-made sample 3 and precursor MCM-22
and aluminum incorporated in the MCM-22 struc-ture is quite constant and the Fe/Al ratio is always
As-made MCM-22a
greater than in the reaction mixture (4.6, 1.3 and d(hkl ) I
rel d(hkl ) Irel 0.5 for samples 2, 3 and 4, respectively). The sodium content is very low compared to the
triva-13.63 57.6 13.53 36
lent atoms content.
12.51 70.9 12.38 100
11.30 51.9 11.13 34 The amount of HMI is equal to 0.20 mol%and
9.17 48.4 9.14 20 is not dependent on the trivalent atoms in the
6.94 34.7 6.89 6 structure. As the amount of ( Fe+Al ) is equal to
6.76 29.7 6.68 4
ca. 0.09 mol%and the Na amount is much smaller
6.08 28.3 6.02 5
than this value (it varies from 0.003 to 0.009 mol%)
4.44 53.5 4.47 22
4.08 57.4 4.05 19 ( Table 4), some 0.081 mol% of protonated HMI
3.95 58.8 3.95 21 has to neutralize the framework negative charges
3.79 48.0 3.77 13
linked to both Al and Fe (see below).
3.58 48.2 3.57 20
The DSC curves show clearly that there are two
3.44 100 3.43 55
peaks for the HMI decomposition, one with a
3.39 53.8 3.36 23
3.07 31.2 3.06 4 maximum of ca. 380°C and the other at ca. 465–
2.69 29.8 2.68 5 500°C (Fig. 3). The temperature of the low
temper-2.38 29.7 2.38 5
ature peak only very slightly depends on the Al/u.c.
2.34 27.3 – –
( Table 4), while the position of the high temper-ature peak increases with increasing framework Al
a From Ref. [5].
content. (In fact, a linear relation is obtained for the variation of T
maxas a function of Al content.)
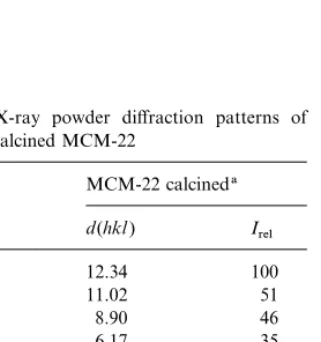
Table 3 This means, that these HMI molecules and/or ions Comparison between X-ray powder diffraction patterns of interact more strongly with the framework negative calcined sample 5 and calcined MCM-22
charges linked to the presence of Al.
The ratio of the amount of HMI decomposed
Calcined MCM-22 calcineda
at high temperature to that decomposed at low d(hkl ) Irel d(hkl ) Irel temperature varies from 1/0.65 to 1/1.2. The low temperature HMI species were shown to occupy
12.34 71.0 12.34 100
the interlayer supercages in MCM-22 zeolite, while
11.07 50.3 11.02 51
8.85 58.5 8.90 46 the high temperature HMI species are occupying
6.16 55.8 6.17 35 the intralayer zig-zag channels [5]. The HMI/u.c.
5.54 37.7 5.55 13
values vary from 9.2 to 9.6. The occupation of the
4.38 36.5 4.38 10
supercages is characterized by 3.9–5.8 HMI/u.c.,
4.10 39.9 4.11 10
while the intralayer occupancy varies from 4.3 to
4.05 47.6 4.06 20
3.91 61.3 3.82 29 5.8. ( These values were computed from a formula
3.75 45.9 3.75 15 weight of one unit cell equal to 4825 given in
3.56 40.4 3.56 14
Ref. [5].) As the (Fe+Al )/u.c. values are close to
3.42 100 3.42 61
4.3 and the Na/u.c. values are only equal to 0.14
3.30 43.6 3.30 13
(or 0.44), almost half of the HMI species have to
3.21 40.5 3.21 9
3.06 28.2 3.12 6 be in the protonated form neutralizing the
frame-2.68 28.4 2.68 6 work negative charges.
2.37 26.4 2.37 4 The two different HMI species cannot be shown
2.34 25.2 – –
by the 13C NMR spectrum, because it is not well resolved due to the presence of the paramagnetic
Fig. 2. Scanning electron micrographs of [Fe,Al ]-MCM-22 samples 2 (a) and 3 (b) and of Fe-MCM-22 sample 5 (c).
Fe(III ) in the framework ( Fig. 4). Note that only species of Al(OSi)
4 configuration ( Fig. 5 and Table 5). It is not possible to detect different Al the13C NMR spectrum of the low Fe-containing
sample 4 could be measured. species in the structure, as was the case for MCM-22 zeolite [5,6 ], because of the line broaden-The Al atoms are well introduced into the
structure in a tetrahedral form. Indeed, the chemi- ing due to the Fe(III ) species, although some asymmetry can be recognized in the spectrum cal shift of ca. 54 ppm characterizes tetrahedral
Table 4
Chemical analysis of the as-made [Fe,Al ]-MCM-22 and Fe-MCM-22 samplesa,b and ion exchange capacities of the corresponding calcined samples
Sample Fea Ala Si/ Naa K/ Fe
tetr HMIb DSC peaks (°C)–HMIb (×10−2 mol%) (×10−2 mol%) Al+Fe (×10−2 mol%) (Al+Fe) (%) (×10−2 mol%) (×10−2 mol%)
1 7.8 – 19.9 0.28 0.40 40 19 377.6–8 466.3–11 2 7.4 1.6 17.1 0.56 0.48 36 20 384.1–10 479.4–10 3 5.3 4.1 16.4 0.91 0.71 49 20 385.7–9 490.8–11 4 3.5 6.3 15.8 0.30 0.83 80 20 384.4–11 502.8–9 5 9.3 – 16.5 0.69 0 0 20 376.7–8 464.6–12 a Atomic absorption. b Thermal gravimetry.
in competition and the introduction of a total of 4.3=(Fe+Al )/u.c. is favored in our reaction conditions.
The29Si NMR spectra of the samples are cen-tered at ca.−110 ppm (Fig. 7 and Table 6). They do not show any fine structure due to the presence of paramagnetic Fe(III ) species, which lead to line broadening. The NMR linewidth increases linearly with increasing Fe content of the samples ( Fig. 5). The increase is much smaller for the calcined samples suggesting that part of the Fe(III ) ions have left the zeolite framework.
The color of the as-made samples is white except for sample 5, where some brownish color was detected, showing the presence of extraframework Fe-containing species.
EPR results were used to characterize the Fe species in the zeolite samples. One typical spectrum
Fig. 3. DSC, TG and DTG curves of Fe-MCM-22 sample 2.
of sample 3 is recorded in Fig. 8 and Table 7 shows the g values of the various Fe-containing species. (Fig. 5). The 27Al NMR linewidth increases with Despite the great importance of the EPR technique increasing Fe(III ) content in the samples ( Fig. 6). in characterizing the various paramagnetic species, The linewidths do not differ very much for the no clear-cut interpretation has been given until calcined samples ( Fig. 5 and Table 5). However, now. For example, the species characterized by a for the higher Fe content samples 2 and 3 a new g factor of 2.0 are considered octahedral [14,15], broad NMR line appears at ca. 30 ppm which while such species are described as framework could be either due to extraframework Al species tetrahedral species in Ref. [16 ]. The signal at g= very much broadened due to extraframework Fe 2.3 is considered as the g
d contribution of the species or to deformed Al species in the structure. octahedral species [14,15]. Finally, at g=4.3 can Work is in progress to identify the various Al be found the framework tetrahedral species, the species in the Fe-MCM-22 samples. intensity of which is higher at low temperatures While the Fe/u.c. increases from 1.7 to 4.5, that [14]. This species can be included in the EPR of Al/u.c. decreases from 3.0 to 0.8 and their sum signal observed at low magnetic field, where only remains constant for the different samples. This the middle of the spectrum was computed to be means that the Fe species and the Al species are between 4.23 and 4.56. The latter species are
considered as deformed tetrahedral species. The Mo¨ssbauer spectra of the Fe-MCM-22 as-made samples confirm the presence of tetrahedral Fe(III ) ions ( Table 8 and Fig. 9). The spectra of samples 1 [Fig. 9(a)] and 5 [Fig. 9(b)] were decom-posed by attempting to use two doublets, one for the tetrahedral configuration of Fe, and one for the octahedral configuration. The resulting param-eters are listed in Table 8. The isomer shift of tetrahedrally coordinated Fe(III ) is equal to 0.18 mm/s for both samples. Octahedrally coordi-nated Fe(III ) is detected in sample 5 and is characterized by higher isomer shift (0.32 mm/s)
Fig. 5.27Al NMR spectrum of Fe-MCM-22 samples 3 and 4. Sample 3 as-made (a); sample 4 as-made (b); sample 3 calcined (c); sample 4 calcined (d ).
Table 5
27Al NMR data of precursor Fe-MCM-22 samples (a) and calcined Fe-MCM-22 samples (b)
(a) (b) Sample d (ppm) DH (Hz) d (ppm) DH (Hz) 1 – – – – 2 54 2930 55.6 (~30) 2800 (7000) 3 53.4 2000 55.6 (~30) 1600 (7000) 4 55.0 1520 55.0 1550 5 – – – –
values are in good agreement with those reported
in the first genuine publication by Meagher et al. Fig. 6. Variation of the 27Al and 29Si NMR linewidths as a function of Fe content of the [Fe,Al ]-MCM-22 samples.
Fig. 7.29Si NMR spectra of [Fe,Al ]-MCM-22 samples 3 and 4. Sample 3 as-made (a); sample 4 as-made (b); sample 3 calcined (c); sample 4 calcined (d ).
Table 6
29Si NMR data of precursor Fe-MCM-22 samples (a) and calcined Fe-MCM-22 samples (b)
(a) (b) Sample d (ppm) DH (Hz) d (ppm) DH (Hz) 1 −113 400 (1000) −113 400 (1000) 2 −106 1300 −109 800 3 −108 1100 −110 750 4 −110 850 −109 700 5 −108 1500 −110 1100
interesting to note that despite the brownish color
of sample 5, the amount of tetrahedral Fe( III ) is Fig. 8. Room temperature EPR spectrum of as-made [Fe,Al ]-MCM-22 sample 3.
Table 7 FT-IR and ion exchange measurements were EPR results of as-made Fe-MCM-22 zeolite samples taken at carried out on the calcined samples. Indeed, both room temperature
techniques are very important to assess the frame-work or extraframeframe-work position of the M(III )
Sample g
elements.
1 4.263 2.307 1.985 The introduction of M(III ) elements into the
2 4.559 2.440 2.017
tetrahedral framework of zeolites generates
3 4.497 2.449 2.011
Si(OH )M Bro¨nsted acid sites. This is clearly
4 4.381 2.437 2.012
5 4.446 2.451 2.169 shown in Fig. 10, where the 3800–3400 cm−1 region is expanded. The position of the maximum of the 3620 cm−1 band shifts to higher wave-numbers when the Al content of the sample
Table 8
decreases. The values of the maxima are
Mo¨ssbauer isomer shift (IS ), quadrupole splitting (QS) and
relative intensities (Irel) of Fe-MCM-22 as-made samples taken 3622 cm−1 for sample 4, 3627 cm−1 for sample 3, at room temperaturea,b 3639 cm−1 for sample 2 and 3640 cm−1. The band
at ca. 3730 cm−1 stems from internal SiOH groups.
Sample IS (mm/s) QS (mm/s) I
rel(%) The presence of the 3640 cm−1 band in sample 1 1 Fe(III )
tetra 0.18 0.40 100 strongly suggests that Fe(III ) occupies a tetrahe-Fe(III )
octa – – – dral framework position in this Fe-MCM-22
mate-5 Fe(III )
tetra 0.18 0.38 87 rial [9]. Fe-MCM-22 sample 5 also contained
Fe(III )
octa 0.32 0.93 13 tetrahedral framework Fe(III ) (see for example a The spectra were measured at±10 mm/s velocity. the above Mo¨ssbauer spectra), the calcined sample
b The average error is ca.±0.03 mm/s. does not show clearly the presence of Fe(III ) in the framework. The higher wavenumber observed for Si(OH )Fe with respect to Si(OH )Al groups [9] also suggests that the Bro¨nsted acidity of Fe-MCM-22 is much weaker than that of Al-MCM-22.
The ion exchange capacities are very interesting.
Fig. 9. Room temperature Mo¨ssbauer spectra of the calcined Fig. 10. FT-IR spectra of the calcined Fe-MCM-22 (1 and 5) and [Fe,Al ]-MCM-22 samples.
The K/(Al+Fe) ratios are reported in Table 4. all show that a great part of the Fe is in a tetrahedral framework position in the Fe-MCM-22 The ion exchange capacity is clearly linked to
framework M(III ) elements [10,21]. The K zeolites. The Bro¨nsted acidity and the ion exchange capacity show that a non-negligible part of Fe(III ) exchange capacity increases from the Fe-MCM-22
sample (number 1) to the highest Al content remains in tetrahedral framework position even after air calcination of the samples. The synthesis [Fe,Al ]-MCM-22 (sample 4). It is also interesting
to compute the relative percentage capacity with of Fe-containing MCM-22 could open new routes for catalysis involving oxido-reduction reactions. respect to the Fe(III ) content of the as-made
samples. These values are also reported in Table 4. They were computed from the K/(Al+Fe) values supposing that the state of aluminum did not
change during calcination. This was not verified Acknowledgements
for samples 2 and 3 (see the 27Al NMR results of
Table 5) and the so-computed values are somewhat The authors are indebted to Mr. Guy Daelen underestimated. It can be seen that some 40% of for his skilful help in taking the NMR spectra. Fe(III ) remain in framework position after The present work is a part of a project coordinated calcination of Fe-MCM-22 zeolite. The presence by A. Zecchina and cofinanced by the Italian of Al seems to contribute to the stability of Fe(III ) MURST (Cofin 98, Area 03). The work was also in the structure. Indeed, the percentage tetrahedral supported by Regione Calabria (POP 1994/99). P. Fe(III ) is as high as 80% in the presence of the Lentz gratefully acknowledges financial support highest Al content (sample 4). from F.R.I.A., Belgium.
Specific surfaces and microporous volumes were measured by BET techniques and the Horva`th– Kavazoe plot. These values together with the
average pore dimensions are reported in Table 9. References The S
BETsurfaces are smaller, while the micropore
volumes are larger than those reported previously [1] M.K. Rubin, P. Chu, US Patent 4,954,325, 1990. [2] C.D. Chang, D.M. Mitke, US Patent 5,173,281, 1992.
[13,22].
[3] M.E. Leonowicz, J.A. Lawton, S.L. Lawton, M.K. Rubin, Science 264 (1994) 1910.
[4] G.J. Kennedy, S.L. Lawton, M.K. Rubin, J. Am. Chem.
4. Conclusions Soc. 116 (1994) 11000.
[5] S.L. Lawton, A.S. Fung, G.J. Kennedy, L.B. Alemany, C.D. Chang et al., J. Phys. Chem. 100 (1996) 3788 and
In conclusion, the constancy of the
references cited therein.
(Fe+Al )/u.c. values in the as-made samples, the
[6 ] M. Hunger, S. Ernst, J. Weitkamp, Zeolites 15 (1995) 188.
white color of the as-made samples, the Mo¨ssbauer
[7] A. Corma, C. Corell, J. Pe´rez-Pariente, Zeolites 15
spectra, the dependence of both the 27Al and 29Si (1995) 2.
NMR linewidths on the Fe content of the samples [8] R. Ravishankar, T. Sen, S. Sivasanker, S. Ganapathy, J. Chem. Soc., Faraday Trans. 91 (1995) 3549.
[9] P. Wu, H. Lin, T. Komatsu, T. Yashima, Chem. Commun. (1997) 663.
Table 9
[10] R. Szostak, T.L. Thomas, J. Catal. 100 (1986) 555. Sorption characteristics of Fe-MCM-22 zeolite
[11] R. Szostak, T.L. Thomas, J. Chem. Soc., Chem. Commun. (1986) 113.
Sample S
BET(m2/g) V (cm3/g) d (A˚ ) [12] R. Szostak, Molecular Sieves: Principles of Synthesis and Identification, Van Nostrand Reinhold, New York, 1989.
1 308 0.221 12.64
[13] R. Ravishankar, R. Bhattacharyer, N.E. Jacob, S.
Siva-2 302 0.217 12.65
sankar, Micropor. Mater. 4 (1995) 83.
3 308 0.236 12.65
[14] B. Wichterlova, L. Kubelkova, P. Jiru, D. Kolihova,
Col-4 317 0.229 12.90
lect. Czech. Chem. Commun. 45 (1980) 2143.
5 334 0.241 12.91
Schabel, I. Kiricsi, Proc. Capoc4, 9–11 April, Brussels, [20] P. Fejes, J.B. Nagy, K. La´za´r, J. Hala´sz, Appl. Catal., Belgium (1997) , in press. submitted.
[16 ] G. Catana, J. Pelgrims, R.A. Schoonheydt, Zeolites 15 [21] R. Szostak, V. Nair, T.L. Thomas, J. Chem. Soc., Faraday
(1995) 475. Trans. I 83 (1987) 487.
[17] A. Meagher, V. Nair, R. Szostak, Zeolites 8 (1988) 3. [22] A. Corma, C. Covell, J. Pe´rez-Pariente, J.M. Guil, R. Guil-[18] K. La´za´r, G. Borbe´ly, H. Beyer, Zeolites 11 (1991) 214. Lopez, S. Nicolopulos, J. Gonzalez Calbert, M. Vallet-[19] A. Hagen, F. Roessner, I. Weingart, B. Spliethoff, Zeolites Regi, Zeolites 16 (1996) 7.
![Fig. 2. Scanning electron micrographs of [Fe,Al ]-MCM-22 samples 2 (a) and 3 (b) and of Fe-MCM-22 sample 5 (c).](https://thumb-eu.123doks.com/thumbv2/123doknet/14510014.720765/6.1263.305.955.287.757/fig-scanning-electron-micrographs-mcm-samples-mcm-sample.webp)


![Fig. 7. 29Si NMR spectra of [Fe,Al ]-MCM-22 samples 3 and 4. Sample 3 as-made (a); sample 4 as-made (b); sample 3 calcined (c);](https://thumb-eu.123doks.com/thumbv2/123doknet/14510014.720765/9.1263.291.965.270.821/fig-nmr-spectra-samples-sample-sample-sample-calcined.webp)
![Fig. 9. Room temperature Mo¨ssbauer spectra of the calcined Fig. 10. FT-IR spectra of the calcined Fe-MCM-22 (1 and 5) and [Fe,Al ]-MCM-22 samples.](https://thumb-eu.123doks.com/thumbv2/123doknet/14510014.720765/10.1263.300.591.720.1118/room-temperature-ssbauer-spectra-calcined-spectra-calcined-samples.webp)