The impact of surgery on global climate: a carbon footprinting
study of operating theatres in three health systems
Andrea J MacNeill, Robert Lillywhite, Carl J Brown
Summary
Background Climate change is a major global public health priority. The delivery of health-care services generates considerable greenhouse gas emissions. Operating theatres are a resource-intensive subsector of health care, with high energy demands, consumable throughput, and waste volumes. The environmental impacts of these activities are generally accepted as necessary for the provision of quality care, but have not been examined in detail. In this study, we estimate the carbon footprint of operating theatres in hospitals in three health systems.
Methods Surgical suites at three academic quaternary-care hospitals were studied over a 1-year period in Canada (Vancouver General Hospital, VGH), the USA (University of Minnesota Medical Center, UMMC), and the UK (John Radcliffe Hospital, JRH). Greenhouse gas emissions were estimated using primary activity data and applicable emissions factors, and reported according to the Greenhouse Gas Protocol.
Findings Site greenhouse gas evaluations were done between Jan 1 and Dec 31, 2011. The surgical suites studied were found to have annual carbon footprints of 5 187 936 kg of CO2 equivalents (CO2e) at JRH, 4 181 864 kg of CO2eat UMMC,
and 3 218 907 kg of CO2e at VGH. On a per unit area basis, JRH had the lowest carbon intensity at 1702 kg CO2e/m2,
compared with 1951 kg CO2e/m2 at VGH and 2284 kg CO2e/m2 at UMMC. Based on case volumes at all three sites,
VGH had the lowest carbon intensity per operation at 146 kg CO2e per case compared with 173 kg CO2e per case at JRH
and 232 kg CO2e per case at UMMC.Anaesthetic gases and energy consumption were the largest sources of greenhouse
gas emissions. Preferential use of desflurane resulted in a ten-fold difference in anaesthetic gas emissions between hospitals. Theatres were found to be three to six times more energy-intense than the hospital as a whole, primarily due to heating, ventilation, and air conditioning requirements. Overall, the carbon footprint of surgery in the three countries studied is estimated to be 9·7 million tonnes of CO2e per year.
Interpretation Operating theatres are an appreciable source of greenhouse gas emissions. Emissions reduction strategies including avoidance of desflurane and occupancy-based ventilation have the potential to lessen the climate impact of surgical services without compromising patient safety.
Funding None.
Copyright © The Author(s). Published by Elsevier Ltd. This is an Open Access article under the CC BY-NC-ND 4.0 license.
Introduction
Climate change represents one of the greatest health
threats of the 21st century.1,2 To avoid a global temperature
rise beyond 2°C and the projected climate disturbances that will ensue, all industries must develop strategies to reduce greenhouse gas emissions. The health sector is one of the largest service industries and its carbon footprint is considerable. In the USA, the health-care system generates 8–10% of all greenhouse gas
emissions,3,4 and in the UK the National Health Service
(NHS) is responsible for 25% of public sector emissions.5
Surgery is a resource-intensive health-care activity, requiring expensive equipment, sterilisation procedures, advanced operative technologies, and obligatory life support systems. These activities use considerable amounts of energy and consumables, and generate copious waste volumes. Whereas the climate impacts associated with surgery are generally accepted as necessary for the provision of quality care, they have not been rigorously quantified or subject to crucial evaluation.
In this study, we examine the carbon footprint of surgical suites in three hospitals from different health-care systems (Canada, the USA, and the UK). The objectives were to identify and measure components of the operating theatre carbon footprint, to compare institutional practices, and to formulate recommendations to minimise the impact of surgery on global climate.
Methods
Background and site descriptions
Institutional consent for participation was obtained from administrators at three hospitals: Vancouver General Hospital (VGH; Vancouver, BC, Canada); University of Minnesota Medical Center (UMMC; Minneapolis, MI, USA); and John Radcliffe Hospital (JRH; Oxford, UK). All are academic, quaternary-care centres with over 800 beds and high-volume surgical suites encompassing a full range of specialist services. The three sites had comparable numbers of operating theatres (22 at VGH, 21 at UMMC, and 24 at JRH) although overall surgical suite size varied
Lancet Planet Health 2017; 1: e381–88
See Commentpage e357
Division of General Surgery, University of British Columbia, Vancouver, Canada
(A J MacNeill MD, Prof C J Brown MD);
Environmental Change Institute, School of Geography and the Environment, University of Oxford, Oxford, UK (A J MacNeill); and School of Life Sciences, University of Warwick, Warwick, UK
(R Lillywhite) Correspondence to: Dr Andrea J MacNeill, Division of General Surgery, Vancouver General Hospital, 950 West 10th Avenue, Vancouver, BC, V5Z 1M9, Canada
(1650 m² at VGH, 1450 m² at UMMC, and 3049 m²J at JRH) as a result of differences in theatre design. JRH was constructed with separate anaesthetic induction rooms for improved efficiency which, in combination with other structural and process differences, resulted in higher throughput compared with the other sites despite a similar number of theatres (30 000 cases annually vs 18 000 at UMMC and 22 000 at VGH). The surgical suites at VGH and UMMC were both constructed in 1996. Adult surgical services at JRH are divided between two blocks of operating theatres in different hospital wings, one built in 1979 and the other in 2006.
A comprehensive greenhouse gas inventory was
performed according to the Greenhouse Gas Protocol,6
with slight modifications as described below. The surgical suite was defined as the sum of a hospital’s operating theatres, surrounding corridors, and sterile core, inclusive of anaesthetic and equipment rooms, but exclusive of pre-operative and post-operative holding and recovery areas, administrative offices, and medical device reprocessing departments.
The Greenhouse Gas Protocol defines three scopes of emissions for accounting and reporting. Scope 1 includes direct emissions from within the organisational boundary, scope 2 represents indirect emissions due to electricity consumption, and scope 3 includes all other indirect
emissions occurring as a consequence of the organisation’s activities. Within the boundary of the surgical suite, greenhouse gas emissions are reported as follows: scope 1, anaesthetic gases; scope 2, electricity use, energy for space heating; and scope 3, surgical supply chain, waste disposal.
The Greenhouse Gas Protocol states that non-Kyoto greenhouse gases should be reported separately, but as these represent the only direct emissions from the surgical suite, they have been included in scope 1. Thermal energy for space heating could be reported as scope 1, but has been included here in scope 2 as this combustion occurs outside of the surgical suite and is conceptually best considered with other energy-related emissions. Staff travel was excluded as it was considered outside of the study boundary.
Activity data were collected for each source of operating theatre emissions and multiplied by a relevant emissions factor to determine the carbon footprint. Site greenhouse gas evaluations were done between Jan 1 and Dec 31, 2011.
Scope 1
Annual volumes of volatile anaesthetic agents (desflurane, isoflurane, and sevoflurane) used at participating hospitals were determined from pharmacy purchasing records. As volatile anaesthetics undergo minimal in-vivo metabolism, the administered volume approximates the
Research in context
Evidence before this study
The PubMed database was searched for articles published from inception until May 13, 2017, addressing the environmental impacts of surgery using the search terms “carbon footprint”, “greenhouse gas emissions”, “climate change”, “global warming”, and “life cycle assessment” in combination with “surgery”, “anaesthesia”, “operating theatre”, “operating room”, “hospital”, and “healthcare”. All article types and languages were included. We found six studies investigating the environmental impacts of individual surgical procedures or approaches (eg, laparoscopy, robot), as well as specialty-specific data in nephrology, ophthalmology, psychiatry, critical care, and primary care. The global warming potential of volatile anaesthetics is recognised, and attempts have been made to estimate their overall contribution to greenhouse gas emissions. Small surgical waste audits have reported the success of recycling programmes in diverting waste from landfill or avoiding incineration, and a single published report documents the activities of an operating theatre green committee at a US hospital. Life-cycle assessments of various medical devices and processes have been done. National-level health-care carbon footprint estimates are published for the USA and the UK.
The existing evidence on the impact of surgical activities on the environment encompasses individual products and procedures or comparisons of alternative surgical approaches. Although
three studies apply aspects of the Greenhouse Gas Protocol methodology, none has undertaken a full carbon accounting study and all rely to varying degrees on low-quality activity data.
Added value of this study
This study is the first to investigate the carbon footprint of the entire surgical suite, estimating the carbon burden of the provision of surgical services as a multidisciplinary clinical specialty. The scope of this study far exceeds previous work and is designed to provide data at a level that would allow identification and implementation of emissions reduction strategies. The greenhouse gas inventory undertaken is the first comprehensive accounting of emissions in any medical specialty and is derived from granular primary activity data rather than approximations. This study is also the first to compare environmental performance in hospitals from three different countries.
Implications of all the available evidence
Surgical activities generate a substantial carbon footprint. Widespread implementation of the emissions reduction strategies identified here has the potential to dramatically reduce the carbon burden associated with the provision of surgical services. Climate change is one of the greatest public health threats today. Mitigating the climate impacts of health-care activities is a vital component of health sector leadership in responding to global climate change.
waste anaesthetic gas volume with the exception of
sevoflurane for which a 5% correction was applied.7
Emissions in CO2 equivalents (kg CO2e) were calculated
using Global Warming Potential (GWP100) values from the
work of Sulbaek Andersen and colleagues,8 which are a
measure of the contribution of a greenhouse gas to climate change over a 100-year time horizon.
Scope 2
Heating, ventilation, and air conditioning (HVAC) system thermal energy requirements were calculated according to the specific system employed at each site (single duct reheat system at UMMC and JRH, dual duct system at VGH). System set-points and operating parameters were obtained from building automation systems and air flow rates used to determine total volume of air circulated and conditioned within a 24-h period. Using degree days from meteorological databases, the enthalpy required to condition air to stipulated set-points was calculated over a 1-year period. Greenhouse gas emissions due to heating were calculated by multiplying the required energy by the UK Department of Environment, Food, and Rural Affairs (DEFRA) emissions factors for coal or natural gas, in keeping with the source of steam at each site. At VGH this is from an on-site natural gas boiler, at UMMC it is from a half-coal, half-natural gas-fired power plant on the University of Minnesota campus, and at JRH heating is via a combination of natural gas and electricity. Cooling was accomplished via centrifugal chillers, with coefficients of performance (COP) used to calculate required energy input. Electrical energy requirements of air handling units were measured directly via building automation systems.
The separation of operating theatres at JRH between different hospital wings resulted in variations in HVAC systems between theatres. For the purposes of this study, HVAC parameters from one wing were applied to calculate energy demands at both.
Lighting audits were done by compiling inventories of total lighting loads and power ratings and applying appropriate occupancy and usage patterns. Additional electricity consumption was determined by theatre submetering.
Greenhouse gas emissions due to electricity use were calculated using grid intensities (emissions produced per kWh of electricity generated) provided by local electrical
utilities: 0·023 kg CO2/kWh at VGH, 0·548 kg CO2/kWh
at UMMC, and 0·540 kg CO2/kWh at JRH. The
considerable variability in carbon intensity of electricity supply reflects the preponderance of hydroelectricity in British Columbia as opposed to coal-dominated electrical grids in Minneapolis and Oxford.
Scope 3
Waste audits were done in which all waste generated within the study boundary was weighed and catalogued according to waste segregation practices at each institution during a representative sample of three
week-days and one weekend at each site. Measured waste volumes were extrapolated to annual values based on surgical case volumes during the audits relative to the rest of the year. Processing or disposal of each type of waste was investigated via personal visits to waste management facilities where energy and material inputs and outputs as well as transport distances were recorded.
Surgical waste was segregated into the following streams: municipal solid waste, domestic waste, hazardous waste, fluid waste, sharps, cytotoxic waste, black box waste (material that is both acutely toxic and infectious), recycling, and reusable textiles.
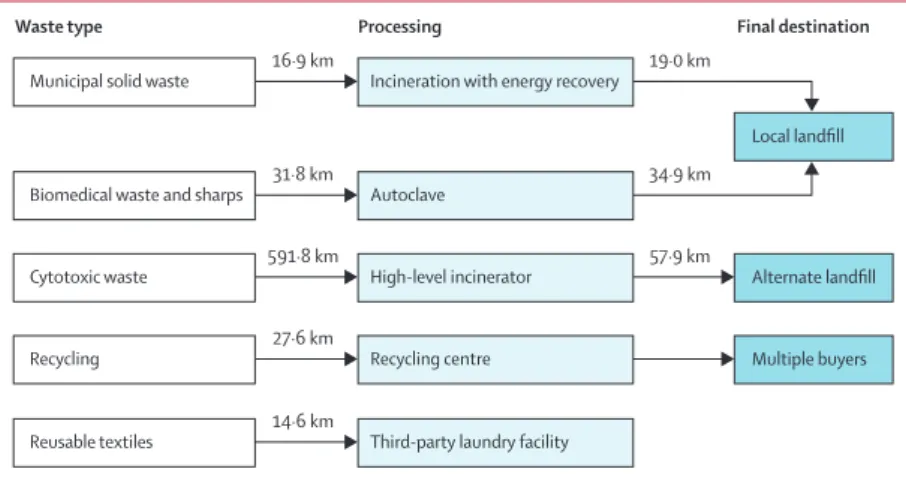
Municipal solid waste from all sites is incinerated at waste-to-energy facilities, and hazardous waste is autoclaved before landfill. At JRH a separate stream of municipal solid waste from corridors outside theatres is termed domestic waste and is landfilled without pretreatment. Sharps are autoclaved and landfilled at VGH and UMMC, and incinerated at JRH. Cytotoxic and black box waste are incinerated at specialised facilities for disposal of hazardous waste. Recycling is collected by local vendors and sold to a variety of users. Laundry at all three sites is processed by third parties. Third party single-use device reprocessing and on-site reprocessing of surgical instruments were excluded.
Carbon footprints were calculated by applying DEFRA greenhouse gas life-cycle conversion factors for waste disposal, which take into account greenhouse gas emissions generated upstream in the supply chain as well
as in the downstream disposal.9 Production emissions
factors were used to account for emissions involved in the manufacture of surgical consumables, based on the material composition of the waste stream. As the majority of theatre waste is composed of high-density and low-density polyethylene (plastic tubing, basins, jugs), polypropylene and PET (disposable textiles, blue wrap), and latex, the production emissions factors for average
plastics were applied (3179 kg CO2e/tonne), with a
10% modifier to reflect the small non-plastic portion.
Production emissions factors for plastic (3254 kg CO2e/
tonne), steel (2708 kg CO2e/tonne), and glass (895 kg
CO2e/tonne) were used for sharps, cytotoxic, and black box
waste, as these contain predominantly syringes, needles, and glass vials. Production emissions were omitted for reusable textiles as these were laundered and reused.
Combustion emissions factors for incineration with energy recovery were applied to the disposal of municipal solid waste from all three sites, again using the emissions factor for average plastics to reflect the composition of the
surgical waste stream (1179 kg CO2e/tonne). The highest
emissions factor for incineration was used for incineration
of hazardous wastes (1833 kg CO2e/tonne). For steam
disinfection of hazardous waste, process data from the Stericycle facility in Minneapolis (Stericycle Inc, Lake Forrest, IL, USA) were used to calculate emissions from autoclaving, and were extrapolated to the analogous facilities at the other two sites. Emissions due to laundering
of textiles were calculated from the K-Bro Linen facility in Burnaby (K-Bro Linen Inc, Edmonton, AB, Canada), and applied to UMMC and JRH with incorporation of local electrical grid intensities, as primary data from laundering facilities at these two sites were unavailable. Emissions factors for open-loop recycling (the process of recycling materials into other products) were used.
Role of the funding source
This work was not supported by any funding sources. The corresponding author had full access to all the data
in the study and had final responsibility for the decision to submit for publication.
Results
Volatile anaesthetic agents resulted in similar emissions profiles at the two North American hospitals (2 034 277 kg
CO2e/year at VGH and 2 129 841 kg CO2e/year at
UMMC), whereas the carbon footprint of anaesthetic
gases at the UK site was only 211 212 kg CO2e/year
(table 1) despite a considerably higher case volume at the latter (30 000 cases per year vs 18 000–22 000 cases
per year). This disparity in carbon intensity (7·0 kg CO2e
per case at JRH vs 92·5 kg CO2e per case at VGH and
118·3 kg CO2e per case at UMMC) can be accounted for
by differential use of desflurane. Nitrous oxide use at all sites was found to be negligible.
Total annual energy consumption was 3382 MWh at VGH, 3856 MWh at UMMC, and 10 641 MWh at JRH (table 2). HVAC demands comprised 90–99% of operating theatre energy consumption at all sites.
Corresponding carbon footprints were 534 194 kg CO2e
for VGH, 1 515 763 kg CO2e for UMMC, and 4 344 150 kg
CO2e for JRH per year. VGH had the best energy
performance (2·0 MWh/m²), probably due to HVAC system set-backs for energy conservation after-hours. UMMC, despite being of similar building stock to VGH, had no titration of ventilation based on occupancy, and a higher energy intensity (2·7 MWh/m²). JRH consumed disproportionately more energy per unit area (3·5 kWh/m²), probably because of the older building and infrastructure at this site. The low carbon-intensity of British Columbia’s electricity supply is apparent in the considerably lower emissions at VGH compared with the other sites in all energy categories apart from heating, which is provided by natural gas.
Hospital-level energy performance data were available for two sites. Energy consumption at VGH averaged 2·38 GJ/m² whereas the operating theatres consumed 7·15 GJ/m². The building energy performance of JRH was 2·14 GJ/m² but that of the surgical suite was 12·61 GJ/m². The energy intensity of operating theatres in this study is thus shown to be three to six times that of the hospital building average.
A representative waste management map (figure 1) shows the trajectory of the surgical waste streams from VGH. Mean daily waste was 1165 kg for VGH, 681 kg for UMMC, and 792 kg for JRH. On a per case basis, JRH generated the least amount of waste at 7·62 kg per case, as compared with 11·92 kg per case at UMMC and 16·39 kg per case at VGH.
At VGH and UMMC, the predominant waste fractions were municipal solid waste and reusable textiles, whereas JRH generated mainly municipal solid waste and hazardous waste. Differences in the relative proportions of municipal solid waste and hazardous waste largely reflect waste segregation practices at each institution. At JRH all surgical gowns and drapes are
Figure 1: The multiple trajectories of surgical waste from Vancouver General Hospital
Municipal solid waste
Local landfill Incineration with energy recovery
Waste type Processing Final destination
16·9 km 19·0 km
Biomedical waste and sharps 31·8 km Autoclave 34·9 km
Cytotoxic waste 591·8 km High-level incinerator 57·9 km Alternate landfill
Recycling 27·6 km Recycling centre Multiple buyers
Reusable textiles 14·6 km Third-party laundry facility
Volume purchased (L/year) CO2e (kg/year)
VGH UMMC JRH VGH UMMC JRH
Desflurane 535·7 532·8 0 1 983 073 1 972 412 0 Isoflurane 34·2 176·4 222 26 297 135 636 170 314 Sevoflurane 132 115·5 217 24 907 21 793 40 898
Total ·· ·· ·· 2 034 277 2 129 841 211 212
CO2e calculated using 100-year Global Warming Potential (GWP100) values of 2540 for desflurane, 510 for isoflurane,
and 130 for sevoflurane.8 VGH=Vancouver General Hospital. CO
2e=CO2 equivalents. UMMC=University of Minnesota
Medical Center. JRH=John Radcliffe Hospital.
Table 1: Annual greenhouse gas emissions from volatile anaesthetics
Energy (MWh/year) CO2e (kg/year)
VGH UMMC JRH VGH UMMC JRH Heating 2518 2204 6971 514 340 610 702 2 283 426 Cooling 66 357 1312 1523 195 629 787 149 Ventilation 449 1062 2045 10 317 581 938 1 104 386 Lighting* 236 177 313 5423 96 959 169 189 Plug-loads 113 56 ·· 2591 30 535 ·· Total 3382 3856 10 641 534 194 1 515 763 4 344 150
CO2e=CO2 equivalents. VGH=Vancouver General Hospital. UMMC=University of Minnesota Medical Center.
JRH=John Radcliffe Hospital. *At VGH and UMMC, theatre submetering included plug-loads and surgical spotlights, but not overhead lighting; overhead lightingis reported separately based on lighting audits; at JRH, all lighting was captured in theatre submetering, hence only one value is reported for both lighting and plug-loads.
considered hazardous waste, even if not heavily soiled with bodily fluids. By contrast, VGH has more stringent definitions of hazardous waste such that a much smaller proportion of theatre waste is disposed of in this stream. At VGH reusable surgical gowns are used which, in combination with liberal use of flannel blankets for patient comfort, resulted in a much larger fraction of reusable textiles compared with the other two sites. UMMC employs the Stryker Neptune fluid management system, which discharges fluid waste directly to the hospital sanitation system, thereby eliminating fluid waste from scope 3.
Using DEFRA life-cycle emissions factors to take into account emissions embedded in the production of surgical consumables as well as in their disposal, VGH was found
to produce 650 436 kg CO2e/year, compared with
536 260 kg CO2e/year at UMMC and 632 574 kg CO2e/year
at JRH (table 3).
Cumulative carbon footprints are shown in table 4 with the relative contribution of each scope shown in figure 2. Overall, JRH had the largest carbon footprint at
5 187 936 kg CO2e/year, followed by UMMC at 4 181 864 kg
CO2e/year and VGH at 3 218 907 kg CO2e/year. On a per
unit area basis, JRH had the lowest carbon intensity at
1702 kg CO2e/m2, compared with 1951 kg CO2e/m2 at
VGH and 2284 kg CO2e/m2 at UMMC. Taking into
account the case volumes at all three sites, VGH had the
lowest carbon intensity per operation at 146 kg CO2e per
case compared with 173 kg CO2e per case at JRH and
232 kg CO2e per case at UMMC. At both North American
sites, anaesthetic gases were the primary source of operating theatre emissions, whereas most of the carbon footprint at JRH was attributable to energy consumption.
Discussion
The estimation of carbon footprints in health care is still in its infancy. Three studies have approximated emissions from national health-care systems using economic
data,3–5 thereby providing important contextual
information to compare the health sector with other global industries and to situate it within a national carbon emissions profile. Whereas national level estimates are valuable, emissions reduction strategies must be developed and implemented at a more grassroots level where their individual components can be identified and managed. Connor and colleagues were the first to examine specialty-level emissions, quantifying the carbon footprint of a renal unit in the UK as well as
haemodialysis processes,10,11 and recently expanded into
the surgical realm with the carbon footprint of a cataract
procedure.12 This study is the first to examine the carbon
burden associated with the surgical suite, a multidisciplinary space that we propose is an ideal functional unit for effecting change. Operating theatres represent a defined physical area under the control of facilities managers, as well as an economically discreet subsector of the hospital responsible for its own supply
chain. The multiple professional groups that populate the space each have the ability to affect the overall carbon footprint by critically examining practice patterns and instituting specialty-wide behaviour change. As one of the most resource-intensive areas of the hospital, it is anticipated that emissions reduction strategies targeting the operating theatre will be among the highest-yield within the health-care industry.
Inclusion of three sites from different geographical regions and health-care systems allows a comparison of emissions profiles to formulate recommendations for improved environmental performance. Emissions due to anaesthetic gases comprise most of the overall carbon footprint at both North American hospitals accounting for
2000 tonnesCO2e at each site, which is ten-fold higher
than the anaesthetic gas emissions from the UK site. This finding is attributable to differential use of desflurane, which is the preferred volatile agent at VGH and UMMC but is not used at JRH due to its high cost. Desflurane has the advantage of faster induction and emergence than
other volatile agents, but it has a GWP100 of 2540, which is
five to 18 times more than isoflurane and sevoflurane. It has been previously shown to be the primary contributor
Waste (kg/year*) CO2e (kg/year)
VGH UMMC JRH VGH UMMC JRH
Municipal solid waste 111 255 105 975 83 060 438 167 423 060 327 122 Hazardous waste 21 933 9374 81 121 63 028 26 938 233 122 Reusable textiles 178 176 87 120 33 597 53 336 52 248 12 419 Fluid waste 15 526 ·· 15 525 194 ·· 194 Sharps 1793 1076 9698 4913 2980 44 229 Cytotoxic waste 902 598 ·· 4114 2728 ·· Recycling† 30 991 10 154 4620 85 264 26 913 11 445 Domestic waste ·· ·· 993 ·· ·· 2327 Transport‡ 1855 1818 1404 1421 1393 1727 Total 360 576 214 297 228 615 650 436 536 260 632 574
CO2e=CO2 equivalents. VGH=Vancouver General Hospital. UMMC=University of Minnesota Medical Center. JRH=John
Radcliffe Hospital. *Except transport where the units are km/year. †Recycling includes cardboard, plastic, and surgical blue wrap (polypropylene) at UMMC, versus cardboard and plastic only at VGH and UMMC; production emissions factors used were 1038 kg CO2e/tonne for cardboard, 3179 kg CO2e/tonne for average plastics, and 3254 kg CO2e/
tonne for polypropylene; net emissions with recycling were –240 kg CO2e/tonne for cardboard, –282 kg CO2e/tonne for
average plastics, and 12 kg CO2e/tonne for polypropylene. ‡Assuming 7·15 miles per gallon average fleet fuel efficiency
(Natural Resources Canada).
Table 3: Annual waste volumes and greenhouse gas emissions due to surgical consumables
VGH UMMC JRH
Scope 1 2 034 277 2 129 841 211 212 Scope 2 534 194 1 515 763 4 344 150 Scope 3 650 436 536 260 632 574 Total 3 218 907 4 181 864 5 187 936
CO2e=CO2 equivalents. VGH=Vancouver General Hospital. UMMC=University of
Minnesota Medical Center. JRH=John Radcliffe Hospital.
Table 4: Total annual operating theatre greenhouse gas emissions
to global anaesthetic gas emissions.13 Preferential use of
alternative anaesthetic agents or strategies (eg, regional techniques, total intravenous anaesthesia) has the potential
to dramatically reduce theatre greenhouse gas emissions.7
A lack of awareness regarding the environmental impacts of anaesthetic choices is believed to be the greatest barrier
to widespread implementation of low-carbon practices.14
While HVAC systems have been shown to be responsible for 52% of the energy needs of inpatient health-care
facilities,15 we found that HVAC energy demands
comprised 90–99%of overall theatre energy use, reflecting
the more aggressive space conditioning requirements for theatres relative to other inpatient areas. This finding partially explains the relatively higher energy consumption of JRH, as theatre energy use is directly correlated to the size of the surgical suite. Energy conservation efforts should therefore focus on HVAC system management. Occupancy-based ventilation strategies reduce unnecessary air flow to unused space and have the potential for considerable energy savings. These measures were already in place to a limited extent at VGH, reflected in its improved energy performance compared with the other two sites. By extending the HVAC set-backs at VGH to the maximum number of theatres, reducing air flow rates to 19 of 22 theatres overnight and on weekends, leaving three theatres online for emergencies, we demonstrated a 50% reduction in HVAC energy consumption compared with baseline.
The substantial variability in greenhouse gas emissions due to energy use between sites demonstrates the importance of the carbon intensity of local electricity supply. There was a 24-fold difference in grid intensity between British Columbia, which is supplied by hydroelectricity, and Oxford and Minnesota which have coal-dominated electrical grids. For deregulated energy markets with multiple possible suppliers, the selection of
a low-carbon electricity source has the potential to substantially impact emissions.
Emissions resulting from the manufacture of surgical consumables are invariably underestimated in this study as they are approximated using production emissions factors which reflect only those emissions embedded in the raw materials (eg, polypropylene) and fail to capture emissions involved in the manufacture, sterilisation, and transport of end products. A more accurate accounting of surgical supply chain emissions via economic analyses or individual product footprinting would be expected to reveal a substantially larger scope 3 footprint. To determine the relative environmental impact of one product over another, full life-cycle assessment is
required, such as that done by Eckelman and colleagues16
demonstrating that the carbon footprint of a single-use
laryngeal mask airway is 11·3 kg CO2e versus 7·4 kg CO2e
for the reusable alternative. Given the increasing availability of single-use surgical consumables, such robust investigations are invaluable in informing purchasing decisions. In its original carbon footprinting exercise in 2009, NHS England found that scope 3 accounted for 65% of total greenhouse gas emissions, and that pharmaceuticals and medical devices were responsible for nearly half of these. The exclusion of pharmaceuticals from the current study thus represents a considerable limitation and further underscores the conservative nature of the scope 3 results. Additionally, steam sterilisation of reusable surgical instruments would need to be included in a comprehensive scope 3
inventory. McGain and colleagues17 found that this
required 1·9 kWh/kg of mass sterilised, and that inefficiencies in the process were common.
The Lancet Commission on Climate and Health2 has
called for the health-care community to take a leadership role in advocating for emissions reductions, and to
A B C Supply chain and waste (13%) Supply chain and waste (20%) Supply chain and waste (12%) Energy (36%) Energy (17%) Energy (84%) Anaesthetic gas (51%) Anaesthetic gas (63%) Anaesthetic gas (4%)
Figure 2: Relative contribution of scopes 1, 2, and 3 to the carbon footprint of operating theatres at (A) Vancouver General Hospital, (B) University of
Minnesota Medical Center, and (C) John Radcliffe Hospital
critically examine its own activities with respect to their
effects on human and environmental health.This study
is the first to estimate the considerable climate impacts of surgical services. Averaging the greenhouse gas emissions measured here on a per theatre basis gives a
carbon intensity of 188 tonnes CO2e per theatre per year.
If the hospitals studied were representative of their respective regions, extrapolation of these results to the number of operating theatres within these three countries would yield a total carbon footprint of
9·7 million tonnes CO2e/year, or the equivalent of
2 million passenger vehicles.
Addressing the environmental impacts of the operating theatre will require coordinated multidisciplinary action from the diverse members of the surgical team. Similar to the process by which enhanced recovery after surgery (ERAS) protocols have expedited and improved recovery
after many operations18–21 by assimilating and
standardising best practices from anaesthesia, surgery, nursing, and other health professionals involved in perioperative care, so too optimisation of operating theatre environmental performance relies upon engagement and innovation from the many players who converge to deliver surgical services. Anaesthetists are positioned to take ownership of a large proportion of the theatre footprint by reducing emissions from volatile agents, whereas HVAC system optimisation falls within the purview of facilities managers and engineers. Surgeons, nurses, perfusionists, and others can influence environmentally preferable purchasing and minimise waste. Much like adoption of ERAS pathways, reducing the environmental impact of surgical services requires a collective drive for cultural change, this time toward a culture of sustainability and social responsibility.
Best practices in operating theatre environmental performance remain to be determined, but measuring and reporting emissions and comparing profiles as we have done here is a necessary prerequisite. The power of data to drive quality improvement has been demonstrated by the American College of Surgeons National Surgical Quality Improvement Program (ACS-NSQIP), which allows hospitals to see how they are performing relative to comparable institutions with respect to a multitude of
metrics related to quality of surgical care.22,23 ACS-NSQIP
provides a platform for collaboration and sharing of best practices while leaving responsibility for action with the participating institutions. In the experience of this study, the observed variability in environmental performance led to a cross-pollination of advantageous ideas between sites. Similar to the cost savings demonstrated with avoidance of surgical complications by ACS-NSQIP, the emissions reduction strategies described here entail convenient economic co-benefits that only strengthen the case for attention to environmental performance. While a cost-effectiveness analysis is beyond the scope of this study, desflurane is the most expensive volatile anaesthetic, accounting for 83–86% of the cost of volatile
agents at VGH and UMMC, with JRH demonstrating that higher surgical case volumes can be done at a fraction of the cost of volatile anaesthetics. Energy conservation and waste reduction have similar financial incentives.
This study is the most comprehensive greenhouse gas inventory of operating theatres to date. However, it has a number of considerable limitations, including reliance on production emissions factors to approximate upstream emissions in the surgical supply chain and omission of pharmaceuticals and steam sterilisation data. Waste volumes were gleaned from a representative sample using waste audits rather than having access to actual annual waste data for each stream. Estimation of national level emissions from operating theatres on the basis of a very limited sample entails a high degree of uncertainty, but in spite of this we feel that even a crude estimate is beneficial to help situate surgical services within the broader context of health-care carbon footprints.
We have estimated the carbon footprint of surgical suites and identified initial strategies for improved environmental performance. Although further work is needed to refine the benefits that might be realised, it is clear that both carbon and cost savings are possible and that multidisciplinary action should be undertaken to minimise the adverse effects of surgery on the environment.
Contributors
AJM was responsible for study design, data collection and analysis, and manuscript preparation. RL contributed to study design, data interpretation, and manuscript preparation. CJB contributed to data interpretation and manuscript preparation.
Declaration of interests
We declare no competing interests. Acknowledgments
We acknowledge Duncan Campbell, former Chief Financial Officer of Vancouver Coastal Health, Ashok Handa, former Clinical Director of Operating Theatres at the John Radcliffe Hospital, and Crystal Saric and Lynn Thelen of Fairview Health Systems for facilitating access to the participating institutions. Blair Steeves and Jeremy Deane assisted with study design and data collection at Vancouver General Hospital, and Dominic Hofstetter assisted with data analysis.
References
1 Costello A, Abbas M, Allen A, et al. Managing the health effects of climate change. Lancet 2009; 373: 1693–733.
2 Watts N, Adger WN, Agnolucci P, et al. Health and climate change: policy responses to protect public health. Lancet 2015; 386: 1861–914. 3 Chung JW, Meltzer DO. Estimate of the carbon footprint of the US
health care sector. JAMA 2009; 302: 1970–72.
4 Eckelman MJ, Sherman J. Environmental impacts of the U.S. health care system and effects on public health. PLoS One 2016; 11: e0157014.
5 NHS Sustainable Development Unit (2008, updated 2009, 2016). NHS England carbon emissions carbon footprinting report. http://www.sdu.nhs.uk/documents/publications/1263313924_ jgyW_nhs_england_carbon_emissions_carbon_footprinting_r.pdf (accessed Dec 18, 2010).
6 World Resources Institute/World Business Council for Sustainable Development’s greenhouse gas protocol: a corporate accounting and reporting standard, revised edition. http://pdf.wri.org/ghg_ protocol_2004.pdf (accessed July 24, 2011).
7 Sherman J, Le C, Lamers V, Eckelman M. Life cycle greenhouse gas emissions of anesthetic drugs. Anesth Analg 2012; 114: 1086–90. 8 Sulbaek Andersen MP, Nielsen OJ, Wallington TJ, Karpichev B,
Sander SP. Assessing the impact on global climate from general anesthetic gases. Anesth Analg 2012; 114: 1081–85.
9 DEFRA. Guidelines to DEFRA/DECC’s GHG conversion factors for company reporting. 2011. https://www.gov.uk/government/ uploads/system/uploads/attachment_data/file/69314/pb13625-emission-factor-methodology-paper-110905.pdf
(accessed Nov 10, 2015).
10 Connor A, Lillywhite R, Cooke MW. The carbon footprints of home and in-center maintenance hemodialysis in the United Kingdom.
Hemodial Int 2011; 15: 39–51.
11 Connor A, Lillywhite R, Cooke MW. The carbon footprint of a renal service in the United Kingdom. Q J Med 2010; 103: 965–75. 12 Morris DS, Wright T, Somner JEA, Connor A. The carbon footprint
of cataract surgery. Eye (Lond) 2013; 27: 495–501. 13 Vollmer MK, Rhee TS, Rigby M, et al. Modern inhalation
anesthetics: potent greenhouse gases in the global atmosphere.
Geophys Res Lett 2015; 42: 1606–11.
14 Sherman J, McGain F. Environmental sustainability in anaesthesia.
Adv Anesth 2016; 34: 47–61.
15 US Energy Information Agency. Commercial Building Energy Consumption Survey. 2003. http://www.eia.gov/emeu/cbecs/ cbecs2003/detailed_tables_2003/detailed_tables_2003.html (accessed Feb 1, 2016).
16 Eckelman M, Mosher M, Gonzalez A, Sherman J. Comparative life cycle assessment of disposable and reusable laryngeal mask airways. Anesth Analg 2012; 114: 1067–72.
17 McGain F, Moore G, Black J. Steam sterilisation’s energy and water footprint. Aust Health Rev 2017; 41: 26–32.
18 Wisely JC, Barclay KL. Effects of an enhanced recovery after surgery programme on emergency surgical patients. ANZ J Surg 2016; 86: 883–88.
19 Thorell A, MacCormick AD, Awad S, et al. Guidelines for perioperative care in bariatric surgery: enhanced recovery after surgery (ERAS) society recommendations. World J Surg 2016; 40: 2065–83.
20 ERAS Compliance Group. The impact of enhanced recovery protocol compliance on elective colorectal cancer resection: results from an international registry. Ann Surg 2015; 261: 1153–59. 21 Miralpeix E, Nick AM, Meyer LA, et al. A call for new standard of
care in perioperative gynecologic oncology practice: impact of enhanced recovery after surgery (ERAS) programs. Gynecol Oncol 2016; 141: 371–78.
22 Cohen ME, Liu Y, Ko CY, Hall BL. Improved surgical outcomes for ACS-NSQIP hospitals over time: evaluation of hospital cohorts with up to 8 years of participation. Ann Surg 2015; 263: 267–73. 23 Cohen ME, Hall BL, Liu Y, Ko CY. Evaluating the benefits of
ACS-NSQIP. Ann Surg 2015; published online July 1. DOI: 10.1097/ SLA.0000000000001344.