Original Article
PRE-dialysis survey on anaemia management
Fernando Valderra´bano
1,y, Walter H. Ho¨rl
2, Iain C. Macdougall
3, Je´roˆme Rossert
4,
Boleslaw Rutkowski
5and Jean-Pierre Wauters
61
Servicio Nefrologı´a, Hospital Gregorio Maran˜on, Madrid, Spain,2Klinische Abteilung fu¨r Nephrologie und Dialyse, Universita¨tsklinik fu¨r Innere Medizin III, Wien, Austria,3Department of Renal Medicine, King’s College Hospital, London, UK,4Service de Ne´phrologie, Hoˆpital Tenon, Paris, France, 5Klinika Chorob Nerek AM, Gdansk, Poland and6Division of Nephrology, University Hospital CHUV, Lausanne, Switzerland
Abstract
Background. The PRE-dialysis survey on anaemia management (PRESAM) was designed to assess the care given to pre-dialysis patients in the 12 months before haemodialysis or peritoneal dialysis, with emphasis on anaemia management.
Methods. For this epidemiological study, a retro-spective chart review was conducted for patients who started haemodialysis or peritoneal dialysis between 1 August, 1999 and 6 April, 2000. All adult patients who entered one of the 779 participating centres in 21 European countries, Israel or South Africa were included, except for patients who underwent dialysis only during an acute episode. In addition to demo-graphic characteristics, the study examined the pre-valence of anaemia, anaemia management including the use of iron supplementation and epoetin, source of referral to the dialysis centre, comorbidities and major clinical events.
Results. A total of 4333 new dialysis patients were included in the survey. At the first visit to the dialysis centre, 68% of the patients had a haemoglobin (Hb) concentration O11.0 gudl; Hb concentration was posi-tively correlated with creatinine clearance rate (rs 0.43, P-0.01). Patients who received epoetin had a mean Hb concentration of 8.8 gudl at the start of epoetin treatment, and 96% of these patients had an Hb concentration O11.0 gudl. Only 26.5% of the patients received epoetin before dialysis. The length of time under the care of a nephrologist was associated with meeting the European Best Practice Guidelines (EBPG) target Hb concentration, as well as receiving epoetin.
Conclusions. Few pre-dialysis patients met the EBPG target for Hb concentration, despite regular nephrology care.
Keywords: anaemia management; best practice guide-lines; epidemiology; epoetin; pre-dialysis
Introduction
The treatment of patients with chronic renal failure with recombinant human erythropoietin (rHuEPOu epoetin) before starting or during dialysis can improve the patient’s functional state, quality of life and probably the risk of morbidity and death [1–3]. In 1997, the National Kidney Foundation published the Dialysis Outcomes Quality Initiative Clinical Practice Guidelines for the Treatment of Anaemia of Chronic Renal Failure [4]. These evidence-based guidelines provide criteria on how to make best use of diagnostic and therapeutic procedures for the treat-ment of patients with anaemia before starting and during dialysis treatment.
In 1999, the European Dialysis and Transplanta-tion AssociaTransplanta-tion (EDTA) published the European Best Practice Guidelines (EBPG) for the treatment of renal patients with anaemia [5]. These guidelines reviewed 200 additional publications and, based on three levels of evidence in accordance with the criteria of the US Agency for Health Care Policy and Research, updated the recommendations for the diagnosis and treatment of patients with anaemia from a European point of view. The EBPG aim to achieve haemoglobin (Hb) concentrations )11.0 gudl in 85% of renal patients.
The European Survey on Anaemia Management (ESAM) [6] was published in 2000. This survey com-piled prospective epidemiological data relating to the treatment of anaemia in a selected group of patients (ns14 527) on haemodialysis or peritoneal dialysis from 14 European countries. The results of this survey emphasized the small percentage of patients who began epoetin treatment pre-dialysis (only 11% of the patients on haemodialysis), and the low Hb concentration in
Correspondence and offprint requests to: Prof. Je´roˆme Rossert, Service de Ne´phrologie, Hoˆpital Tenon, 4, Rue de la Chine, F-75970 Paris Cedex 20, France. Email: [email protected] yDeceased.
patients at the start (mean -9.0 gudl) and at the end of treatment.
The PRE-dialysis Survey on Anaemia Manage-ment (PRESAM) has been designed with the aim of evaluating the nephrological and anaemia manage-ment of pre-dialysis patients during the 12 months before dialysis. In this survey, the participating centres were asked to include all patients who started dialysis between 1 August, 1999 and 6 April, 2000. Retrospec-tive data on the patients, and the diagnosis and treat-ment of anaemia were requested for the 12 months pre-dialysis. This survey fulfilled two objectives: to reveal the diagnostic and therapeutic patterns of anaemia in these patients and to document the pattern of referral of patients with chronic renal disease to a nephrologist before the start of dialysis in Europe, Israel and South Africa. A detailed analysis of the patient referral pattern will be presented elsewhere [7].
Subjects and methods
Study design
The PRESAM used a retrospective chart review to evaluate the management of anaemia in patients with chronic renal failure during the year before the start of dialysis. The inclusion criteria specified the enrolment of all patients aged 16–99 years who started haemodialysis or peritoneal dialysis in a participating dialysis centre between 1 August, 1999 and 6 April, 2000. Selection bias was prevented by the inclusion of all dialysis patients, except those patients who started dialysis for acute reasons and did not remain on dialysis after the acute episode. This epidemiological observational survey did not require any deviation from routine medical practice. Therefore, Institutional Review Board approval was either waived or expedited in participating institutions and informed consent was not required. The survey included patients from 779 dialysis centres from 21 European countries, as well as Israel and South Africa (Table 1). All physicians at dialysis centres in these countries were invited to participate in the survey. Participation was on a voluntary basis, without restrictions.
Data collection and management
Collected data included: start date of dialysis, date of the first visit to a nephrologist, aetiology of chronic renal failure, source of referral to dialysis centre, date of the first consultation in the dialysis centre where the patient is currently dialysed, clinical data on the first visit to dialysis centre (including body weight, blood pressure, Hb and serum creatinine concentrations), and data related to comorbidity (such as diabetes type 1 or 2, hypertension, haemoglobino-pathy, coronary heart disease, neoplasia, chronic hepatitis, cardiac failure, bronchopneumopathy, infectious disease, arrhy-thmia and inflammatory disease). Data were also collected on drug treatments, iron supplementation, major clinical events in the year as well as the month before dialysis (including angina pectoris, cardiac failure, myocardial infarction, infectious disease, inflammatory disease, bleeding, transfusion, surgery other than dialysis access and renal transplantation), and the type of vascular access (native
fistula, synthetic fistula or catheter) when starting haemo-dialysis. Finally, the use of epoetin (including the physician who started epoetin treatment, epoetin dose, route and frequency of administration, and reasons for starting epoetin treatment), iron supplementation, Hb concentra-tion, serum ferritin and serum creatinine concentrations, and transferrin saturation at the start of epoetin treat-ment were docutreat-mented. Reasons for starting epoetin treatment could be low Hb concentration, cardiac failure, coronary heart disease, symptoms of anaemia (i.e. tiredness and dyspnoea), patient complaint or other. In addition, the target Hb concentration (the concentration aimed for in the individual patient, which was decided at the start of epoetin treatment and at the start of dialysis) was recorded [8].
Data were collected using a three-page pre-printed data collection tool (DCT). Each participating centre received DCTs and detailed instructions for their completion. The DCTs were scanned electronically using TELEform1
scan-ning software. The scanned DCTs were reviewed and validated, and added to an SPSS1
database. Data were then edited against a previously established series of domain and consistency edits. These established criteria-specified mandatory fields including the year of birth, start date of dialysis and serum creatinine concentration at the first visit to the dialysis centre. Of the 4729 original DCTs, 396 (8%) lacked data in one or more of these outlined areas and were therefore excluded from the database. The resulting analy-tical database therefore consisted of 4333 valid cases for which the mandatory data were available. Some of the non-mandatory data, however, were not available for all 4333 cases because of values outside the predefined boundaries,
Table 1. Sample size by country and region Western Europe Sample
size Number of participating centres Austria 182 31 Belgium 158 13 Denmark 70 8 Finland 58 4 France 432 156 Greece 129 42 Italy 360 80 Netherlands 146 13 Portugal 202 28 Spain 639 24 Switzerland 80 28 UK 425 38 Subtotal 2881 465
Central and eastern Europe
Bulgaria 43 5 Croatia 85 20 Czech Republic 212 61 Hungary 271 39 Lithuania 32 10 Poland 438 95 Russia 89 12 Slovakia 142 29 Slovenia 32 10 Subtotal 1344 281 Other countries Israel 74 16 South Africa 34 17 Subtotal 108 33 Total 4333 779
logical inconsistencies with other data, or questionable or missing units.
Data transformations included the calculation of creat-inine clearance using the Cockcroft–Gault formula as follows:
for men: ([140 – age]3weight in kg)u(723serum creatinine
in mgudl);
for women: {0.853([140 – age]3weight in kg)}u(723serum
creatinine in mgudl) [9].
Iron status was also calculated using the following criteria: adequate iron statussserum ferritin P100mgul q transferrin saturation P20%; functional iron deficiencysserum ferritin 100mgul q transferrin saturation -20%; absolute iron deficiencysserum ferritin -100 mgul.
Statistical analysis
Standard descriptive statistics were calculated for all study variables. Bivariate and multivariate distributions were examined by plotting distributions and stratification. Differ-ence testing between groups was performed using the two-tailed t-test, analysis of variance,x2
or their non-parametric equivalent where appropriate. Significance for main effects was tested at the as0.05 level.
Results
Epidemiology
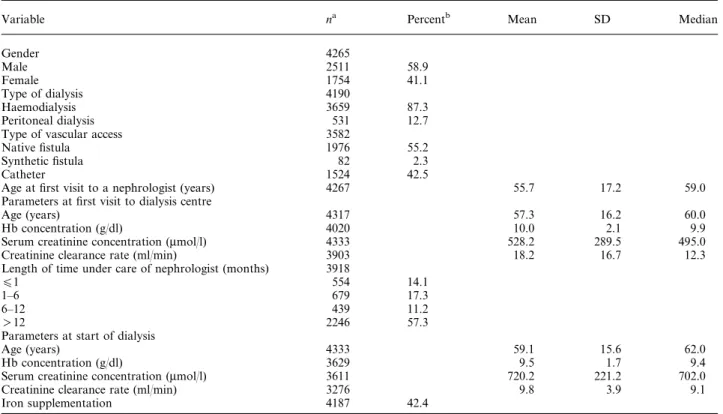
The sample consisted of 4333 patients who had recently started dialysis (Table 2). Data for several
variables were not recorded for all these patients. Fifty-nine percent of patients were male (total ns4265). The mean age of all enrolled patients at the start of dialysis was 59.1"15.6 years, with a median age of 62 years (total ns4333). Approximately 16% of the patients started dialysis at age 75 years or older.
The two most common aetiologies of renal failure in the survey sample were diabetic nephropathy (23%) and chronic glomerulonephritis (19%) (total ns4289). Vascular nephropathy (including hypertensive nephro-sclerosis) and tubulo-interstitial nephropathy occurred in 10–13% of the patients.
Four of the five most prevalent comorbidities at a patient’s first visit to a dialysis centre were cardiac-related: hypertension (78%), coronary heart disease (23%), cardiac failure (15%) and arrhythmia (8%). Eighty-four percent of patients had at least one cardio-vascular comorbidity, including hypertension (total ns4333). Excluding hypertension, 34% of the patients had at least one of the following conditions: coronary heart disease, cardiac failure or arrhythmia. Diabetic patients comprised 30.8% (1336u4333) of the total survey sample and they had a significantly higher rate of hypertension compared with non-diabetic patients (ns2997) (84 versus 76%, P-0.01). Similarly, 36% of the diabetic patients had coronary heart disease and 22% had cardiac failure compared with 18 and 12%, respectively, of non-diabetic patients (P-0.01). At their first visit to the dialysis centre, 57.3% of the patients (total ns3918) had been under the care of a nephrologist for )1 year, 31.4% had been under the
Table 2. Demographic and clinical data
Variable na Percentb Mean SD Median
Gender 4265 Male 2511 58.9 Female 1754 41.1 Type of dialysis 4190 Haemodialysis 3659 87.3 Peritoneal dialysis 531 12.7
Type of vascular access 3582
Native fistula 1976 55.2
Synthetic fistula 82 2.3
Catheter 1524 42.5
Age at first visit to a nephrologist (years) 4267 55.7 17.2 59.0
Parameters at first visit to dialysis centre
Age (years) 4317 57.3 16.2 60.0
Hb concentration (gudl) 4020 10.0 2.1 9.9
Serum creatinine concentration (mmolul) 4333 528.2 289.5 495.0
Creatinine clearance rate (mlumin) 3903 18.2 16.7 12.3
Length of time under care of nephrologist (months) 3918
O1 554 14.1
1–6 679 17.3
6–12 439 11.2
)12 2246 57.3
Parameters at start of dialysis
Age (years) 4333 59.1 15.6 62.0
Hb concentration (gudl) 3629 9.5 1.7 9.4
Serum creatinine concentration (mmolul) 3611 720.2 221.2 702.0
Creatinine clearance rate (mlumin) 3276 9.8 3.9 9.1
Iron supplementation 4187 42.4
a
Number of patients from the total population of 4333 for whom data were available. bCalculated from the patients for whom data were available.
care of a nephrologist for -6 months and 14.1% for -1 month (Table 2). Haemodialysis was started for 87.3% of the patients, whereas peritoneal dialysis was started for 12.7% (total ns4190). For more than half
of the sample, dialysis was started because of fluid overload. Other reasons included severe acidosis and malnutrition. At the start of dialysis, 42.4% of the patients received iron supplementation (total ns4187).
Table 3. Anaemia status: comparison between western Europe (WE) and centralueastern Europe (CEE) countries
Variable na Percentb Mean SD Median Pc
All patients WE 2881
CEE 1334
TargetdHb (gudl) at start of dialysis WE 2117 11.7 0.7 12.0
-0.01
CEE 743 11.3 0.8 11.0
Hb (gudl) at start of dialysis WE 2437 9.8 1.6 9.8 -0.01
CEE 1105 8.7 1.8 8.6
Hb (gudl) at start of epoetin WE 2104 9.0 1.2 9.0 -0.01
CEE 747 8.2 1.3 8.3
Iron supplementation WE 2758e 42 -0.01
CEE 1323e 39
Iron status at start of dialysis
Adequate iron stores WE 534 36 -0.01
CEE 234 53
Functional iron deficiency WE 333 22
CEE 81 18
Absolute iron deficiency WE 636 42
CEE 126 29
aNumber of patients, from total population of 4333, for whom data were available. b
Percent of patients from the number for whom data were available. c
t-test and Pearson’sx2
were used where appropriate. dIndividually set target Hb.
e
Sample size reflects all patients who responded yesuno to iron supplementation, while the percentage reflects those patients that responded yes.
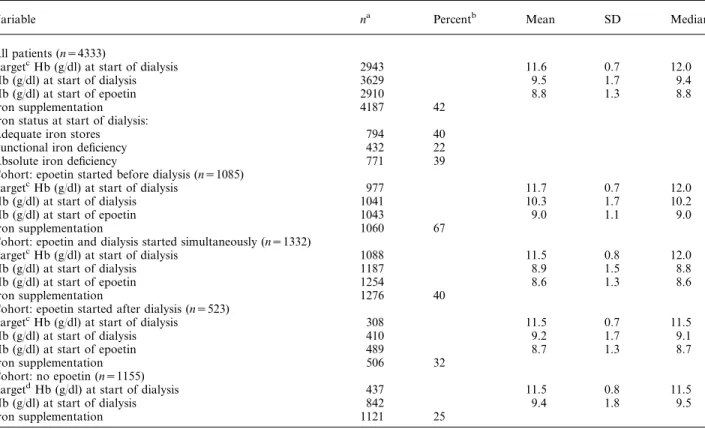
Table 4. Epoetin treatment and anaemia status in the entire survey sample
Variable na Percentb Mean SD Median
All patients (ns4333)
TargetcHb (gudl) at start of dialysis 2943 11.6 0.7 12.0
Hb (gudl) at start of dialysis 3629 9.5 1.7 9.4
Hb (gudl) at start of epoetin 2910 8.8 1.3 8.8
Iron supplementation 4187 42
Iron status at start of dialysis:
Adequate iron stores 794 40
Functional iron deficiency 432 22
Absolute iron deficiency 771 39
Cohort: epoetin started before dialysis (ns1085)
TargetcHb (gudl) at start of dialysis 977 11.7 0.7 12.0
Hb (gudl) at start of dialysis 1041 10.3 1.7 10.2
Hb (gudl) at start of epoetin 1043 9.0 1.1 9.0
Iron supplementation 1060 67
Cohort: epoetin and dialysis started simultaneously (ns1332)
TargetcHb (gudl) at start of dialysis 1088 11.5 0.8 12.0
Hb (gudl) at start of dialysis 1187 8.9 1.5 8.8
Hb (gudl) at start of epoetin 1254 8.6 1.3 8.6
Iron supplementation 1276 40
Cohort: epoetin started after dialysis (ns523)
TargetcHb (gudl) at start of dialysis 308 11.5 0.7 11.5
Hb (gudl) at start of dialysis 410 9.2 1.7 9.1
Hb (gudl) at start of epoetin 489 8.7 1.3 8.7
Iron supplementation 506 32
Cohort: no epoetin (ns1155)
TargetdHb (gudl) at start of dialysis 437 11.5 0.8 11.5
Hb (gudl) at start of dialysis 842 9.4 1.8 9.5
Iron supplementation 1121 25
aNumber of patients, from total population of 4333, for whom data were available. b
Percent of patients from the number for whom data were available. cIndividually set target Hb concentration.
Haemoglobin values
At the patients’ first visit to the dialysis centre, the mean Hb concentration was 10.0"2.1 gudl (total ns4020) (Table 2), and 68% of the patients had an Hb concentration O11.0 gudl. The mean Hb concen-tration at the start of dialysis was 9.5"1.7 gudl, and 80% of the patients had an Hb concentration O11.0 gudl (total ns3629). There was a significant difference in the mean Hb concentration between patients from western Europe (9.8"1.6 gudl) and those from central or eastern Europe (8.7"1.8 gudl) (P-0.01) (Table 3). For patients who received epoetin, the mean Hb concentration at the start of epoetin was 8.8 gudl, and 96% of these patients had Hb concentrations
O11.0 gudl (ns2910) (Table 4). The mean Hb con-centration was 9.0"1.2 gudl for patients from western Europe and 8.2"1.3 gudl for patients from central or eastern Europe (P-0.01) (Table 3).
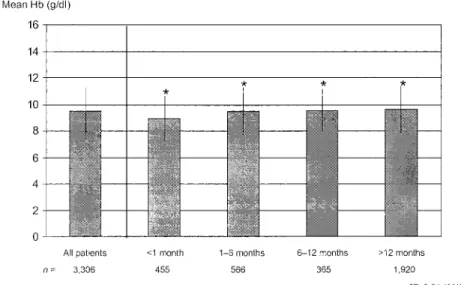
The mean Hb concentration at the start of dialysis increased slightly but significantly with the length of time a patient had been under the care of the nephro-logist (P-0.01) (Figure 1). The mean Hb concentra-tion for patients under the care of a nephrologist for -1 month was 8.9 gudl, for 1–6 months it was 9.5 gudl, and for 6–12 months as well as for )1 year it was 9.6 gudl (total ns3306). The same trend was observed when patient samples from western Europe or from central and eastern Europe were analysed separately (Figure 1B).
Fig. 1. Haemoglobin (Hb) concentration at start of dialysis by length of time under care of nephrologist. (A) Global analysis of all patients. Mean Hb concentration at start of dialysis significantly increased with length of time under care of a nephrologist (P-0.01, ANOVA). (B) Separate analysis of patients from western Europe and of patients from central and eastern Europe.
The Hb concentration at the first visit to the dialysis centre was positively correlated with creatinine clear-ance rate (rs0.43; P-0.01), but there was consider-able variability. For example, at a creatinine clearance rate of 20 mlumin, the Hb concentration ranged from 4.8 to 14.2 gudl. At the first visit to the dialysis centre, patients with creatinine clearance rates )50 mlumin had a mean Hb concentration of 12.0 gudl, those with rates of 40–50 mlumin had a mean Hb concentration of 12.3 gudl, those with rates of 30–40 mlumin had a mean Hb concentration of 11.7 gudl, those between 20 and 30 mlumin had a mean Hb concentration of 11.0 gudl, those 10–20 mlumin had 9.8 gudl, and those with a creatinine clearance of -10 mlumin had a mean Hb concentration of 9.0 gudl. The association between
Hb concentration and creatinine clearance rate was similar for diabetic and non-diabetic patients who were not treated with epoetin (ns1777) (Figure 2). The percentage of patients with a Hb concentration below the EBPG target of )11.0 gudl was progres-sively smaller with improving creatinine clearance rates (Figure 3). Conversely, the percentage of patients maintaining an Hb concentration between 11.0 and 13.0 gudl (Figure 3) increased with improving creati-nine clearance rates. For both epoetin- and non-epoetin-treated patients, the mean creatinine clearance rates were low (12.4 and 12.0 mlumin, respectively) for those who had an Hb concentration -9.0 gudl at the first visit to the dialysis centre. Creatinine clearance rate progressively increased with increasing
Fig. 3. Percentage of patients with haemoglobin (Hb) concentration O11.0 gudl or between 11.0 and 13.0 gudl by creatinine clearance rate at first visit to dialysis centre. In diabetic as well as in non-diabetic patients, the percentage of patients with Hb concentrations O11.0 gudl was progressively smaller with improving estimated creatinine clearance rates.
Fig. 2. Haemoglobin (Hb) concentration by creatinine clearance at first visit to dialysis centre, in patients with and without diabetes mellitus. There was a significant correlation between Hb concentration and estimated creatinine clearance (rs0.43; P-0.01; ns1777). For any estimated creatinine clearance, diabetic patients were not more severely anaemic than non-diabetic patients.
Hb concentration, to a high mean of 33.0 mlumin (epoetin-treated) and 29.3 mlumin (non-epoetin-treated) in those with an Hb concentration P12.0 gudl.
Epoetin treatment
Only 26.5% (1085u4095) of the patients started epoetin treatment before dialysis (Table 4). Dialysis was started
before epoetin treatment in 12.8% (523u4095) of the patients, epoetin and dialysis were started simulta-neously in 32.5% (1332u4095) of the patients, and 28.2% (1155u4095) did not receive epoetin at any time. The mean Hb concentration at the start of dialysis in patients who had received epoetin before starting dialysis was 10.3 gudl compared with 9.2 gudl in those who started epoetin after dialysis, 8.9 gudl in those who started epoetin and dialysis simultaneously, and
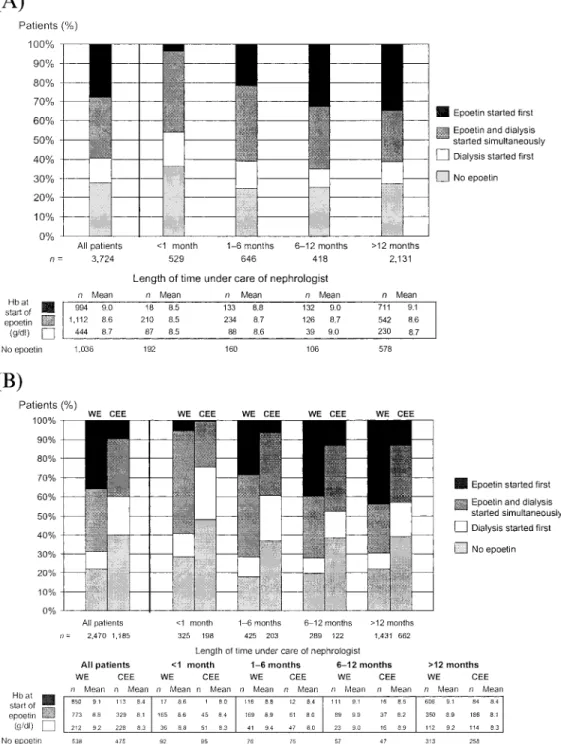
Fig. 4. Start of epoetin treatment in relation to dialysis by length of time under care of nephrologist. (A) Global analysis of all patients. The percentage of patients starting epoetin treatment before dialysis increased with length of time under care of a nephrologist. (B) Separate analysis of patients from western Europe and of patients from eastern Europe. In both cases, the percentage of patients starting epoetin treatment before dialysis increased with length of time under care of a nephrologist, but this percentage was lower for patients from central and eastern Europe than for patients from western Europe.
9.4 gudl in those who received no epoetin (Table 4). The percentage of patients meeting the EBPG target Hb concentration of )11.0 gudl at the start of dialysis was 31% of those who started epoetin first, 14% of those who started dialysis first, 8% of those who started dialysis and epoetin simultaneously, and 17% of those who were not treated with epoetin.
The percentage of patients who received epoetin before dialysis increased with the length of time under the care of a nephrologist (Figure 4A and B). There was also an increase in the mean Hb concentration at the start of epoetin treatment for patients who received epoetin before dialysis, from 8.5 gudl in patients who were under the care of a nephrologist for -1 month (ns18) to 9.1 gudl in patients under the care of a nephrologist for )1 year (ns711). When patients from western Europe were analysed separately, the mean Hb concentration increased from 8.6 gudl in patients who were under the care of a nephrologist for -1 month (ns17) to 9.1 gudl for those who were under the care of a nephrologist for )12 months (ns606) (Figure 4B). In the entire sample, patients who started epoetin pre-dialysis had a mean Hb concentration of 9.0 gudl at the start of epoetin treatment (ns994). Those who started dialysis first had a mean Hb concentration of 8.7 gudl at the start of epoetin treatment (ns444) and those who started epoetin and dialysis simultaneously had a mean Hb concentration of 8.6 gudl (ns1112) (Figure 4A). For patients from western Europe, mean Hb concentra-tions at the start of epoetin were 9.2 gudl (ns212) for those who started dialysis first and 8.8 gudl (ns773) for those who started epoetin and dialysis simulta-neously (Figure 4B). For patients from central and eastern Europe, these Hb concentrations were 8.3 gudl (ns228) and 8.1 gudl (ns329), respectively (Figure 4B). Clinicians were more likely to start epoetin treat-ment if patients had both a low Hb concentration and symptoms of anaemia (tiredness, dyspnoea) (41%, total ns3013). Hb concentration alone was the reason for starting treatment in 25% of the patients (total ns3018).
The mean dose at the start of epoetin treatment was 6302"3944 IUuweek. For patients who received epoetin pre-dialysis (ns1031), the mean dose was 5832"3429 IUuweek. This was similar to the mean dose for patients who received epoetin after the start of dialysis (5660"3542 IUuweek) (ns488). These mean doses were significantly lower than those for patients in whom dialysis and epoetin were started simultaneously (6852"4208 IUuweek; Fs28.9, P-0.01) (ns1244). The association between Hb concentration and epoetin dose was weak for all patients regardless of when epoetin was started in relation to dialysis.
Iron supplementation
At the start of dialysis, 40% had adequate iron status and 60% had iron deficiency (39% had absolute defi-ciency and 22% functional defidefi-ciency) (total ns1997). Two-thirds of the patients who received epoetin pre-dialysis also received iron supplementation (total ns1060) (Table 4). Of the patients who started epoe-tin and dialysis simultaneously (ns1276), only 40% received iron supplementation, although 59% were iron deficient. In the patients who started epoetin treatment after dialysis (ns506), 32% received iron supplementation, although 62% were iron-deficient. In the patients treated with epoetin, there were no significant differences in iron status (i.e. adequate, functional deficiency, or absolute deficiency) between those who started epoetin before, after or simulta-neously with dialysis. Of the patients who were not treated with epoetin, 56% were iron-deficient (37% absolutely and 19% functionally).
No iron supplementation was given to 74.6% of the patients who did not receive epoetin, whereas only 51.0% of the patients who were treated with epoetin were not supplemented. Additionally, of the patients who were treated with epoetin pre-dialysis, only 33% did not receive iron supplementation. Of the patients who received epoetin pre-dialysis and also iron supplementation, the majority (67%) were treated with oral iron only, 16% were treated with intravenous (i.v.) iron only and 10% were given both i.v. and oral therapy.
Patients without iron supplementation received the highest mean epoetin dose of 6591 IUuweek (ns4187). Patients with both i.v. and oral iron supplementa-tion received a mean epoetin dose of 5940 IUuweek, those with only oral iron received a mean dose of 5861 IUuweek, and those given i.v. iron alone were treated with the lowest epoetin dose with a mean of 5278 IUuweek.
Attainment of EBPG targets
The EBPG for the management of anaemia in renal patients recommends an individual target Hb concentration of )11.0 gudl, and aims for an Hb concentration of )11.0 gudl in 85% of all patients. The mean individual target Hb concentration in the overall PRESAM sample at the start of dialysis was 11.6"0.7 gudl (total ns2943) (Table 4). Nevertheless, only 18% of the patients had an actual Hb concentra-tion )11.0 gudl at the start of dialysis (Figure 5A). This percentage was 22% for patients from western Europe, and 10% for patients from eastern or central Europe (Figure 5B). Overall, the lowest incidence of
Fig. 5. EBPG on anaemia management: attainment of Hb and ferritin targets at start of dialysis by length of time under care of nephrologist. (A) Global analysis of all patients. (B) Analysis of the percentage of patients reaching Hb concentrations)11.0 gudl at start of dialysis by length of time under care of a nephrologist, according to the country of origin (western Europe vs central and eastern Europe). (C) Analysis of the percentage of patients reaching ferritin concentrations P100mgul at start of dialysis by length of time under care of a nephrologist, according to the country of origin (western Europe vs central and eastern Europe).
patients who met the EBPG target Hb concentration of )11.0 gudl was in the cohort who had been under the care of a nephrologist for -1 month (ns455) (Figure 5A). This was also observed when patients from western Europe or from eastern and central Europe were analysed separately (Figure 5B). In the cohort who had been under the care of a nephrologist for )12 months, both EBPG targets for Hb and ferritin concentrations were met by 26% of all patients in the sample who received both epoetin and iron, compared with only 18% of the patients who received epoetin only, 11% who received iron only, or 11% who received neither treatment. A comparison of patients from western Europe and from central and eastern Europe showed that a greater proportion of patients from western Europe were iron-deficient (P-0.01) (Figure 5C).
Comorbidity
Patients treated with epoetin pre-dialysis had signifi-cantly lower rates of cardiac failure in the year before dialysis than patients not treated with epoetin pre-dialysis (20 vs 24%, P-0.05). They also had signi-ficantly lower incidences of ischaemic heart disease (either angina or myocardial infarction) (17 vs 21%, P-0.05) and lower rates of blood transfusion (17 vs 21%, P-0.05). Furthermore, 11% required blood trans-fusions in the month before dialysis, compared with 19% of those who did not receive epoetin pre-dialysis (P-0.001). Similarly, patients treated with epoetin pre-dialysis also had lower rates of clinical events in the month before dialysis compared with those who did not receive epoetin pre-dialysis (cardiac failure 20 vs 23%, P-0.05; ischaemic heart disease 12 vs 16%, P-0.001).
Discussion
The PRESAM survey provided an opportunity to study a sample of 4333 incident patients in various countries. The epidemiological value of this sample is that all patients starting dialysis at any of the participating centres have been included. The mean age at the start of dialysis was 59.1 years (median 62 years), which is negligibly lower than in the ESAM [6] (mean 61 years and median 64 years). This is because the study population in the ESAM consisted of prevalent patients, whereas in the PRESAM it consisted of incident patients. In this survey, we found that the most common cause of chronic renal failure was diabetic nephropathy (23%), followed by chronic glomerulonephritis (19%) and vascular nephropathy, including hypertensive nephropathy (13%). In the ESAM [6], the second most common prevalent disease was diabetic nephropathy (18%). In the USA, analysis of data from the United States Renal Data System (USRDS) showed that diabetic nephropathy was also by far the most frequent cause of end-stage renal failure, followed by hypertensive nephropathy and
chronic glomerulonephritis [10]. In addition to the advanced age of patients and frequency of diabetes, there were also frequent, significant comorbidities documented during the first visit to a dialysis centre. Hypertension, coronary heart disease, heart failure and arrhythmia were frequently recorded during the first visit and diabetic patients showed these comorbidities more often than non-diabetic patients.
The finding that 57% of the patients who were referred to a dialysis centre had been under the care of a nephrologist for )1 year and only 14% for -1 month is promising. The latter are patients who, according to several authors [11,12], would have to be considered as being so-called ‘late referrals’. However, the mean creatinine clearance rate at the first visit to a nephrologist was only 18.2 mlumin, with over 35% of the patients having rates below 10 mlumin. Therefore, despite more than half of the patients being under the care of a nephrologist for )1 year, most arrived at the dialysis centre with an extremely advanced degree of renal insufficiency.
It is of particular significance that in this survey 68% of the patients had an Hb concentration O11.0 gudl (mean Hb concentration, 10.0 gudl) when they arrived at the dialysis centre for the first time, and should therefore, according to the EBPG, be considered for treatment with epoetin. Even when only patients from western Europe were considered, 78% had an Hb concentration O11.0 gudl (median Hb concentration, 9.8 gudl). The mean Hb concentration at the start of the treatment with epoetin was only 8.8 gudl. These values are very similar to those observed in the ESAM survey, despite the fact that the ESAM patients were on dialysis and had started treatment several years before. The patients who had been under the care of a nephrologist for )1 year had higher Hb concen-trations than those who had been referred later. Nevertheless, these patients started haemodialysis with a mean Hb concentration of 9.6 gudl, which is still much lower than the recommended concentration. Even when only patients from western Europe were considered, this latter group of patients started dialysis with a mean Hb concentration of 9.8 gudl. In other words, as in the ESAM survey, the inadequate treat-ment of patients with anaemia cannot be attributed exclusively to the late referral of the patients. It may also be attributed to the fact that some nephrologists do not follow the recommendations in the EBPG. Comparisons between patients from western and from easternucentral Europe show that patients from east-ernucentral Europe are less likely to receive epoetin treatment before starting dialysis, and have lower Hb concentrations at the start of epoetin treatment as well as at the start of dialysis. This probably reflects differences in funding available to the health care systems in the respective regions.
For patients who were not treated with epoetin and who had not received blood transfusions in previous months, there was a clear correlation between the degree of renal insufficiency (creatinine clearance rate) and the degree of anaemia (Hb concentration).
However, there was great variability, and patients with creatinine clearance rates as low as 20 mlumin had a range of Hb concentrations from severe anaemia to normal (from 4.8 to 14.2 gudl). In patients with creatinine clearance rates )50 mlumin, the mean Hb concentration was only 12.0 gudl, indicating that there was a large proportion of anaemic patients in this group. Another notable finding is that no significant differences were observed in the relationship between Hb concentration and creatinine clearance rate in diabetic patients compared with non-diabetic patients. This is in contrast to other studies, which showed that diabetic patients are more affected by anaemia with declining renal function [13].
In this survey we observed that 26.5% of all patients in the sample received treatment with epoetin before starting dialysis (36% of the patients from western Europe and 10% of the patients from central or eastern Europe). In a review of more than 150 000 patients on dialysis in the USA, Obrador et al. [14] found that only 23% of the sample had received treatment with epoetin before starting dialysis. It is also of interest to emphasize that in our survey patients who start dialysis when they already receive epoetin have a higher Hb concentration than those not being treated (10.3 versus 9.2 gudl), though the concentration is still much lower than that recommended in the EBPG. In addition, the mean Hb concentration was 9.2 gudl in patients who started treatment with epoetin after dialysis. This study showed that the patients who had been under the care of a nephrologist for )1 year have received treatment with epoetin more often. When the reasons for starting treatment with epoetin were analysed, Hb concentra-tion alone was only responsible for 25% of the cases. It appears that doctors postponed treatment with epoetin until patients showed symptoms of anaemia. The mean initial dose was slightly )6000 IUuweek (but this varied greatly), and the mean dose was lower in patients who were treated with epoetin before dialysis.
A total of 60% of the patients were iron-deficient (39% absolutely and 22% functionally), and two-thirds of the patients treated with epoetin pre-dialysis also received iron supplementation. The iron status of the patients did not improve with length of time under the care of a nephrologist. Iron supplementation conti-nued to be insufficient, perhaps because only 26% of the patients received i.v. iron supplementation, and some nephrologists probably do not follow the recommen-dations in the EBPG. As observed in the ESAM, in patients who did not receive iron supplementation, doses of epoetin were the highest.
The EBPG recommend an individual target Hb concentration of )11.0 gudl with the aim of achieving this in 85% of the patients in the unit. For the patients studied in the PRESAM, however, the mean individual target was 11.6 gudl (median value: 12.0 gudl for patients in western Europe and 11.0 gudl for patients in central or eastern Europe), but only 18% of the patients (22% of the patients from western Europe and 10% of the patients from central or eastern Europe) had an Hb concentration )11.0 gudl when starting dialysis. The percentage of
patients whose Hb concentration reached 11.0 gudl was correlated with the length of time under the care of a nephrologist. One significant observation was that a lower incidence of heart failure and ischaemic heart disease is observed in the patients undergoing treatment with epoetin before dialysis than in patients who were not treated with epoetin before the start of dialysis. The cohort treated with epoetin before dialysis also had significantly lower rates of blood transfusions than those not treated with epoetin.
In summary, this pre-dialysis survey serves to draw attention to the following points. More than 30% of the patients had been followed by a nephrologist for -6 months when they started dialysis, which probably invalidated or reduced the effectiveness of measures taken to delay the progression of chronic renal in-sufficiency and control comorbidity. Cardiovascular comorbidities are extremely common, particularly in diabetic patients and, in this survey, diabetes was the most common cause of chronic renal insufficiency. Although being under the care of a nephrologist for )1 year is associated with less frequent (predomi-nantly heart-related) complications, only a small proportion of patients receive treatment with epoetin before starting dialysis. Patients start dialysis with severe anaemia, and treatment with epoetin is started at Hb concentrations far below those recommended by the EBPG.
It is to be hoped that the data reported in this survey may draw attention to the risks of late treatment of anaemia and help to improve the management of anaemia during the initial stages of chronic renal insufficiency. Such improvements in practice may positively impact quality of life and cardiac status, and may even delay the progression of chronic renal insufficiency [15].
Acknowledgements. This epidemiological survey was supported by an educational grant from Ortho Biotech, a division of Janssen-Cilag.
References
1. Moreno F, Sanz-Guajardo D, Lopez-Gomez JM, Jofre R, Valderrabano F. Increasing the hematocrit has a beneficial effect on quality of life and is safe in selected hemodialysis patients. Spanish Cooperative Renal Patients Quality of Life Study Group of the Spanish Society of Nephrology. J Am Soc Nephrol 2000; 11: 335–342
2. Foley RN, Parfrey PS, Sarnak MJ. Clinical epidemiology of cardiovascular disease in chronic renal disease. Am J Kidney Dis 1998; 32 (Suppl 3): S112–S119
3. Ma JZ, Ebben J, Xia H, Collins AJ. Hematocrit level and associated mortality in hemodialysis patients. J Am Soc Nephrol 1999; 10: 610–619
4. National Kidney Foundation-Dialysis Outcomes Quality Initia-tive. NKF-DOQI clinical practice guidelines for the treatment of anemia of chronic renal failure. Am J Kidney Dis 1997; 30 (Suppl 3): S192–S240
5. European Best Practice Guidelines for the management of anaemia in patients with chronic renal failure. Working Party for European Best Practice Guidelines for the Management of
Anaemia in Patients with Chronic Renal Failure. Nephrol Dial Transplant1999; 14 (Suppl 5): 1–50
6. European Survey on Anaemia Management (ESAM), Nephrol Dial Transplant2000; 15 (Suppl 4): 1–76
7. Ho¨rl WH, Macdougall IC, Rossert J, Rutkowski B, Wauters J-P, Valderrabano F. PRE-dialysis Survey on Anaemia Manage-ment: patient referral. Am J Kidney Dis (Under review) 8. Jacobs C, Ho¨rl WH, Macdougall IC et al. European best
prac-tice guidelines 5: target haemoglobin. Nephrol Dial Transplant 2000; 15 (Suppl 4): 15–19
9. Cockcroft DW, Gault MH. Prediction of creatinine clearance from serum creatinine. Nephron 1976; 16: 31–41
10. Excerpts from United States Renal Data System. 1999 Annual Data Report. Am J Kidney Dis 1999; 34 (2 Suppl 1): S1–S176
11. Lameire N, Joffe P, Wiedeman M. Healthcare systems—an international review: an overview. Nephrol Dial Transplant 1999; 14 (Suppl 6): 3–9
12. Lameire N, Van Biesen W. The pattern of referral of patients with end-stage renal disease to the nephrologist—a European survey. Nephrol Dial Transplant 1999; 14 (Suppl 6): 16–23 13. Valderrabano F, Horl WH, Jacobs C et al. European best
prac-tice guidelines 1–4: evaluating anaemia and initiating treatment. Nephrol Dial Transplant2000; 15 (Suppl 4): 8–14
14. Obrador GT, Rathazer R, Arora P, Kausz AT, Pereira BJG. Prevalence of and factors associated with suboptimal care before initiation of dialysis in the United States. J Am Soc Nephrol 1999; 10: 1793–1800
15. Rossert J, McClellan WM, Roger SD, Verbeelen DL. Epoetin treatment: what are the arguments to expect a beneficial effect on progression? Nephrol Dial Transplant 2002; 17 (3): 359–362
Received for publication: 23.11.01 Accepted in revised form: 20.8.02