[12:57 30/7/2011 Bioinformatics-btr390.tex] Page: 2453 2453–2454
BIOINFORMATICS
APPLICATIONS NOTE
Vol. 27 no. 17 2011, pages 2453–2454doi:10.1093/bioinformatics/btr390Systems biology
Advance Access publication July 4, 2011Simple Neurite Tracer: open source software for reconstruction,
visualization and analysis of neuronal processes
Mark H. Longair
1,∗, Dean A. Baker
2and J. Douglas Armstrong
31Institute of Neuroinformatics, Uni/ETH Zürich, Winterthurerstrasse 190, CH-8057 Zürich, Switzerland,2Department
of Genetics, University of Cambridge, Cambridge CB2 3EH and3Institute for Adaptive and Neural Computation, School of Informatics, The University of Edinburgh, Edinburgh EH8 9AB, UK
Associate Editor: Olga Troyanskaya
ABSTRACT
Motivation: Advances in techniques to sparsely label neurons
unlock the potential to reconstruct connectivity from 3D image stacks acquired by light microscopy. We present an application for semi-automated tracing of neurons to quickly annotate noisy datasets and construct complex neuronal topologies, which we call the Simple Neurite Tracer.
Availability: Simple Neurite Tracer is open source software, licensed
under the GNU General Public Licence (GPL) and based on the public domain image processing software ImageJ. The software and further documentation are available via http://fiji.sc/Simple_Neurite_Tracer as part of the package Fiji, and can be used on Windows, Mac OS and Linux. Documentation and introductory screencasts are available at the same URL.
Contact: [email protected]
Received on February 22, 2011; revised on May 31, 2011; accepted on June 22, 2011
1 INTRODUCTION
As genetic techniques for imaging neurons have improved and become more widespread, there has been an increasing demand for software to extract accurate and quantitative data on morphology, topology and connectivity patterns from these images. This process, which typically involves generating a graph of points through the midlines of neurons, is often known as ‘tracing’. Extracting path data from 3D image stacks enables researchers to publish detailed information about putative connectivity, to reduce image complexity and to produce summary statistics for different neuron types. When combined with image registration, neuronal paths can be analysed for variation or used to construct connectivity maps.
In this note, we introduce the Simple Neurite Tracer, an application for precise annotation of paths from tube-like structures (such as neurons or blood vessels) in large image stacks. Unlike many packages that analyse whole images with a single set of parameters, the Simple Neurite Tracer is an exploratory tracing system. The semi-automatic approach can efficiently find the best path between points in neurons and build up complex topology. The package also provides methods for measuring neuron length and volume, an interface for Sholl analysis and interactive 3D visualization. In addition, as part of the Fiji framework, the Simple Neurite Tracer interacts with other ImageJ plugins for further ∗To whom correspondence should be addressed.
analysis and visualization, as well as supporting a choice of import and export options. The application is designed for images from light microscopy techniques such as confocal, rather than electron microscopy. Any image file format understood by Bio-Formats (Linkert et al., 2010), which currently supports over 100 different formats, may be used for tracing.
Simple Neurite Tracer is one of only a few truly Open Source, cross-platform applications for semi-automated neuron tracing in 3D image stacks. One alternative is the Farsight toolkit, and its trace editor, which, while having some more sophisticated segmentation methods, is more difficult to install and use. Meijering (2010) reviews other freely available software for neuron tracing including an early version of the Simple Neurite Tracer. Our software currently supports tracing only from existing image stacks, rather than directly from the microscope as with Neurolucida. In addition, it is best suited for fast tracing of higher order neural branches, rather than precise reconstructions of smaller features like spines, such as can be done with hxskeletonize.
2 FEATURES 2.1 Tracing interface
To build a simple path, users select successive points along the midline of a neural process, and the software will find a path between them. For clear images, these points may be distantly separated in the volume, while for noisier data users will have to select points that are closer together. This interface is inspired by that of NeuronJ (Meijering et al., 2004). When building paths, the user confirms each new segment, so if the wrong path is found, they may cancel and retry with a closer set of points. Segments may start or end on other paths, in order to create branches, tree structures or even cyclic topologies. Although typical use of the software is for tracing in 3D image stacks, the software also processes 2D images.
Finding the paths between these points in the volume is done with bidirectional A* search (Hart et al., 1968) on the reciprocal of the cost of moving to a new point (Wink et al., 2000). The cost is the distance between the points, scaled by either the intensity of the image or a measure of ‘tubeness’ at the new point.
The speed and accuracy of the tracing can be improved with a Hessian-based analysis of image curvatures, optimized to find structures of particular sizes (Sato et al., 1998). Parameters may be set manually or picked more intuitively from a palette of previews of the preprocessed data. Alternatively, images may be preprocessed
[12:57 30/7/2011 Bioinformatics-btr390.tex] Page: 2454 2453–2454 M.H.Longair et al.
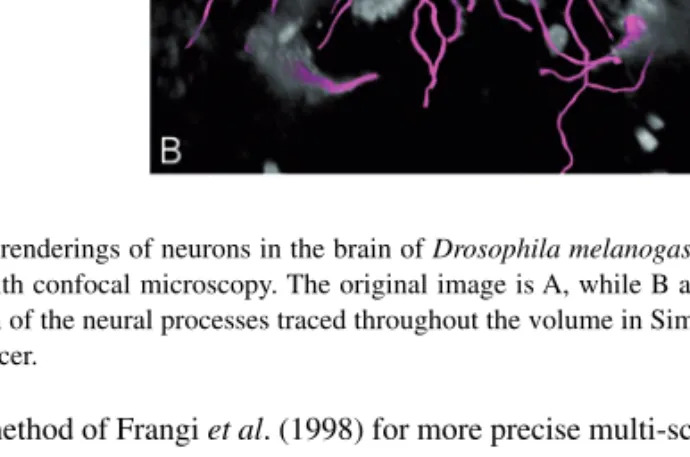
Fig. 1. 3D renderings of neurons in the brain of Drosophila melanogaster,
acquired with confocal microscopy. The original image is A, while B adds a projection of the neural processes traced throughout the volume in Simple Neurite Tracer.
with the method of Frangi et al. (1998) for more precise multi-scale filtering.
2.2 Volume reconstructions
Two methods for reconstructing 3D volumes are provided. The first, referred to as ‘fitting’, finds a circular cross-section at points along a path, producing a radius and refined midpoint over the entire trace. This creates more realistic visualizations of neurons, as illustrated in Figure 1. The other method, referred to as ‘filling’, uses Dijkstra’s algorithm to find all points reachable from the path under a certain cost. By finding an appropriate threshold, filling can be used to compare volumes and extract particular neurons for individual visualization and analysis.
3 ANALYSIS
A common method for producing summary statistics of neuronal morphology is Sholl analysis (Sholl, 1953). This method characterizes neuronal arbors based on the distribution of crossings of neuronal processes at concentric circles about a cell’s soma. The Simple Neurite Tracer can apply several variants of Sholl’s method, and visualize this distribution as a graph or by colouring the paths. The interface can also launch the Analyze Skeleton plugin to generate further statistics that describe the morphology of the traces. Since the software can export data in CSV or the native XML-based format, creating custom analyses is a further option.
3.1 Visualization
Simple Neurite Tracer provides 2D visualization of traces and 3D rendering using the ImageJ 3D Viewer (Schmid et al., 2010).
The 2D interface by default shows a projection of all traces in the stack, but may be changed to only show elements in slices within a configurable distance. The researcher can switch between orthogonal views of the data, thus making it easier to locate the midpoints of larger neurons.
The 3D Viewer displays a volumetric rendering of the image stack and renderings of the paths as each new path segment is traced. Other ImageJ plugins can be used to add additional structures to the view, such as neuropil surfaces to contextualize paths. The traces can be coloured according to values in other stacks loaded into ImageJ. This feature is useful for visualizing another dimension of data along the same path, such as colouring a neuron with the intensity of a synaptic density marker. The 3D viewer supports export of the 3D scene in DXF format, so that publication quality images can be rendered in 3D modelling software, such as Blender.
3.2 Interoperability
The open file format used by Simple Neurite Tracer (see Supplementary file 1) can be easily parsed by programmers for further analysis. However, a higher level view of the data can be obtained with the ‘Export to CSV’ option, suitable for analysis in spreadsheets or statistical software.
The ‘Export to SWC’ option produces SWC files (Cannon et al., 1998), which may be analysed in software such as L-measure (Scorcioni et al., 2008), providing a greater range of analysis methods, or uploaded to databases such as NeuroMorpho.org.
ACKNOWLEDGEMENTS
The authors would like to thank Benjamin Schmid, Albert Cardona, Stephan Preibisch, Ting Zhao and Johannes Schindelin for contributions of code and advice.
Funding: EPSRC (with co-funding from the MRC and BBSRC) via
the Doctoral Training Centre in Neuroinformatics at the University of Edinburgh to M.H.L.; research grants from the BBSRC and EPSRC UK to D.A.B. and J.D.A.
Conflict of Interest: none declared.
REFERENCES
Cannon,R.C. et al. (1998) An on-line archive of reconstructed hippocampal neurons. J.
Neurosci. Methods, 84, 49–54.
Frangi,A.F. et al. (1998) Multiscale vessel enhancement filtering. In MICCAI’98 Lecture
Notes in Computer Science, Vol. 1496, pp. 130–137.
Hart,P.E. et al. (1968) A formal basis for the heuristic determination of minimum cost paths. IEEE Trans. Syst. Sci. Cybern., 4, 100–107.
Linkert,M. et al. (2010) Metadata matters: access to image data in the real world. J.
Cell Biol., 189, 777–782.
Meijering,E. et al. (2004) Design and validation of a tool for neurite tracing and analysis in fluorescence microscopy images. Cytometry A, 58, 167–176.
Meijering,E. (2010) Neuron tracing in perspective. Cytometry A, 77, 693–704. Sato,Y. et al. (1998) Three-dimensional multi-scale line filter for segmentation and
visualization of curvilinear structures in medical images. Med. Image Anal., 2, 143–168.
Schmid,B. et al. (2010) A high-level 3D visualization API for Java and ImageJ. BMC
Bioinformatics, 11, 1–7.
Scorcioni,R. et al. (2008) L-Measure: a web-accessible tool for the analysis, comparison and search of digital reconstructions of neuronal morphologies. Nat. Protoc., 3, 866–867.
Sholl,D.A. (1953) Dendritic organization in the neurons of the visual and motor cortices of the cat. J. Anat., 87, 387–406.
Wink,O. et al. (2000) Minimum cost path determination using a simple heuristic function. In ICPR ’00, Vol. 3, pp. 998–1001.