Advance Access publication December 10, 2013
© The Author 2013. Published by Oxford University Press on behalf of the Maryland Psychiatric Research Center. All rights reserved. For permissions, please email: [email protected]
Static and Dynamic Characteristics of Cerebral Blood Flow During the Resting
State in Schizophrenia
Jochen Kindler*,1,4, Kay Jann1,2,4, Philipp Homan1, Martinus Hauf3, Sebastian Walther1, Werner Strik1, Thomas Dierks1, and Daniela Hubl1
1Department of Psychiatric Neurophysiology, University Hospital of Psychiatry, University of Bern, Bern, Switzerland; 2Laboratory
of Functional MRI Technology, Ahmanson-Lovelace Brain Mapping Center, Department of Neurology, University of California Los Angeles, Los Angeles, CA; 3Support Center for Advanced Neuroimaging (SCAN), Institute for Diagnostic and Interventional
Neuroradiology, Inselspital, University of Bern, Bern, Switzerland;
4These authors contributed equally to the article.
*To whom correspondence should be addressed; University Hospital of Psychiatry, Bolligenstrasse 111, CH-3000 Bern 60, Switzerland; tel: +41 31 9309111, fax: +41 31 9309404, e-mail: [email protected]
Background: The cerebral network that is active dur-ing rest and is deactivated durdur-ing goal-oriented activity is called the default mode network (DMN). It appears to be involved in self-referential mental activity. Atypical functional connectivity in the DMN has been observed in schizophrenia. One hypothesis suggests that pathologically increased DMN connectivity in schizophrenia is linked with a main symptom of psychosis, namely, misattribu-tion of thoughts. Methods: A resting-state pseudocontinu-ous arterial spin labeling (ASL) study was conducted to measure absolute cerebral blood flow (CBF) in 34 schizo-phrenia patients and 27 healthy controls. Using indepen-dent component analysis (ICA), the DMN was extracted from ASL data. Mean CBF and DMN connectivity were compared between groups using a 2-sample t test. Results: Schizophrenia patients showed decreased mean CBF in the frontal and temporal regions (P < .001). ICA demon-strated significantly increased DMN connectivity in the precuneus (x/y/z = −16/−64/38) in patients than in controls (P < .001). CBF was not elevated in the respective regions. DMN connectivity in the precuneus was significantly corre-lated with the Positive and Negative Syndrome Scale scores (P < .01). Conclusions: In schizophrenia patients, the pos-terior hub—which is considered the strongest part of the DMN—showed increased DMN connectivity. We hypothe-size that this increase hinders the deactivation of the DMN and, thus, the translation of cognitive processes from an internal to an external focus. This might explain symptoms related to defective self-monitoring, such as auditory verbal hallucinations or ego disturbances.
Key words: psychosis/default mode network/arterial spin labeling/functional connectivity/precuneus
Introduction
Cerebral blood flow (CBF) in schizophrenia has been extensively researched for several decades. Mean CBF during the resting state is significantly altered in schizo-phrenia patients compared with healthy controls (HCs).1,2
The arterial spin labeling (ASL) magnetic resonance imaging (MRI) signal is directly linked to CBF and pro-vides a quantitative and absolute measure of regional CBF (rCBF), reflects the level of neuronal activity, and is comparable with positron emission tomography (PET).3,4
Resting-state data of functional MRI (fMRI) and PET can efficiently be parsed into so-called resting-state net-works (RSNs).4–6 These RSNs are defined by
synchro-nized spontaneous oscillations between the cortical areas that compose the specific RSN.
The default mode network (DMN) is an RSN that is active during rest and is deactivated during goal-oriented activity.4 The cerebral structures involved in the DMN
comprise the posterior cingulate cortex, precuneus, infe-rior parietal cortex, medial prefrontal cortex, and medial temporal lobe.4,7–10 It is characterized by coherent
low-frequency neuronal oscillations that reflect processes such as internal mentation, the generation of self-ref-erential spontaneous thoughts, and task-independent introspection.9
For efficient interaction with the environment, the translation between the self-referential resting-state (default mode) and non–self-referential goal-directed processes is pivotal. The default mode has to be success-fully terminated to start any goal-directed process, ie, task-induced deactivation (TiD).11
In schizophrenia, an increase in DMN activity or a failure of DMN deactivation has been postulated to
cause misattributions of thoughts because of the func-tional connection between the DMN and internal menta-tion.12,13 Therefore, the dynamic competition between the
DMN and brain systems that support external attention becomes disturbed.14 Consequently, perceptions arising
from imagined scenarios and from the external world become blurred, and the boundary between self and other is dissolved.15 The psychopathological phenomena
seen in schizophrenia patients, such as auditory halluci-nations, in which self-referential thoughts are attributed to an external agency, or other symptoms with a self-monitoring deficit, such as thought insertion or thought withdrawal, might be explained within this framework.
Deviations within the DMN network have been mea-sured and compared between schizophrenia patients and HCs by using blood oxygen level–dependent (BOLD) fMRI. Most DMN studies have used a region of inter-est (ROI) seed-based correlation approach, which yields inconsistent results.11,16 Several studies have reported
decreased connectivity in parts of the DMN,17–19 whereas
others have showed increased connectivity20,21; some
oth-ers have showed both patterns.22 This inconsistency might
be due to methodological differences. However, the most common finding is an increased connectivity within the dorsal hub of the DMN, which consists of the precuneus and dorsal cingulum.16
BOLD-fMRI provides a relative measure of blood per-fusion by measuring differences in oxygen consumption. In contrast, ASL provides an absolute quantification of the deviations of CBF and the herefrom computed DMN. In schizophrenia, absolute quantification of the DMN has not been performed; addressing this might help inter-pret the ambiguous results concerning increased DMN connectivity in this disease.12 As ASL provides
quantita-tive maps of CBF,23 it is not necessary to compare a target
region with a reference.24,25 The ASL technique has
suc-cessfully been used to measure changes in rCBF between healthy individuals and schizophrenia patients,1,26 and for
the determination of psychopathological phenomena,
such as auditory hallucinations.27,28 Nevertheless, ASL
data can be used not only for absolute CBF quantifica-tion, but also for the calculation of RSN in general, and in the DMN in particular.29,30
In this study, we used ASL MRI to quantify CBF and subsequently calculate DMNs by using a group-level independent component analysis (ICA) in 34 schizophre-nia patients and 27 age-matched HCs. We hypothesized that DMN connectivity in the dorsal hub increases dur-ing the restdur-ing state in schizophrenia patients, and that this increase correlates positively with psychopathologi-cal features. We expected that CBF would be elevated in areas of increased connectivity.
Methods
Patients and Clinical Investigation
Thirty-four patients (P) with a diagnosis of schizophrenia (n = 27) or schizoaffective disorder (n = 7) according to the ICD-10 and 27 HC subjects (HC; matched for age and sex) were included in our study (table 1). Inclusion crite-ria were age (18–65 y) and right-handedness. Exclusion criteria were MRI contraindications and medical disor-ders other than schizophrenia or schizoaffective disorder. None of the patients reported substance misuse in the 4 weeks before or during the study.
All patients had medication-resistant positive psy-chotic symptoms (eg, auditory hallucinations, delu-sions, and ego disturbances). Therapy refractoriness was defined as having no response to at least 2 antipsychotic treatments in recommended dosages, each administered for at least 8 weeks. Medications remained unchanged since 2 weeks prior to the study. Diagnoses were estab-lished on the basis of clinical interviews and review of psychiatric history. The psychopathology assessment, consisting of the Positive and Negative Symptom Scale (PANSS),31 Psychotic Symptom Rating Scale (PsyRats),32
and Auditory Hallucination Rating Scale (AHRS),33
was performed 20 ± 6 hours (mean ± SD) before MRI
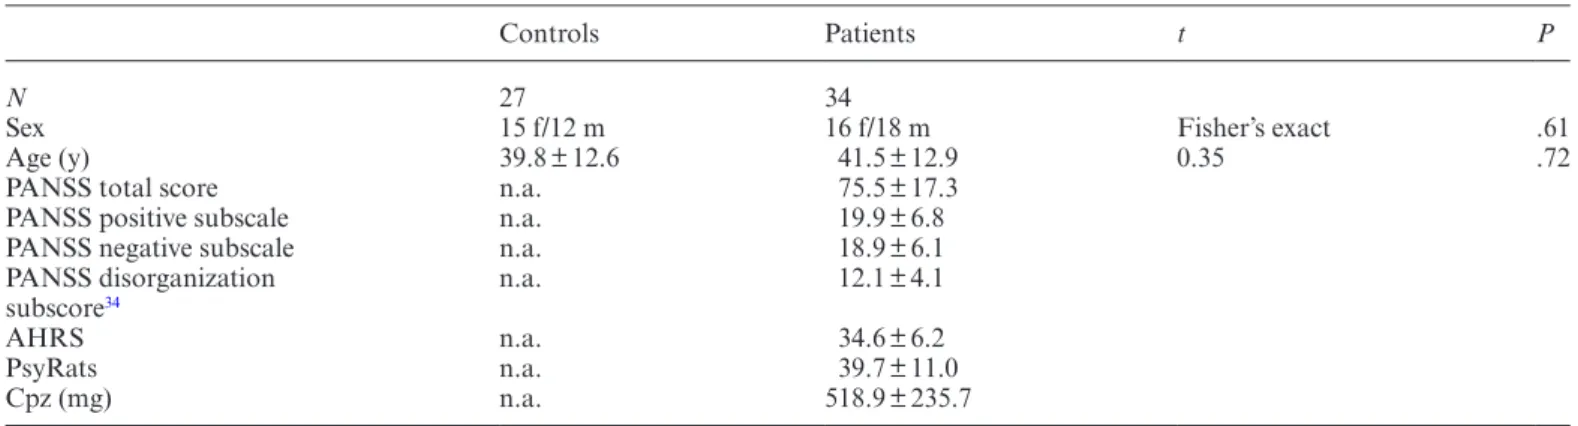
Table 1. Sample Characteristics With Mean Values and SDs for Healthy Controls and Schizophrenia Patients
Controls Patients t P
N 27 34
Sex 15 f/12 m 16 f/18 m Fisher’s exact .61
Age (y) 39.8 ± 12.6 41.5 ± 12.9 0.35 .72
PANSS total score n.a. 75.5 ± 17.3 PANSS positive subscale n.a. 19.9 ± 6.8 PANSS negative subscale n.a. 18.9 ± 6.1 PANSS disorganization
subscore34 n.a. 12.1 ± 4.1
AHRS n.a. 34.6 ± 6.2
PsyRats n.a. 39.7 ± 11.0
Cpz (mg) n.a. 518.9 ± 235.7
Note: f, female; m, male; Cpz, chlorpromazine equivalents; PANSS, Positive and Negative Symptom Scale; PsyRats, Psychotic Symptom
acquisition. Participants were told to rest in the MR scanner and to stay awake with their eyes closed. PANSS positive, PANSS negative, and PANSS disorganization34
subscores are reported.
The investigation was conducted in accordance with the Declaration of Helsinki and was approved by the local ethics committee. Participants provided informed written consent to participate in the study.
MRI Data Analysis
MRI was performed using a 3.0-Tesla whole-body MRI system (Magnetom Trio; Siemens Medical Systems) with a standard 12-channel radiofrequency head coil. High-resolution 3D structural MRI and ASL were acquired in 1 session. T1-weighted 3D scans were recorded as magne-tization prepared rapid gradient echo (voxel size = 1 × 1 × 1 mm3; inversion time = 1000 ms; repetition time [TR] = 2
s; echo time [TE] = 3.4 ms) and served as high-resolu-tion 3D anatomical templates for coregistrahigh-resolu-tion with functional data.
A pseudocontinuous ASL (pCASL) technique was used to measure CBF.35,36 In this gradient-echo
echo-pla-nar imaging sequence, interleaved images with and with-out labeling were acquired. A delay of 1250 milliseconds was applied between the end of the labeling pulse (label time = 1600 ms) and image acquisition (slice-acquisition time = 45 ms; field of view = 220 mm2; matrix = 64 × 64;
TR/TE = 4000/18 ms). A total of 14 slices (voxel size = 3.4 × 3.4 × 6 mm3; gap = 1.5 mm) were acquired in
the anterior and posterior commissure line, from infe-rior to supeinfe-rior, in a sequential order. The pCASL scan comprised 80 acquisitions (40 pairs of label and control images). Total acquisition time was 5 minutes, 44 seconds. Static Characteristics of CBF/Mean CBF
Data analysis was performed using Matlab (Matlab version 8, release 14; The MathWorks Inc.), statistical parametric mapping (SPM 8; Wellcome Department of Imaging Neuroscience, London, England; www.fil.ion.
ucl.ac.uk/spm/software/spm8/), and an in-house
soft-ware.37 All ASL time series were first realigned to correct
for motion artifacts. See online supplementary material
for details on CBF quantification and subject motion. A global and assumption-free investigation of the whole-brain CBF was computed. Statistics for changes in CBF were computed using the SPM 8 software by comparing CBF values between P and HC in a voxel-wise analysis using a 2-sample unpaired t test model. We report clusters >30 (voxel size = 2 × 2 × 2 mm3) with a
voxel-level threshold of P < .001 (uncorrected). Regions that survived familywise error (FWE) correction at P < .05 (whole brain) are indicated in table 2.
Dynamic Characteristics of CBF/DMN Connectivity DMNs were identified using an ICA that decomposed each individual’s functional ASL data into statistically independent components, each delineating clusters of
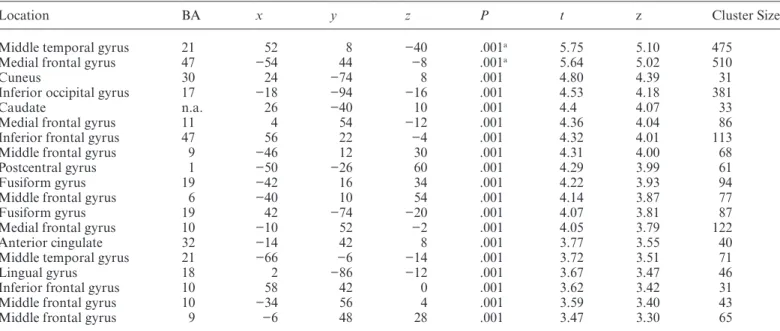
Table 2. Brain Regions With Significant Differences in Mean Cerebral Blood Flow Between Healthy Controls and Schizophrenia
Patients
Location BA x y z P t z Cluster Size
Middle temporal gyrus 21 52 8 −40 .001a 5.75 5.10 475
Medial frontal gyrus 47 −54 44 −8 .001a 5.64 5.02 510
Cuneus 30 24 −74 8 .001 4.80 4.39 31
Inferior occipital gyrus 17 −18 −94 −16 .001 4.53 4.18 381
Caudate n.a. 26 −40 10 .001 4.4 4.07 33
Medial frontal gyrus 11 4 54 −12 .001 4.36 4.04 86 Inferior frontal gyrus 47 56 22 −4 .001 4.32 4.01 113 Middle frontal gyrus 9 −46 12 30 .001 4.31 4.00 68
Postcentral gyrus 1 −50 −26 60 .001 4.29 3.99 61
Fusiform gyrus 19 −42 16 34 .001 4.22 3.93 94
Middle frontal gyrus 6 −40 10 54 .001 4.14 3.87 77
Fusiform gyrus 19 42 −74 −20 .001 4.07 3.81 87
Medial frontal gyrus 10 −10 52 −2 .001 4.05 3.79 122
Anterior cingulate 32 −14 42 8 .001 3.77 3.55 40
Middle temporal gyrus 21 −66 −6 −14 .001 3.72 3.51 71
Lingual gyrus 18 2 −86 −12 .001 3.67 3.47 46
Inferior frontal gyrus 10 58 42 0 .001 3.62 3.42 31 Middle frontal gyrus 10 −34 56 4 .001 3.59 3.40 43
Middle frontal gyrus 9 −6 48 28 .001 3.47 3.30 65
Note: Contrast healthy controls (HC) > schizophrenia patients (P), 2-sample t test, P < .001, cluster size > 30, statistical parametric
mapping (SPM) (t = 59), local maximum peak values according to SPM 8 x, y, z coordinates in Montreal Neurological Institute space; cluster size = number of voxels. BA, Brodmann area.
voxels that exhibited synchronous temporal fluctuations. The DMN was computed using a concatenated group ICA approach38,39 as implemented in the group ICA of
the fMRI toolbox (GIFT, http://icatb.sourceforge.net/)38
version 1.3i (a Matlab toolbox). See online
supplemen-tary material for details on the ICA.
In regions of interest with existing prior hypotheses (dorsal cingulate, precuneus), results were small-volume corrected within a sphere with a diameter of 15 mm around peak coordinates, as reported by Whitfield-Gabrieli et al20 and Anticevic et al,13 and reported at a
voxel-level threshold of P < .05, FWE corrected. Statistics
CBF values were extracted for the whole DMN and for areas with significant differences in the DMN between P and HC. Additionally, normalized CBF values are reported {[voxel CBF – global gray matter (GM) CBF]/SD}. DMN z values of significant ROIs were compared using 2-sided, 2-sample t tests. The associa-tion between DMN z values in regions showing a sig-nificant increase in P compared with HC, as well as the PANSS, AHRS, and PsyRats scores were assessed using Spearman’s rank correlation. Significance level was set at P < .05 (2 sided).
Results
Group Component for the DMN
The results of the concatenated group ICA are shown in
figure 1. The ICA on a group level identified the DMN.
Group-specific DMN maps for HC and P are presented in the online supplementary figure 1.
Static Characteristics of CBF/Mean CBF
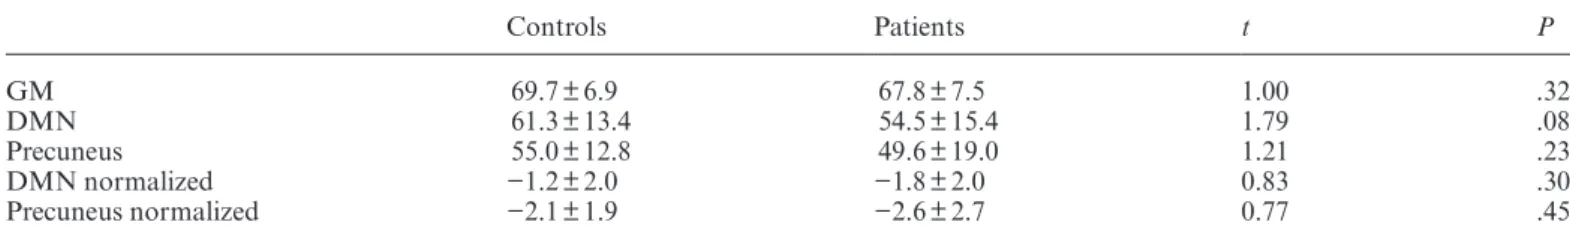
Compared with HC, P demonstrated significantly de creased CBF in frontal and temporal areas and in the cuneus, inferior occipital gyrus, caudate, anterior cingu-late, and lingual, postcentral, and fusiform gyri (table 2). No areas showed an increase in CBF in P compared with HC. CBF extracted for GM did not differ between groups
(table 3). CBF reduction observed in the middle
tempo-ral gyrus (Brodmann area [BA] 21; x/y/z = 52/8/−40; t = 5.75; z = 5.10; cluster size = 475; df = 59) and in the medial frontal gyrus (BA 47; x/y/z = −54/44/−8; t = 5.64; z = 5.02; cluster size = 510; df = 59), it remained signifi-cant after correction for FWEs.
Dynamic Characteristics of CBF/DMN Connectivity The whole-brain analysis revealed significantly increased DMN connectivity in the precuneus in P compared with HC (BA 7; x/y/z = −16/−64/38; t = 3.76; z = 3.55; clus-ter size = 51) (figure 2). The ROI analysis in the precu-neus indicated significantly increased DMN z values in
P compared with HC (P < .001; t = 3.67; df = 59). The results remained significant after correction for FWEs.
A significantly increased DMN connectivity (P < .001; t = 3.87; df = 59) in the posterior cerebellar lobe (BA 19; x/y/z = 28/−80/−22; t = 3.83; z = 3.61; cluster size = 61) was detected in HC compared with P. Note that the latter is not a part of the DMN. No other regions reached the level of significance.
CBF in the DMN
CBF in the DMN was higher at a trend level in the HC group (P < .08; t = 1.79; df = 59). There were no signifi-cant differences in CBF in the precuneus between P and
HC (table 3).
Correlation of DMN Connectivity With Psychopathological Features
In P, the DMN z values in the precuneus and the PANSS total scores were significantly and positively correlated (Spearman’s ρ = .442; P = .009; figure 3). No correlation
Fig. 1. Group component (n = 61) of the default mode network
(DMN), sagittal slices, full axial view. DMN distribution from the independent component analysis of the whole data set. The strongest signal is localized in the posterior hub, consisting of the posterior cingulate cortex and the precuneus. The numbers below the upper figures indicate the z coordinate of the axial slice in Montreal Neurological Institute space.
was found between DMN z values in the precuneus and scores on any of the hallucination-specific scales (PsyRats and AHRS). See further results on correlations (DMN z values and PANSS subscales; DMN z values and CBF) in the online supplemental material.
Discussion
To our knowledge, this is the first study that investigated both the static and dynamic properties of CBF in schizo-phrenia. Our main finding suggests the presence of a sig-nificant difference in the dynamic characteristics of CBF between schizophrenia patients and HCs, ie, increased DMN connectivity within the posterior hub of the DMN. Functional connectivity in the precuneus correlated with psychopathological features. These findings are in line with DMN connectivity based on conventional BOLD functional connectivity analyses.13,17,20 We expected that
the absolute quantification would yield a significantly increased mean CBF in the respective regions, which was not confirmed. Interestingly, CBF in the DMN was reduced at a trend level in P. One possible explanation for this observation is that CBF reductions within the DMN contribute to specific alterations of functional connectiv-ity in patients.
We also replicated previous findings of reduced mean CBF in schizophrenia patients compared with HC, predominantly in the frontal and temporal regions.1,26
Reduced CBF suggests reduced metabolism in the respec-tive regions. Individuals with schizophrenia show impair-ments in frontal and temporal neurocognitive functions,40
as well as GM volume reduction in these regions.41 We
hypothesize that CBF reduction is causally related to the impairments of temporal and frontal brain functions in schizophrenia.
The striking similarity between our results and those of van Lutterveld et al42 has to be mentioned. Those
authors investigated healthy individuals with a propen-sity for auditory hallucinations and reported increased functional connectivity in the dorsal hub of the DMN.
This was also the first study that calculated the DMN based on ASL data in schizophrenia patients. We showed
Table 3. Mean Cerebral Blood Flow (CBF) in the Grey Matter (GM), Default Mode Network (DMN), and Precuneus
Controls Patients t P GM 69.7 ± 6.9 67.8 ± 7.5 1.00 .32 DMN 61.3 ± 13.4 54.5 ± 15.4 1.79 .08 Precuneus 55.0 ± 12.8 49.6 ± 19.0 1.21 .23 DMN normalized −1.2 ± 2.0 −1.8 ± 2.0 0.83 .30 Precuneus normalized −2.1 ± 1.9 −2.6 ± 2.7 0.77 .45
Note: Mean CBF values (ml/100 g/min) with SD are given for the GM, DMN, and precuneus. For the DMN and precuneus, the
normalized values are also reported.
Fig. 2. Brain regions with significant increase in default mode
network (DMN) connectivity in patients (P; n = 34) compared with healthy controls (HC; n = 27). Two-sample t test, P < .001, cluster size > 30. Contrast P > HC. Yellow areas show a significantly increased DMN connectivity in P compared with HC in the precuneus, in the dorsal part of the DMN (BA 7,
x/y/z = −16/−64/38; cluster size = 51; P < .001; t value = 3.76; z value = 3.55). x, y, z coordinates in Montreal Neurological
Institute space.
Fig. 3. Correlation between general psychopathological features
and default mode network (DMN) z values in the precuneus in patients (n = 34). Mean DMN z value in the precuneus and the Positive and Negative Symptom Scale (PANSS) total score exhibited a significant positive correlation (Spearman’s ρ = .442,
that an ICA on ASL data with GIFT provides reasonable results when extracting DMN data (figure 1). Because of the nature of BOLD and the absence of studies using an absolute quantification of CBF, it is unclear whether the DMN connectivity observed in schizophrenia patients denotes an increase in absolute metabolic activity in the same regions. Although our primary hypothesis of an increased DMN in schizophrenia patients was confirmed, the data did not confirm the second hypothesis of an increase in CBF in the respective regions.
The use of ASL in functional connectivity analyses is a rather new field.43–47 A recently published pCASL DMN
study44 demonstrated a large task-related CBF decrease
(TiD) in the posterior-inferior precuneus within a healthy population. The posterior cingulate and posterior-infe-rior precuneus were also the regions that exhibited the highest CBF at rest and during task performance. In the same regions, a decreased TiD in schizophrenia patients during a working memory task has been shown using BOLD-fMRI.20 Hyperconnectivity and decreased TiD
correlated negatively with each other, which indicates that a decrease in task-related suppression is associated with an increase in connectivity. Finally, both decreased TiD and increased connectivity were correlated with psy-chopathological features, ie, with positive and negative symptoms, as measured using the PANSS.11,13,20 These
findings converge towards a perturbation within the dor-sal parts of the DMN.
The precuneus is involved in several higher-order func-tions, such as visuospatial imagery, episodic memory retrieval, and self-processing operations.48 It is engaged in
first-person perspective taking, the experience of agency, self-related mental representations, and self-conscious-ness. Some of these functions are severely disturbed in schizophrenia. Moreover, the precuneus has the highest resting metabolic rate of the brain.44,49
The processing of self-referential stimuli in the anterior and posterior midline regions is a fundamental compo-nent in the generation of a model of the self and has led to the concept of cortical midline structures.50
A recent study51 suggests that altered connections
within or across the DMN and the cerebellum may account for cognitive symptoms that are shared between major depression and schizophrenia. We interpret the lower connectivity in the cerebellum in the patients within this framework and hypothesize a relation to negative and/or cognitive symptoms in schizophrenia.
Some methodological differences between ASL and BOLD regarding DMN analysis have to be mentioned: because of its relatively slow sampling rate (TR = 3–8 s) and the fact that there is no time drift, ASL MR quali-fies optimally for the investigation of the slow-frequency oscillations of the DMN (~0.1 Hz). Compared with BOLD-fMRI, the larger fractional ASL signal change is an advantage regarding motion artifacts or subject insta-bility. For stimulations that take longer than 3 minutes,
and even shorter durations in less cooperative subjects, the instability in BOLD tends to render ASL a preferable technique.44 Therefore, the pCASL MR technique is
use-ful in studies of schizophrenia patients, in which move-ment artifacts often decrease the quality of the MR data. Furthermore, the ICA approach that was used in this study is a model-free approach, which, unlike ROI seed-based analyses, is not bound to a priori predictions.16 ICA
z scores represent the likelihood of a given voxel to be part of the network, similar to correlation values. Hence, voxels with high z scores also would have high correlation values amongst each other.52 Accordingly, higher z scores
can be interpreted as increased functional connectivity in the respective brain area within the whole network, thus a higher degree or probability of involvement in the net-work. The group differences indicate that in one group a specific area (cluster of voxels) is more involved (shows stronger functional connectivity) in a given network.38
In terms of our group differences, this indicates that the precuneus exhibits a stronger degree of functional con-nectivity in the schizophrenia patients than in the healthy subjects group. In summary, perfusion imaging provides additional information that is not available in standard BOLD sequences. Because studies of mean level of perfu-sion at rest were at the origin of the concept of the default network arising from PET studies,4 perfusion imaging
integrates older and newer approaches to achieve the study of the resting state in a single technique.45
The present study explored both a physiological brain measure (rCBF) and a brain functional network (DMN) in a sample of schizophrenia patients. The relationship between brain metabolism and functional connectivity may add important information to the understanding of this disease. Although recent studies53 demonstrated
a tight coupling between functional connectivity in the dorsal hub of the DMN and CBF in healthy individu-als, our data did not support the assumption that brain metabolism and the resting state are related in the schizo-phrenia sample. This difference might have been caused by differences in methodology, as the DMN was previ-ously computed based on BOLD data,53 whereas our
DMN calculation was derived from ASL data. However, here, schizophrenia patients, and not healthy individuals, were the focus of interest.
A limiting factor of this study was that patients received medication at the time of MR. As mentioned in “Methods” section, medication remained unchanged for at least 2 weeks prior to the study, and all patients showed positive symptoms at the time of MR measure-ment. An increase in rCBF in the striatum and caudate after the administration of antipsychotic medication has been reported,54 whereas—to the best of our
knowl-edge—changes in rCBF in the precuneus in response to antipsychotic treatment have not been shown before. Nevertheless, we cannot entirely rule out the possibil-ity that medication influenced the findings of this study.
However, to obtain maximum homogeneity of the sam-ple, only patients with stable medication status and psy-chopathology were included.
Some authors proposed the following hypothesis11,16:
for efficient deactivation of the DMN and, thus, the translation of cognitive processes from an internal to an external focus, the activity of the DMN must fall below a certain threshold or, inversely, the TiD must go beyond this threshold. This deactivation of the DMN is reflected in a decrease of the activity of the posterior hub of the DMN.44 Consequently, 2 possible sources of failure of
deactivation of the DMN are likely: reduced potential for the decrease of DMN activity relative to resting activity (comparable to a blood vessel disease causing decreased responsiveness)16 or absolute increase in DMN activity
during rest, reflected in increased CBF, without affecting the potential to decrease DMN activity. In both cases, the deactivation threshold is not reached. Because our data showed no elevation of CBF during rest, this study sup-ports the first hypothesis.
Supplementary Material
Supplementary material is available at http://schizophre
niabulletin.oxfordjournals.org.
Funding
Swiss National Science Foundation (SNSF: 32003B-112578 and 33CM30-124114) to T.D.
Acknowledgments
The authors have declared that there are no conflicts of interest in relation to the subject of this study.
References
1. Scheef L, Manka C, Daamen M, et al. Resting-state per-fusion in nonmedicated schizophrenic patients: a con-tinuous arterial spin-labeling 3.0-T MR study. Radiology. 2010;256:253–260.
2. Ingvar DH, Franzén G. Distribution of cerebral activity in chronic schizophrenia. Lancet. 1974;2:1484–1486.
3. Xu G, Rowley HA, Wu G, et al. Reliability and precision of pseudo-continuous arterial spin labeling perfusion MRI on 3.0 T and comparison with 15O-water PET in elderly subjects at risk for Alzheimer’s disease. NMR Biomed. 2010;23:286–293.
4. Raichle ME, MacLeod AM, Snyder AZ, Powers WJ, Gusnard DA, Shulman GL. A default mode of brain function. Proc
Natl Acad Sci U S A. 2001;98:676–682.
5. Biswal B, Yetkin FZ, Haughton VM, Hyde JS. Functional connectivity in the motor cortex of resting human brain using echo-planar MRI. Magn Reson Med. 1995;34:537–541. 6. Lowe MJ, Mock BJ, Sorenson JA. Functional connectivity in
single and multislice echoplanar imaging using resting-state fluctuations. Neuroimage. 1998;7:119–132.
7. Greicius MD, Krasnow B, Reiss AL, Menon V. Functional con-nectivity in the resting brain: a network analysis of the default mode hypothesis. Proc Natl Acad Sci U S A. 2003;100:253–258. 8. Greicius MD, Menon V. Default-mode activity during a pas-sive sensory task: uncoupled from deactivation but impacting activation. J Cogn Neurosci. 2004;16:1484–1492.
9. Jann K, Dierks T, Boesch C, Kottlow M, Strik W, Koenig T. BOLD correlates of EEG alpha phase-locking and the fMRI default mode network. Neuroimage. 2009;45:903–916.
10. Jann K, Kottlow M, Dierks T, Boesch C, Koenig T. Topographic electrophysiological signatures of FMRI Resting State Networks. PLoS One. 2010;5:e12945.
11. Northoff G, Qin P. How can the brain’s resting state activity generate hallucinations? A ‘resting state hypothesis’ of audi-tory verbal hallucinations. Schizophr Res. 2011;127:202–214. 12. Buckner RL, Andrews-Hanna JR, Schacter DL. The brain’s
default network: anatomy, function, and relevance to disease.
Ann N Y Acad Sci. 2008;1124:1–38.
13. Anticevic A, Gancsos M, Murray JD, et al. NMDA recep-tor function in large-scale anticorrelated neural systems with implications for cognition and schizophrenia. Proc Natl Acad
Sci U S A. 2012;109:16720–16725.
14. Jafri MJ, Pearlson GD, Stevens M, Calhoun VD. A method for functional network connectivity among spatially independ-ent resting-state componindepend-ents in schizophrenia. Neuroimage. 2008;39:1666–1681.
15. Frith C. The role of the prefrontal cortex in self-consciousness: the case of auditory hallucinations. Philos Trans R Soc Lond B
Biol Sci. 1996;351:1505–1512.
16. Whitfield-Gabrieli S, Ford JM. Default mode network activ-ity and connectivactiv-ity in psychopathology. Annu Rev Clin
Psychol. 2012;8:49–76.
17. Garrity AG, Pearlson GD, McKiernan K, Lloyd D, Kiehl KA, Calhoun VD. Aberrant “default mode” functional connectiv-ity in schizophrenia. Am J Psychiatry. 2007;164:450–457. 18. Vercammen A, Knegtering H, den Boer JA, Liemburg EJ,
Aleman A. Auditory hallucinations in schizophrenia are associated with reduced functional connectivity of the tem-poro-parietal area. Biol Psychiatry. 2010;67:912–918. 19. Bluhm RL, Miller J, Lanius RA, et al. Spontaneous
low-frequency fluctuations in the BOLD signal in schizophrenic patients: anomalies in the default network. Schizophr Bull. 2007;33:1004–1012.
20. Whitfield-Gabrieli S, Thermenos HW, Milanovic S, et al. Hyperactivity and hyperconnectivity of the default network in schizophrenia and in first-degree relatives of persons with schizophrenia. Proc Natl Acad Sci U S A. 2009;106:1279–1284. 21. Rotarska-Jagiela A, van de Ven V, Oertel-Knöchel V, Uhlhaas
PJ, Vogeley K, Linden DE. Resting-state functional network correlates of psychotic symptoms in schizophrenia. Schizophr
Res. 2010;117:21–30.
22. Skudlarski P, Jagannathan K, Anderson K, et al. Brain connectivity is not only lower but different in schizophre-nia: a combined anatomical and functional approach. Biol
Psychiatry. 2010;68:61–69.
23. Detre JA, Leigh JS, Williams DS, Koretsky AP. Perfusion imaging. Magn Reson Med. 1992;23:37–45.
24. Buxton RB, Frank LR, Wong EC, Siewert B, Warach S, Edelman RR. A general kinetic model for quantitative perfu-sion imaging with arterial spin labeling. Magn Reson Med. 1998;40:383–396.
25. Wong EC, Buxton RB, Frank LR. A theoretical and experi-mental comparison of continuous and pulsed arterial spin
labeling techniques for quantitative perfusion imaging. Magn
Reson Med. 1998;40:348–355.
26. Walther S, Federspiel A, Horn H, et al. Resting state cer-ebral blood flow and objective motor activity reveal basal ganglia dysfunction in schizophrenia. Psychiatry Res. 2011;192:117–124.
27. Homan P, Kindler J, Hauf M, Hubl D, Dierks T. Cerebral blood flow identifies responders to transcranial magnetic stim-ulation in auditory verbal hallucinations. Transl Psychiatry. 2012;2:e189.
28. Kindler J, Homan P, Jann K, et al. Reduced neuronal activ-ity in language-related regions after transcranial magnetic stimulation therapy for auditory verbal hallucinations. Biol
Psychiatry. 2013;73:518–524.
29. Orosz A, Jann K, Federspiel A, et al. Reduced cerebral blood flow within the default-mode network and within total gray matter in major depression. Brain Connect. 2012;2:303–310. 30. Jann K, Orosz A, Dierks T, Wang DJ, Wiest R, Federspiel A.
Quantification of network perfusion in ASL cerebral blood flow data with seed based and ICA approaches. Brain Topogr. 2013;26:569–580.
31. Kay SR, Opler LA, Lindenmayer JP. Reliability and validity of the positive and negative syndrome scale for schizophren-ics. Psychiatry Res. 1988;23:99–110.
32. Haddock G, McCarron J, Tarrier N, Faragher EB. Scales to measure dimensions of hallucinations and delusions: the Psychotic Symptom Rating Scales (PSYRATS). Psychol
Med. 1999;29:879–889.
33. Hoffman RE, Hawkins KA, Gueorguieva R, et al. Transcranial magnetic stimulation of left temporoparietal cortex and medication-resistant auditory hallucinations. Arch
Gen Psychiatry. 2003;60:49–56.
34. van der Gaag M, Hoffman T, Remijsen M, et al. The five-factor model of the Positive and Negative Syndrome Scale II: a ten-fold cross-validation of a revised model. Schizophr Res. 2006;85:280–287.
35. Dai W, Garcia D, de Bazelaire C, Alsop DC. Continuous flow-driven inversion for arterial spin labeling using pulsed radio frequency and gradient fields. Magn Reson Med. 2008;60:1488–1497.
36. Wu WC, Fernández-Seara M, Detre JA, Wehrli FW, Wang J. A theoretical and experimental investigation of the tagging efficiency of pseudocontinuous arterial spin labeling. Magn
Reson Med. 2007;58:1020–1027.
37. Federspiel A, Müller TJ, Horn H, Kiefer C, Strik WK. Comparison of spatial and temporal pattern for fMRI obtained with BOLD and arterial spin labeling. J Neural
Transm. 2006;113:1403–1415.
38. Calhoun VD, Adali T, Pearlson GD, Pekar JJ. A method for making group inferences from functional MRI data using independent component analysis. Hum Brain Mapp. 2001;14:140–151.
39. Calhoun VD, Adali T, Pekar JJ. A method for comparing group fMRI data using independent component analysis:
application to visual, motor and visuomotor tasks. Magn
Reson Imaging. 2004;22:1181–1191.
40. Simon AE, Cattapan-Ludewig K, Zmilacher S, et al. Cognitive functioning in the schizophrenia prodrome. Schizophr Bull. 2007;33:761–771.
41. Borgwardt S, McGuire P, Fusar-Poli P. Gray matters!–mapping the transition to psychosis. Schizophr Res. 2011;133:63–67. 42. Lutterveld RV, Diederen KM, Otte WM, Sommer IE.
Network analysis of auditory hallucinations in nonpsychotic individuals [published online ahead of print]. Hum Brain
Mapp. 2013. doi: 10.1002/hbm.22264.
43. Zou Q, Wu CW, Stein EA, Zang Y, Yang Y. Static and dynamic characteristics of cerebral blood flow during the resting state. Neuroimage. 2009;48:515–524.
44. Pfefferbaum A, Chanraud S, Pitel AL, et al. Cerebral blood flow in posterior cortical nodes of the default mode network decreases with task engagement but remains higher than in most brain regions. Cereb Cortex. 2011;21:233–244.
45. Viviani R, Messina I, Walter M. Resting state functional connectivity in perfusion imaging: correlation maps with BOLD connectivity and resting state perfusion. PLoS One. 2011;6:e27050.
46. Várkuti B, Cavusoglu M, Kullik A, et al. Quantifying the link between anatomical connectivity, gray matter volume and regional cerebral blood flow: an integrative MRI study. PLoS
One. 2011;6:e14801.
47. Li W, Antuono PG, Xie C, et al. Changes in regional cerebral blood flow and functional connectivity in the cholinergic pathway associated with cognitive performance in subjects with mild Alzheimer’s disease after 12-week donepezil treat-ment. Neuroimage. 2012;60:1083–1091.
48. Cavanna AE. The precuneus and consciousness. CNS Spectr. 2007;12:545–552.
49. Cavanna AE, Trimble MR. The precuneus: a review of its functional anatomy and behavioural correlates. Brain. 2006;129:564–583.
50. Northoff G, Bermpohl F. Cortical midline structures and the self. Trends Cogn Sci. 2004;8:102–107.
51. Chen YL, Tu PC, Lee YC, Chen YS, Li CT, Su TP. Resting-state fMRI mapping of cerebellar functional dysconnections involving multiple large-scale networks in patients with schiz-ophrenia. Schizophr Res. 2013;149:26–34.
52. McKeown MJ, Makeig S, Brown GG, et al. Analysis of fMRI data by blind separation into independent spatial compo-nents. Hum Brain Mapp. 1998;6:160–188.
53. Liang X, Zou Q, He Y, Yang Y. Coupling of functional con-nectivity and regional cerebral blood flow reveals a physio-logical basis for network hubs of the human brain. Proc Natl
Acad Sci U S A. 2013;110:1929–1934.
54. Handley R, Zelaya FO, Reinders AA, et al. Acute effects of single-dose aripiprazole and haloperidol on resting cerebral blood flow (rCBF) in the human brain. Hum Brain Mapp. 2013;34:272–282.