Sequence analysis
QuasR: quantification and annotation of short
reads in R
Dimos Gaidatzis
1,2,†, Anita Lerch
1,2,†,‡, Florian Hahne
3and
Michael B. Stadler
1,2,*
1
Friedrich Miescher Institute for Biomedical Research, Maulbeerstrasse 66, 4058 Basel, Switzerland,
2Swiss Institute of Bioinformatics, 4058 Basel, Switzerland and
3Novartis Institute for Biomedical Research,
CH-4057 Basel, Switzerland
*To whom correspondence should be addressed. Associate Editor: John Hancock
†
The authors wish it to be known that, in their opinion, the first two authors should be regarded as Joint First Authors.
‡
Present address: The Walter and Eliza Hall Institute of Medical Research, 1G Royal Parade, Parkville VIC 3052, Australia Received on August 25, 2014; revised on November 18, 2014; accepted on November 19, 2014
Abstract
Summary: QuasR is a package for the integrated analysis of high-throughput sequencing data in R,
covering all steps from read preprocessing, alignment and quality control to quantification. QuasR
supports different experiment types (including RNA-seq, ChIP-seq and Bis-seq) and analysis
vari-ants (e.g. paired-end, stranded, spliced and allele-specific), and is integrated in Bioconductor so
that its output can be directly processed for statistical analysis and visualization.
Availability and implementation: QuasR is implemented in R and C/Cþþ. Source code and binaries
for major platforms (Linux, OS X and MS Windows) are available from Bioconductor
(www.biocon-ductor.org/packages/release/bioc/html/QuasR.html). The package includes a ‘vignette’ with
step-by-step examples for typical work flows.
Contact: [email protected]
Supplementary information:
Supplementary data
are available at Bioinformatics online.
1 Introduction
High-throughput sequencing has become a powerful research tool in a wide range of applications, such as transcriptome profiling (RNA-seq), measurement of DNA-protein interactions or chromatin modi-fications (ChIP-seq) and DNA methylation (Bis-seq). In the last years, there have been many efforts to provide software in R/ Bioconductor (Gentleman et al., 2004) to simplify data processing and biological interpretation, such as an efficient framework for working with genomic ranges (Lawrence et al., 2013), or tools for read alignment (Liao et al., 2013), quality control (Morgan et al., 2009) and statistical analysis (Anders and Huber 2010;Robinson et al., 2010). It is however still challenging to conduct a complete analysis from raw data to a publishable result in the form of a single R script, which would greatly improve documentation and thus fa-cilitate the exchange of analysis details with coworkers. Often it is necessary to perform a subset of tasks outside of R, for example on
the operating system’s shell. Typically, the tools used in the analysis have to be downloaded and installed from distinct sources, and resolving software dependencies can be time-consuming or become a major obstacle for non-expert researchers trying to perform or re-produce an analysis.
Here, we introduce the Bioconductor package QuasR that aims to overcome these issues by abstracting many technical details of high-throughput sequencing data analysis. QuasR builds on top of the functionality provided by Bioconductor and external tools such as bowtie (Langmead et al., 2009) or SpliceMap (Au et al., 2010), and extends it to support additional analysis types, such as DNA methylation and allele-specific analysis. QuasR is available for all major platforms (Linux, OS X and MS Windows), and its output can be directly used for downstream analyses and visualization, thus allowing an uninterrupted workflow from raw data to scientific results.
VCThe Author 2014. Published by Oxford University Press.
This is an Open Access article distributed under the terms of the Creative Commons Attribution License (http://creativecommons.org/licenses/by/4.0/), which permits unrestricted reuse, distribution, and reproduction in any medium, provided the original work is properly cited. 1130
Bioinformatics, 31(7), 2015, 1130–1132 doi: 10.1093/bioinformatics/btu781 Advance Access Publication Date: 21 November 2014 Applications Note
2 Feature overview
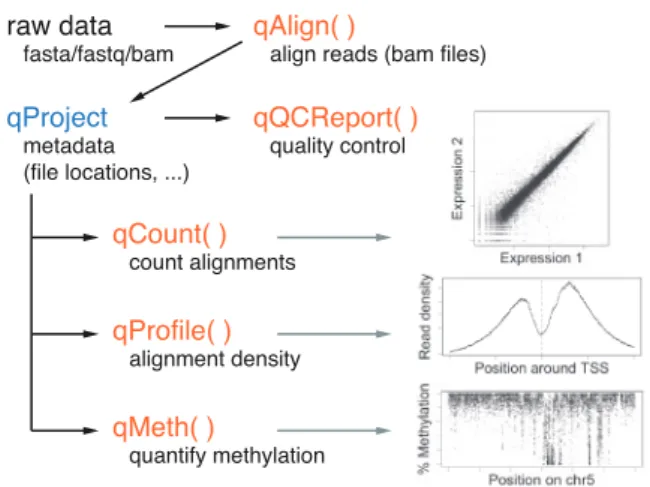
The user interface of QuasR consists of only a handful of functions (Fig. 1) and a single class (qProject) that is returned by qAlign and serves as input to all downstream processing.
By default, qAlign uses bowtie to align single or paired-end reads to a reference genome, and unmapped reads are optionally further aligned to alternative references, for example to quantify the level of vector contamination. For convenience, the genome can be obtained through Bioconductor (42 genome assemblies for 21 different spe-cies are available in release 2.14), in which case it is automatically downloaded and indexed if necessary. qAlign also supports spliced alignments and alignment of bisulfite-converted reads (both direc-tional und undirecdirec-tional bisulfite libraries). Pre-existing alignments in BAM format (Li et al., 2009) that have been generated outside of QuasR can be imported, thereby enabling the use of any alignment software and strategy that produces output in the supported format. Finally, qAlign stores metadata for all generated BAM files, includ-ing information about alignment parameters and checksums for gen-ome and short read sequences, allowing it to recognize pre-existing BAM files that will not have to be recreated.
qQCReport produces a set of quality control plots that allow as-sessment of the technical quality of sequencing data and alignments, and help to identify over-represented reads and libraries with a low sequence complexity.
qCount is the main function for quantification. It is used to count alignments in known genomic intervals (promoters, exons, genes, etc.) or in peak regions identified outside of QuasR. It avoids redundant counting of individual alignments (e.g. when combining transcripts from the same gene). qCount provides fine-grained con-trol over quantification, for example to include only alignments that are (anti-)sense to the query region, to select alignments based on mapping quality or to report counts for exon–exon junctions. The resulting count tables can be directly used for statistical analysis in dedicated packages (Anders and Huber, 2010; Robinson et al., 2010).
qProfile is similar to qCount, with the main difference that it re-turns a spatial profile of counts with the number of alignments at different positions relative to the query.
qMeth is used in Bis-seq experiments to obtain the numbers of methylated and unmethylated cytosines for selected sequence contexts.
For experimental systems with known heterozygous loci (for ex-ample an F1 cross between two divergent mouse inbred strains), QuasR allows to perform allele-specific analysis. In order to avoid alignment bias, qAlign will automatically inject the known single nucleotide variations into the reference genome to produce two new versions of that genome. The reads are aligned to both genomes, and the best alignment for each read is retained. The quantification of such allele-specific alignments by qCount, qProfile or qMeth pro-duces three instead of a single number per sample and query feature, corresponding to the alignment counts for reference and alternative alleles and the unclassifiable alignments. An alignment can be un-classifiable if the read (or both reads in a paired-end experiment) did not overlap with a known polymorphism.
All QuasR functions are designed to make use of the parallel package for parallel processing on computers with multiple cores or compute clusters.
The package vignette (available at http://www.bioconductor.org/ packages/release/bioc/vignettes/QuasR/inst/doc/QuasR.pdf) contains more details on QuasR functions, as well as step-by-step examples for typical analysis tasks. In addition, the supplementary online material provides QuasR code recipes illustrating the installation of the QuasR package, removal of adaptor sequences, quantification of RNA ex-pression and DNA methylation, as well as allele-specific analysis.
3 Conclusions
By abstracting technical details, QuasR greatly simplifies an analysis of high-throughput sequencing data and makes it accessible to a wider community. Already the installation of required software tools can be conveniently achieved from within R, irrespective of the compute platform. Furthermore, through its integration with the Bioconductor infrastructure, it is also possible to obtain genome se-quences and gene annotation in this manner, and the R packaging system provides a solid infrastructure to track and document the versions of both software and annotation that is used in a given ana-lysis, which is a prerequisite for reproducible research.
QuasR unites the preprocessing and alignment of raw sequence reads with the numerous downstream analysis tools available in Bioconductor and for the R environment, and enables well inte-grated, single-script workflows that document all steps of an ana-lysis and their parameters in a format that is simple to share and reproduce.
Acknowledgements
We acknowledge the Bioconductor core team and community for providing a great software environment. We thank Lukas Burger, Robert Ivanek, Hans-Rudolf Hotz and Christian Hundsrucker for discussions and feedback.
Funding
This work was supported by Sybit, the IT support project for SystemsX.ch (A.L.), the Novartis Research Foundation (D.G. and M.B.S.) and Novartis (F.H.).
Conflict of Interests: none declared.
References
Anders,S. and Huber,W. (2010) Differential expression analysis for sequence count data. Genome Biol., 11, R106.
Au,K.F. et al. (2010) Detection of splice junctions from paired-end RNA-seq data by SpliceMap. Nucleic Acids Res., 38, 4570–4578.
Fig. 1. QuasR consists of one class (qProject) and five main functions. Typical visualizations of the function outputs are shown as insets
Gentleman,R.C. et al. (2004) Bioconductor: open software development for computational biology and bioinformatics. Genome Biol., 5, R80. Langmead,B. et al. (2009) Ultrafast and memory-efficient alignment of short
DNA sequences to the human genome. Genome Biol., 10, R25.
Lawrence,M. et al. (2013) Software for computing and annotating genomic ranges. PLoS Comput Biol., 9, 1003118.
Li,H. et al. (2009) The Sequence Alignment/Map format and SAMtools. Bioinformatics, 25, 2078–2079.
Liao,Y. et al. (2013) The Subread aligner: fast, accurate and scalable read mapping by seed-and-vote. Nucleic Acids Res., 41, e108.
Morgan,M. et al. (2009) ShortRead: a bioconductor package for input, quality assessment and exploration of high-throughput sequence data. Bioinformatics, 25, 2607–2608.
Robinson,M.D. et al. (2010) edgeR: a Bioconductor package for differential expression analysis of digital gene expression data. Bioinformatics, 26, 139–140.