Characterization of actin genes in Bonamia ostreae and
their application to phylogeny of the Haplosporidia
I. LO´ PEZ-FLORES1*, V. N. SUA´ REZ-SANTIAGO2, D. LONGET3, D. SAULNIER1,
B. CHOLLET1and I. ARZUL1
1Laboratoire de Ge´ne´tique et Pathologie. Station La Tremblade, IFREMER. Avenue Mus de Loup, 17390 La
Tremblade, France
2
Department of Botany, Faculty of Sciences, University of Granada, Avenida Severo Ochoa s/n, 18071 Granada, Spain
3
Department of Zoology and Animal Biology, University of Geneva, Sciences III, 30 Quai Ernest Ansermet, CH 1211 Geneva 4, Switzerland
(Received 18 April 2007; revised 8 May and 14 June 2007; accepted 15 June 2007; first published online 3 August 2007)
S U M M A R Y
Bonamia ostreae is a protozoan parasite that infects the European flat oyster Ostrea edulis, causing systemic infections and resulting in massive mortalities in populations of this valuable bivalve species. In this work, we have characterized B. ostreae actin genes and used their sequences for a phylogenetic analysis. Design of different primer sets was necessary to amplify the central coding region of actin genes of B. ostreae. Characterization of the sequences and their amplification in different samples demonstrated the presence of 2 intragenomic actin genes in B. ostreae, without any intron. The phylogenetic analysis placed B. ostreae in a clade with Minchinia tapetis, Minchinia teredinis and Haplosporidium costale as its closest relatives, and demonstrated that the paralogous actin genes found in Bonamia resulted from a duplication of the original actin gene after the Bonamia origin.
Key words : Bonamia ostreae, Ostrea edulis parasite, actin gene, molecular phylogeny.
I N T R O D U C T I O N
Bonamia ostreae is a small-sized (2–3mm) protozoan parasite, responsible for bonamiosis, a haemocytic disease affecting the European flat oyster Ostrea edulis. In Europe, it was first described in France (Pichot et al. 1980) as the causative agent of serious mortalities in this native species. Since then, it has been responsible for a drastic decrease in O. edulis production in different farming areas along the European Atlantic coast (see review by Carnegie and Cochennec-Laureau, 2004). It has also been detected in O. edulis populations on the Pacific and Atlantic coasts of North America (Carnegie and Cochennec-Laureau, 2004 ; Marty et al. 2006). Other known and characterized species of the genus are B. exitiosa from O. chilensis in New Zealand and Chile, O. angasi in Australia, O. puelchana in Argentina, and Crassostrea ariakensis in North Carolina, USA (Campalans et al. 2000 ; Hine et al. 2001 ; Burreson et al. 2004 ; Kroeck and Montes, 2005 ; Corbeil et al. 2006) ; B. roughleyi (previously known as Mikrocytos roughleyi ; Carnegie and Cochennec-Laureau, 2004) in Saccostrea glo-merata in Australia (Farley et al. 1988) ; and
B. perspora in Ostreola equestris in North Carolina, USA (Carnegie et al. 2006).
Recent isolation of the gene coding for the small subunit of the ribosomal RNA in B. ostreae (18S or SSU rDNA) has clarified phylogenetic affinities of Bonamia species. Thus, after different taxonomic affiliations, analysis of SSU rRNA placed Bonamia within the Haplosporidia (Carnegie et al. 2000 ; Reece et al. 2004). Genes coding for proteins provide the possibility of performing phylogenetic analyses under a different evolutionary rate compared to those governing ribosomal genes. In this respect, actin has the advantage of being an ubiquitous protein in eu-karyotic cells and one of the most conserved
throughout evolution, from yeast to human
(Sheterline and Sparrow, 1994). Actin is a cytoskel-etal protein involved in cellular functions like maintaining cell morphology, cell motility and div-ision, and intracellular transport (Sheterline and Sparrow, 1994). Actin proteins are encoded by a multigene family in all organisms examined so far, except in yeast and in some alveolata where they are
encoded by one single gene (Hightower and
Meagher, 1986 ; Reece et al. 1997 ; Zhou et al. 2006). In other protozoans, like Plasmodium falciparum, Entamoeba histolytica, several species of foraminifera and the haplosporidians Haplosporidium louisiana, Minchinia chitonis, Minchinia teredinis and Minchinia tapetis, 2–4 actin genes have been described (Huber et al. 1987 ; Wesseling et al. 1988 ; Pawlowski et al. * Corresponding author : Present address : Laboratoire de
Ge´ne´tique et Pathologie, IFREMER. Avenue Mus de Loup, 17390 La Tremblade, France. Tel :+33 546762647. Fax :+33 546762611. E-mail: [email protected]
1999 ; Reece et al. 2004). The gene family differs in size among these organisms, and the number and location of introns within actin genes are variable (Hightower and Meagher, 1986 ; Reece et al. 2004 ; Flakowski et al. 2006).
This study reports, through the use of nucleotide and amino acid sequence analyses, the identification of at least 2 actin genes within Bonamia ostreae. Phylogenetic analyses were carried out to assess orthologous/paralogous relationships of the se-quences and to infer the phylogenetic position of B. ostreae within the Haplosporidia based on the actin gene sequences.
M A T E R I A L S A N D M E T H O D S
Samples and DNA extraction
Infected oysters (Ostrea edulis) were obtained by experimental infections. Healthy animals were in-jected with Bonamia ostreae cells previously purified (see below) from naturally infected oysters from Quiberon bay, Brittany (France) and maintained in a laboratory tank. This procedure allowed us to obtain highly infected oysters that were used for parasite purification. In parallel, non-injected oysters were used as negative control. Infections were confirmed by microscopical examination of tissue imprints and by PCR assay based on the 18S rDNA gene of the parasite, using primers Bo and BoAs (Cochennec et al. 2000).
Parasites were purified as described previously (Cochennec et al. 2000). About 50r106cells could be
obtained from each highly infected oyster. Cells were centrifuged at 12 000 g and pellets from several purifications were pooled and conserved atx20 xC. In addition, 2 samples (gill tissues fixed in 95 % ethanol) of O. chilensis from New Zealand infected with B. exitiosa were used as controls.
Genomic DNA from purified parasites and oyster gills was extracted according to the method of Winnepenninckx et al. (1993) using 2r108parasite
cells or 100 mg of oyster tissue. Integrity and quan-tity of DNA was measured by electrophoresis on agarose gel stained with ethidium bromide and spectrophotometry, respectively.
Amplification of actin genes by PCR
Different samples and sets of degenerate primers (4 forward primers were combined with 5 reverse ones) were used to amplify B. ostreae actin gene fragments. Two of these primer pairs were used previously for the amplification of actin genes in dinoflagellata and haplosporidia species (Reece et al. 1997, 2004), and in a rhizopod species (Longet et al. 2004). The remaining primers tested have been designed for this work based on alignment of conserved regions of actin protein (GenBank
Accession numbers : AY450412, AY450407,
AY450414, AY450416, AJ132374, AJ32375, J01016, D50839, AF057161, M86241, U84287, TGU10429, M19871, M19871). An available oyster actin se-quence (AAB81845) was also included to prevent amplification of the host gene. DNA from a non-infected O. edulis was used as control.
Amplification products were separated on 1 % agarose gels stained with ethidium bromide. Testing of all primer combinations showed that one forward primer (F) and 2 reverse primers (R1 and R2) al-lowed amplification of 2 putative B. ostreae se-quences (Fig. 1A). The reaction was carried out in a volume of 50ml with 2 mMMg2SO4, 0.2 mMof each
dNTP, 1mMof each primer, 1.5 U of Taq polymerase
(New England Biolabs) and 5–10 ng of DNA. Thermal cycling was 95 xC for 1 min, 40 cycles of 95 xC for 1 min, 50 xC for 1 min and 65 xC for 1 min, followed by 65 xC for 10 min.
Amplified products were cloned using TOPO vector system (Invitrogen) and the nucleotide se-quences were determined using an ABI Prism Dye Terminator Cycle Sequencing kit (Applied Biosystems) following the manufacturer’s re-commendations. Sequences were identified by com-parison with those included in the GenBank and EMBL databases using BLAST algorithm (Altschul et al. 1997).
Primer pairs BostAct1F/BostAct1R and
BostAct2F/BostAct2R were designed for indepen-dent amplification of Actin1 and Actin2 genes of B. ostreae based on the cloned sequences (Fig. 1A). Actin gene sequences from Ostrea edulis and Ostrea chilensis obtained during this work (recorded in GenBank with Accession numbers AM410916, AM410917 and AM410918) were aligned with B. ostreae sequences to ensure specificity of the pri-mers for B. ostreae actins. DNA from a non-infected Ostrea edulis and DNA from an O. chilensis highly infected with Bonamia exitiosa were used as controls. Amplification reactions were performed as described previously but increasing annealing and extension temperatures from 50 to 55 xC and 65 to 72 xC re-spectively. Identification of each sequence type, Actin1 and Actin2, was done by digestion of PCR product (PCR-RFLP) with the restriction enzyme BstUI (Promega). The reactions consisted of 16ml of PCR product, 2ml 10r Buffer and 5 U of enzyme in a final volume of 20ml.
Sequence and phylogenetic analyses
Phylogenetic analyses of the actin genes were per-formed using both nucleotide and amino acid sequences. Sequences used in the phylogenetic analyses from haplosporidian species were down-loaded from GenBank (Haplosporidium costale, AY450407 ; H. louisiana, AY450411 ; H. nelsoni,
M. tapetis, AY450417 ; M. terenidis, AY450420 ;
Urosporidium crescens, AY450422). Sequences
from foraminiferan species Reticulomyxa filosa
(AJ132374), Ammonia sp. (AJ132372) and
Allogromia sp. (AJ132370) and the Cercozoa
Cercomonas sp. (AF363534) were chosen as outgroup according to the results obtained by Reece et al. (2004). Multiple sequence alignment was done using the program MEGALIN of the DNAstar package (LASERGEN) by Clustal method and revised by eye. Phylogenetic analyses were performed with the program PAUP* version 4.0b10 (Swofford, 2003) using the maximum parsimony criterion. Parsimony analysis involved heuristic searches. Data matrices were subjected to 1000 replicates of random se-quence additions using tree bisection-reconnection branch-swapping. In the protein analysis the characters were considered as unordered states with equal weight, while in the nucleotide analysis the third nucleotide of each codon was downweighted. Gaps were treated as missing data and the ambiguous regions in the alignment were deleted from the analysis. The starting tree was obtained by stepwise
addition. The characters were optimized by
accelerated transformation. Finally, 1000 bootstrap replicates (Felsenstein, 1985) with 10 heuristic searches were performed to assess internal support for nodes.
R E S U L T S
Sequence characterization
Two major actin gene fragments, different in size, could be obtained by combining 1 forward with 2 reverse primers in different PCR reactions using DNA of purified B. ostreae. They were 869 bp and 784 bp in length. The shorter one was similar to the larger one except on the 3k end 85 nucleotides (Fig.
1B). Comparison with sequences included in
GenBank and EMBL data-bases by BLAST allowed identification of partial actin DNA fragments, cor-responding to the central region of the gene. These sequences were named Actin1 (BoAct1, 869 bp) and Actin2 (BoAct2, 784 bp).
Three cloned sequences per actin sequence
type were obtained (Fig. 2A). The GenBank Accession numbers are AM410919-AM410921 and AM410922-AM410924. Excluding primer sites, the
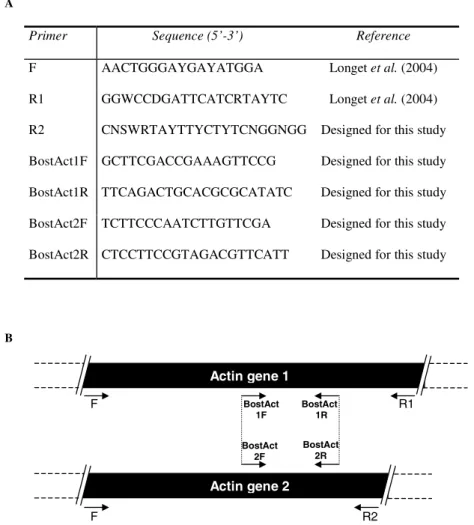
Primer Sequence (5’-3’) Reference
F AACTGGGAYGAYATGGA Longet et al. (2004)
R1 GGWCCDGATTCATCRTAYTCC Longet et al. (2004)
R2 CNSWRTAYTTYCTYTCNGGNGG Designed for this study
BostAct1F GCTTCGACCGAAAGTTCCG Designed for this study
BostAct1R TTCAGACTGCACGCGCATATCC Designed for this study
BostAct2F TCTTCCCAATCTTGTTCGA Designed for this study
BostAct2R CTCCTTCCGTAGACGTTCATTT Designed for this study
A B BostAct 1R BostAct 2R BostAct 1F BostAct 2F F R1 Actin gene 1 F R2 Actin gene 2
Fig. 1. Primer description (A) and schematic representation of the genes that encode for actin in Bonamia ostreae (B). Arrows indicate approximate locations of the primers used for PCR amplifications. Primers BostAct1F/R and BostAct2F/R, designed after amplification of Actin1 with primers F/R1 and Actin 2 with primers F/R2, amplify a 264 bp fragment of Actin1 and Actin2 genes.
sequence to be compared was 745 bp in length. Intra-type variability between clones was low, and esti-mated at 5 nucleotides between Actin1 sequences and
1 between Actin2 sequences (Fig. 2A). Three of the 5 sites corresponded to non-synonymous changes with respect to deduced Actin1 amino acid sequence
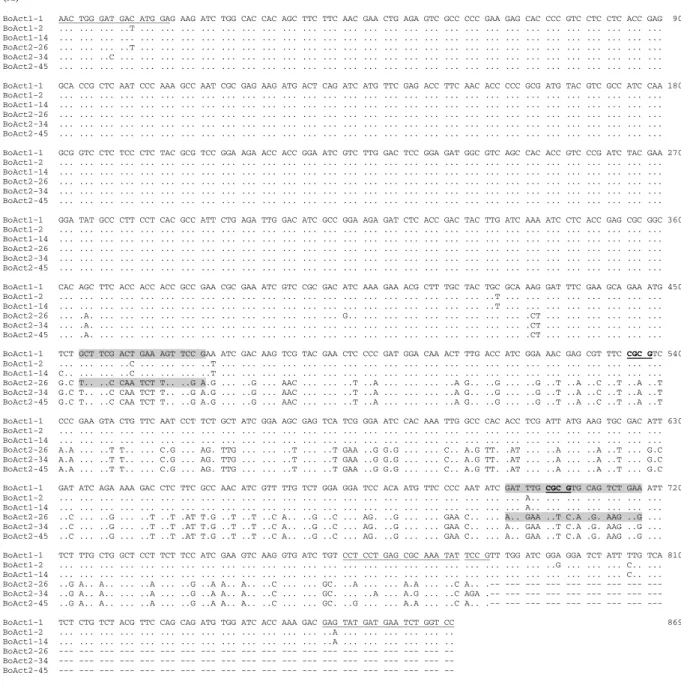
(A)
BoAct1-1 AAC TGG GAT GAC ATG GAG AAG ATC TGG CAC CAC AGC TTC TTC AAC GAA CTG AGA GTC GCC CCC GAA GAG CAC CCC GTC CTC CTC ACC GAG 90 BoAct1-2 ... ... ... ..T ... ... ... ... ... ... ... ... ... ... ... ... ... ... ... ... ... ... ... ... ... ... ... ... ... ... BoAct1-14 ... ... ... ... ... ... ... ... ... ... ... ... ... ... ... ... ... ... ... ... ... ... ... ... ... ... ... ... ... ... BoAct2-26 ... ... ... ..T ... ... ... ... ... ... ... ... ... ... ... ... ... ... ... ... ... ... ... ... ... ... ... ... ... ... BoAct2-34 ... ... ..C ... ... ... ... ... ... ... ... ... ... ... ... ... ... ... ... ... ... ... ... ... ... ... ... ... ... ... BoAct2-45 ... ... ... ... ... ... ... ... ... ... ... ... ... ... ... ... ... ... ... ... ... ... ... ... ... ... ... ... ... ... BoAct1-1 GCA CCG CTC AAT CCC AAA GCC AAT CGC GAG AAG ATG ACT CAG ATC ATG TTC GAG ACC TTC AAC ACC CCC GCG ATG TAC GTC GCC ATC CAA 180 BoAct1-2 ... ... ... ... ... ... ... ... ... ... ... ... ... ... ... ... ... ... ... ... ... ... ... ... ... ... ... ... ... ... BoAct1-14 ... ... ... ... ... ... ... ... ... ... ... ... ... ... ... ... ... ... ... ... ... ... ... ... ... ... ... ... ... ... BoAct2-26 ... ... ... ... ... ... ... ... ... ... ... ... ... ... ... ... ... ... ... ... ... ... ... ... ... ... ... ... ... ... BoAct2-34 ... ... ... ... ... ... ... ... ... ... ... ... ... ... ... ... ... ... ... ... ... ... ... ... ... ... ... ... ... ... BoAct2-45 ... ... ... ... ... ... ... ... ... ... ... ... ... ... ... ... ... ... ... ... ... ... ... ... ... ... ... ... ... ... BoAct1-1 GCG GTC CTC TCC CTC TAC GCG TCC GGA AGA ACC ACC GGA ATC GTC TTG GAC TCC GGA GAT GGC GTC AGC CAC ACC GTC CCG ATC TAC GAA 270 BoAct1-2 ... ... ... ... ... ... ... ... ... ... ... ... ... ... ... ... ... ... ... ... ... ... ... ... ... ... ... ... ... ... BoAct1-14 ... ... ... ... ... ... ... ... ... ... ... ... ... ... ... ... ... ... ... ... ... ... ... ... ... ... ... ... ... ... BoAct2-26 ... ... ... ... ... ... ... ... ... ... ... ... ... ... ... ... ... ... ... ... ... ... ... ... ... ... ... ... ... ... BoAct2-34 ... ... ... ... ... ... ... ... ... ... ... ... ... ... ... ... ... ... ... ... ... ... ... ... ... ... ... ... ... ... BoAct2-45 ... ... ... ... ... ... ... ... ... ... ... ... ... ... ... ... ... ... ... ... ... ... ... ... ... ... ... ... ... ... BoAct1-1 GGA TAT GCC CTT CCT CAC GCC ATT CTG AGA TTG GAC ATC GCC GGA AGA GAT CTC ACC GAC TAC TTG ATC AAA ATC CTC ACC GAG CGC GGC 360 BoAct1-2 ... ... ... ... ... ... ... ... ... ... ... ... ... ... ... ... ... ... ... ... ... ... ... ... ... ... ... ... ... ... BoAct1-14 ... ... ... ... ... ... ... ... ... ... ... ... ... ... ... ... ... ... ... ... ... ... ... ... ... ... ... ... ... ... BoAct2-26 ... ... ... ... ... ... ... ... ... ... ... ... ... ... ... ... ... ... ... ... ... ... ... ... ... ... ... ... ... ... BoAct2-34 ... ... ... ... ... ... ... ... ... ... ... ... ... ... ... ... ... ... ... ... ... ... ... ... ... ... ... ... ... ... BoAct2-45 ... ... ... ... ... ... ... ... ... ... ... ... ... ... ... ... ... ... ... ... ... ... ... ... ... ... ... ... ... ... BoAct1-1 CAC AGC TTC ACC ACC ACC GCC GAA CGC GAA ATC GTC CGC GAC ATC AAA GAA ACG CTT TGC TAC TGC GCA AAG GAT TTC GAA GCA GAA ATG 450 BoAct1-2 ... ... ... ... ... ... ... ... ... ... ... ... ... ... ... ... ... ... ... ... ... ..T ... ... ... ... ... ... ... ... BoAct1-14 ... ... ... ... ... ... ... ... ... ... ... ... ... ... ... ... ... ... ... ... ... ..T ... ... ... ... ... ... ... ... BoAct2-26 ... .A. ... ... ... ... ... ... ... ... ... ... ... ... G.. ... ... ... ... ... ... ... ... .CT ... ... ... ... ... ... BoAct2-34 ... .A. ... ... ... ... ... ... ... ... ... ... ... ... ... ... ... ... ... ... ... ... ... .CT ... ... ... ... ... ... BoAct2-45 ... .A. ... ... ... ... ... ... ... ... ... ... ... ... ... ... ... ... ... ... ... ... ... .CT ... ... ... ... ... ... BoAct1-1 TCT GCT TCG ACT GAA AGT TCC GAA ATC GAC AAG TCG TAC GAA CTC CCC GAT GGA CAA ACT TTG ACC ATC GGA AAC GAG CGT TTC CGC GTC 540 BoAct1-2 ... ... ... ..C ... ... ... ..T ... ... ... ... ... ... ... ... ... ... ... ... ... ... ... ... ... ... ... ... ... ... BoAct1-14 C.. ... ... ..C ... ... ... ..T ... ... ... ... ... ... ... ... ... ... ... ... ... ... ... ... ... ... ... ... ... ... BoAct2-26 G.C T.. ..C CAA TCT T.. ..G A.G ... ..G ... AAC ... ... ..T ..A ... ... ... ..A G.. ..G ... ..G ..T ..A ..C ..T ..A ..T BoAct2-34 G.C T.. ..C CAA TCT T.. ..G A.G ... ..G ... AAC ... ... ..T ..A ... ... ... ..A G.. ..G ... ..G ..T ..A ..C ..T ..A ..T BoAct2-45 G.C T.. ..C CAA TCT T.. ..G A.G ... ..G ... AAC ... ... ..T ..A ... ... ... ..A G.. ..G ... ..G ..T ..A ..C ..T ..A ..T BoAct1-1 CCC GAA GTA CTG TTC AAT CCT TCT GCT ATC GGA AGC GAG TCA TCG GGA ATC CAC AAA TTG GCC CAC ACC TCG ATT ATG AAG TGC GAC ATT 630 BoAct1-2 ... ... ... ... ... ... ... ... ... ... ... ... ... ... ... ... ... ... ... ... ... ... ... ... ... ... ... ... ... ... BoAct1-14 ... ... ... ... ... ... ... ... ... ... ... ... ... ... ... ... ... ... ... ... ... ... ... ... ... ... ... ... ... ... BoAct2-26 A.A ... ..T T.. ... C.G ... AG. TTG ... ... ..T ... ..T GAA ..G G.G ... ... C.. A.G TT. .AT ... ..A ... ..A ..T ... G.C BoAct2-34 A.A ... ..T T.. ... C.G ... AG. TTG ... ... ..T ... ..T GAA ..G G.G ... ... C.. A.G TT. .AT ... ..A ... ..A ..T ... G.C BoAct2-45 A.A ... ..T T.. ... C.G ... AG. TTG ... ... ..T ... ..T GAA ..G G.G ... ... C.. A.G TT. .AT ... ..A ... ..A ..T ... G.C BoAct1-1 GAT ATC AGA AAA GAC CTC TTC GCC AAC ATC GTT TTG TCT GGA GGA TCC ACA ATG TTC CCC AAT ATC GAT TTG CGC GTG CAG TCT GAA ATT 720 BoAct1-2 ... ... ... ... ... ... ... ... ... ... ... ... ... ... ... ... ... ... ... ... ... ... ... A.. ... ... ... ... ... ... BoAct1-14 ... ... ... ... ... ... ... ... ... ... ... ... ... ... ... ... ... ... ... ... ... ... ... A.. ... ... ... ... ... ... BoAct2-26 ..C ... ..G ... ..T ..T .AT T.G ..T ..T ..C A.. ..G ..C ... AG. ..G ... ... GAA C.. ... A.. GAA ..T C.A .G. AAG ..G ... BoAct2-34 ..C ... ..G ... ..T ..T .AT T.G ..T ..T ..C A.. ..G ..C ... AG. ..G ... ... GAA C.. ... A.. GAA ..T C.A .G. AAG ..G ... BoAct2-45 ..C ... ..G ... ..T ..T .AT T.G ..T ..T ..C A.. ..G ..C ... AG. ..G ... ... GAA C.. ... A.. GAA ..T C.A .G. AAG ..G ... BoAct1-1 TCT TTG CTG GCT CCT TCT TCC ATC GAA GTC AAG GTG ATC TGT CCT CCT GAG CGC AAA TAT TCC GTT TGG ATC GGA GGA TCT ATT TTG TCA 810 BoAct1-2 ... ... ... ... ... ... ... ... ... ... ... ... ... ... ... ... ... ... ... ... ... ... ... ... ..G ... ... ... C.. ... BoAct1-14 ... ... ... ... ... ... ... ... ... ... ... ... ... ... ... ... ... ... ... ... ... ... ... ... ... ... ... ... C.. ... BoAct2-26 ..G A.. A.. ... ..A ... ..G ..A A.. A.. ..C ... ... GC. ..A ... ... A.A ... ..C A.. .-- --- --- --- --- --- --- --- --- BoAct2-34 ..G A.. A.. ... ..A ... ..G ..A A.. A.. ..C ... ... GC. ... ..A ... A.G ... ..C AGA .-- --- --- --- --- --- --- --- --- BoAct2-45 ..G A.. A.. ... ..A ... ..G ..A A.. A.. ..C ... ... GC. ..G ... ... A.A ... ..C A.. .-- --- --- --- --- --- --- --- --- BoAct1-1 TCT CTG TCT ACG TTC CAG CAG ATG TGG ATC ACC AAA GAC GAG TAT GAT GAA TCT GGT CC 869 BoAct1-2 ... ... ... ... ... ... ... ... ... ... ... ... ... ..A ... ... ... ... ... .. BoAct1-14 ... ... ... ... ... ... ... ... ... ... ... ... ... ..A ... ... ... ... ... .. BoAct2-26 --- --- --- --- --- --- --- --- --- --- --- --- --- --- --- --- --- --- --- -- BoAct2-34 --- --- --- --- --- --- --- --- --- --- --- --- --- --- --- --- --- --- --- -- BoAct2-45 --- --- --- --- --- --- --- --- --- --- --- --- --- --- --- --- --- --- --- -- (B)
Bonamia ostreae Actine1 NWDDMEKIWHHSFFNELRVAPEEHPVLLTEAPLNPKANREKMTQIMFETFNTPAMYVAIQAVLSLYASGRTTGIVLDSGDGVSHTVPIYE 90 Bonamia ostreae Actine2 ... Bonamia ostreae Actine1 GYALPHAILRLDIAGRDLTDYLIKILTERGHSFTTTAEREIVRDIKETLCYCAKDFEAEMSASTESSEIDKSYELPDGQTLTIGNERFRV 180 Bonamia ostreae Actine2 ...N...T...AS.QSC.K.E.N...V... Bonamia ostreae Actine1 PEVLFNPSAIGSESSGIHKLAHTSIMKCDIDIRKDLFANIVLSGGSTMFPNIDLRVQSEISLLAPSSIEVKVICPPERKYSVWIGGSILS 270 Bonamia ostreae Actine2 T....Q..L...E.V...TFN...V...YS...M...EH.NE.LRK...MM...KIN..A...T--- Bonamia ostreae Actine1 SLSTFQQMWITKDEYDESG 289 Bonamia ostreae Actine2 ---
Fig. 2. Sequences alignment of Bonamia ostreae actin genes 1 and 2. (A) Nucleotide sequences corresponding to cloned actin sequences Type 1 (BostAct1) and Type 2 (BostAct2). Last numeric values indicate the recombinant E. coli clones. Dots (.) indicate identical bases. Locations of degenerate forward primer (position 1–17) and reverse ones (763–784 and 850–869) are underlined. Locations of specific primers for each actin gene type (BostAct1F and 2F, position 454–472, and BostAct1R and 2R, position 697–717) are highlighted in grey. Recognition sites for restriction enzyme BstUI (CG^CG) in Type 1 sequences are showed in bold and underlined (cut sites : positions 537 and 705). (B) Inferred amino acid sequences corresponding to protein Actin 1 and Actin 2. Dots (.) indicate identical residue.
(TCT coding S to CCT coding P, GAT coding D to GAA coding E, and ATG coding M to TTG coding L at positions 451, 474 and 700 respectively). The variable site of Actin2 partial sequences corre-sponded also to a non-synonymous change (ATC coding I to GTC coding V at position 403) (Fig. 2B). Nucleotide sequence type 1 and type 2 (Actin1 and Actin2) demonstrated 83.7 % identity. Variable positions were mainly located in the second half of the sequences (Fig. 2A). These variable positions (108 in total) usually corresponded to the third position of the codons (58) while 33 and 17 variable sites corresponded to the second and the first codon positions respectively. No gene intron was identified when sequences were aligned with homologous actin genes.
Encoded amino acid sequences of these 2 actin gene fragments (289 and 261 amino acid residues for Actin1 and Actin2 respectively) showed a full
length open reading frame and demonstrated
87.2 % sequence identity. The first 121 amino acid residues were identical between the sequences and corresponded to identical nucleotide sequences (Fig. 2B).
In order to determine if sequence types, Actin1 and Actin2, corresponding to actin genes belong to B. ostreae genome, a variable region of nucleotide sequences was used to design primers for amplifi-cation of Actin1 and Actin2 sequences in different isolates (BostAct1F/BostAct1R and BostAct2F/ BostAct2R respectively, see Fig. 2A). Both primer pairs amplified the expected 264 bp product when DNA of the parasite purified from 4 different nat-urally infected oysters (O. edulis) was used as tem-plate. The different sequence types were determined by digestion of PCR products with the restriction enzyme BstUI (PCR-RFLP). Actin2 sequences had no recognition site for this enzyme while Actin1 sequences contained 2 of them, yielding, after digestion of the 264 bp amplicon, 3 fragments of 13, 83 and 168 bp. Figure 3 shows differential band patterns obtained by PCR-RFLP. Both types of sequences could be easily identified in the 4 different DNAs from B. ostreae purified cells, while no amplification was obtained for oyster DNA either healthy Ostrea edulis or O. chilensis infected with B. exitiosa.
Phylogeny based on actin genes
Alignment of all 17 actin gene nucleotide sequences (all B. ostreae actin gene sequences, 7 of haplospor-idian, and the 4 outgroup sequences) resulted in a 1113 bp matrix (after excluding ambiguous regions). Of the 1113 characters 416 were parsimony-informative (285 in the ingroup). Phylogenetic analysis based on nucleotide sequences produced 3 most-parsimonious trees of 3377 steps in length (CI : 0.585 ; RI : 0.595 ; HI : 0.415), which differ only in the
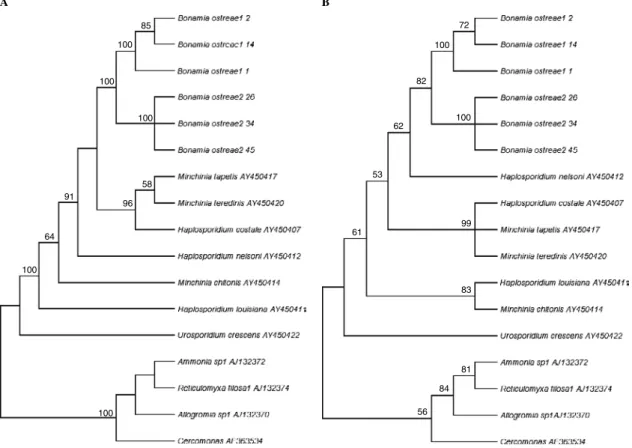
relationships between the Actin2 sequences of B. ostreae. Figure 4A shows the strict consensus tree that coincides with one of the most-parsimonious trees. The tree shows that Bonamia ostreae Actin1 and Actin2 were paralogous sequences to each other, and orthologous to the remaining haplosporidian actin gene sequences (Fig. 4A). B. ostreae actin genes clustered together with 100 % bootstrap support (Fig. 4A), and this grouping remained when the multiple haplosporidian paralogous sequences de-scribed by Reece and co-workers (Reece et al. 2004) were included in an overall analysis (data not shown). B. ostreae appeared to be a sister clade to that formed
by Minchinia tapetis and M. teredinis and
Haplosporidium costale. Both Haplosporidium and Minchinia genera were paraphyletic. Urosporidum crecens was the basal species of the haplosporidians.
Alignment of all 17 protein sequences resulted in a 370 amino acid matrix (excluding an ambiguous region), from which 84 were parsimony-informative (65 in the ingroup). Phylogenetic analysis using the protein sequences yielded 4 most-parsimonious trees of 329 steps in length (CI : 0.796 ; RI : 0.765 ; HI : 0.204), which differ only in the relationships between the Actin2 sequences of B. ostreae, and also in the relationships between H. costale, M. tapetis and M. teredinis. The strict consensus tree is shown in Fig. 4B. The main difference of this tree with respect to the nucleotide tree (Fig. 4A) was the closer re-lationship of B. ostreae with H. nelsoni instead of with
200 bp
1 2 3 4 5 6 7 8 9 10 11 12 13
Actin Type 1 Actin Type 2 400 bp
Controls
Fig. 3. Detection of a polymorphism involving BstUI restriction sites in Bonamia ostreae actin gene sequences. DNA from 4 different B. ostreae samples (purified parasite) independently amplified with primers BostAct1F/R (Actin Type 1) and BostAct2F/R (Actin Type 2) yielded amplicons 264 bp in length. After digestion with BstUI, 2 RFLP profiles were observed : a no-digested 264 bp band in Actin2 sequences (lanes 6 to 9) and bands of 168+83 bp for Actin1 sequences (lanes 2 to 5 ; the third expected band of 13 bp can not be observed in the gel). Lanes 1 and 10 correspond to the molecular weight marker (Smart Ladder SF,
Eurogentec). Negative controls were non-infected Ostrea edulis DNA (lane 11), DNA from O. chilensis highly infected with B. exitiosa (lane 12) and no-DNA water control (lane 13).
the clade consisting of M. tapetis, M. teredinis and H. costale.
D I S C U S S I O N
Two actin genes in the genome of Bonamia ostreae Amplification by PCR using ‘ universal ’ primers of unknown genes from non-cultivable eukaryotic parasites like Bonamia ostreae is a difficult aim. Conserved or ‘ universal ’ primers are mostly de-signed from higher organism sequences and fre-quently amplified host DNA (always present in the samples) instead of parasite DNA. Combination of conserved primers and primers designed using se-quences from related organisms, and the use of DNA from Ostrea edulis and from O. chilensis infected with B. exitiosa as separate controls, allowed us to amplify actin genes in B. ostreae. Characterization of ampli-fied products allowed the identification of 2 sequence types encoding 2 proteins. Both types were identical at the amino terminal end. Variable positions were mainly located at third codon positions with decreasing proportions at second and first codon positions. Deduced amino acid sequences of Actin1 and Actin2 were about 13 % divergent, a relatively high value for actin proteins encoded by genes from the same species (Hightower and Meagher, 1986).
Nevertheless, higher divergence values could be observed between both actin paralogues described in species of the related foraminiferan phylum, 16 % in Reticulomyxa filosa, 17 % in Ammonia sp. and 18 % in Allogromia sp. (personal observations. based on sequences analysed by Pawlowski et al. 1999). In the apicomplexa Plasmodium falciparum, actin protein sequences showed 21 % sequence divergence and were considered extremely divergent (Wesseling et al. 1988).
Altogether these data suggested that 2 paralogous actin genes are present in the genome of B. ostreae. The absence of amplification from non-infected oyster and a sister species (B. exitiosa) DNAs, the comparison with O. edulis sequences and the ampli-fication by PCR of both sequence types in different B. ostreae samples from different origins demon-strated that both types of sequences corresponded to B. ostreae genes and not to actin genes from different species (the host, other parasites, algae, etc.), coding for 1 actin protein each. The 2 actin gene fragments of B. ostreae reported in this study represent the first
protein-encoding sequences obtained for any
Bonamia species. Isolation and characterization of new genes or loci of its genome is of great interest in order to create a molecular data-base for this parasite, as exists for other protozoans, useful for further research. A B 85 100 100 100 58 96 91 64 100 100 72 100 100 82 62 83 99 53 61 56 84 81
Fig. 4. Parsimony analysis based on actin gene sequences showing the paralogy of Bonamia ostreae sequences obtained in this study. Numbers at nodes indicate percentage support of 1000 bootstrap replicates (bootstrap support values below 50 are not presented). Phylogeny was performed using (A) nucleotide sequences and (B) translated amino acid sequences.
Actin phylogeny
PCR amplification and sequencing analysis sug-gested that there were at least 2 actin genes in the genome of B. ostreae and phylogenetic analysis supported this assumption. Both types of actin gene sequences obtained in this study (Actin1 and Actin2) grouped together on the basis of nucleotide and amino acid sequences when trees were inferred using orthologous sequences from species belonging to the genera Haplosporidium, Minchinia and Urosporidium, as well as when their paralogous se-quences were included in the analysis. This result suggests that the two Actin1 and Actin2 nucleotide sequences are the result of a gene duplication event (resulting in 2 paralogous loci) in B. ostreae after differentiation from the common ancestor. Within haplosporidians, multiple paralogues are present in species of the genus Minchinia, while Haplosporidium genus includes species, like H. nelsoni and H. costale in which only a single type of actin gene has been amplified by PCR until now. Many of these se-quences were found to contain introns, and genes with introns as well as single intronless actin genes were established to be orthologous (Reece et al. 2004). In B. ostreae at least 2 paralogous actin genes without introns exist. Gain of introns in actin sequences throughout evolution has been described in the group of foraminifera (Flakowski et al. 2006), and this could be applied to the haplosporidian sequences to explain the existence of paralogous genes in some species containing different numbers of introns.
Actin phylogeny based on amino acid sequences placed Haplosporidium nelsoni as the closest species to B. ostreae, in a sister clade to that formed by Haplosporidium costale, Minchinia tapetis and Minchinia teredinis. In the nucleotide based tree, this topology is reversed since B. ostreae is more closely related to the clade of H. costale-M. tapetis and M. teredinis than to H. nelsoni, although the bootstrap support was low. Minchinia and Haplosporidium resulted as paraphyletic genera in both analyses. Our results are similar to those previously obtained using actin gene sequences (Reece et al. 2004). Phylogeny based on a small subunit of ribosomal gene performed by these authors allowed to include more haplospor-idian species in the analysis and therefore they described more precisely the ingroup relationships. The genus Bonamia showed closest relationship to the genus Minchinia, which appeared mono-phyletic on the basis of ribosomal gene sequence. Characterization of actin genes in the remaining haplosporidian species and subsequent analysis may clarify the discrepancies between actin and 18S phylogenies concerning the relationships between Bonamia, Minchinia and Haplosporidium genera, and also provide a wider knowledge of relationships within the group.
This research was supported by the European Community Reference Laboratory for diseases of molluscs and by
a postdoctoral fellowship (IFAPA, Consejerı´a de
Innovacio´n, Ciencia y Empresa de la Junta de Andalucı´a, Spain) to I. Lo´pez-Flores. We thank Dr M. A. Garrido-Ramos for critical review of the manuscript. We also thank our colleague S. Corbeil for revising our English text.
R E F E R E N C E S
Altschul, S. F., Madden, T. L., Schaffer, A. A., Zhang, J., Zhang, Z., Miller, W. and Lipman, D. J. (1997). Gapped BLAST and PSI-BLAST : a new generation of protein data base search programs. Nucleic Acids Research25, 3389–3402. doi : 10.1093/nar/ 25.17.3389.
Burreson, E. M., Stokes, N. A., Carnegie, R. B. and Bishop, M. J. (2004). Bonamia sp. (Haplosporidia) found in nonnative oysters Crassostrea ariakensis in Bogue Sound, North Carolina. Journal of Aquatic Animal Health16, 1–9. doi : 10.1577/H03-008.1. Campalans, M., Rojas, P. and Gonza´ lez, M. (2000).
Haemocytic parasitosis in the farmed oyster Tiostrea chilensis. Bulletin of the European Association of Fish Pathologists20, 31–33.
Carnegie, R. B., Barber, B. J., Culloty, S. C., Figueras, A. J. and Distel, D. L. (2000). Development of a PCR assay for detection of the oyster pathogen Bonamia ostreae and support for its inclusion in the
Haplosporidia. Diseases of Aquatic Organisms42, 199–206.
Carnegie, R. B., Burreson, E. M., Hine, M., Stokes, N. A., Audemard, C., Bishop, M. J. and Peterson, C. H. (2006). Bonamia perspora n. sp. (Haplosporidia), a parasite of the oyster Ostreola equestris, is the first Bonamia species known to produce spores. The Journal of Eukaryotic Microbiology53, 232–245. doi : 10.1111/ j.1550-7408.2006.00100.X.
Carnegie, R. B. and Cochennec-Laureau, N. (2004). Microcell parasites of oysters : Recent insights and future trends. Aquatic Living Resources17, 519–528. doi : 10.1051/alr :2004055.
Cochennec, N., Le Roux, F., Berthe, F. and Gerard, A. (2000). Detection of Bonamia ostreae based on small subunit ribosomal probe. Journal of Invertebrate Pathology76, 26–32. doi : 10.1006/jipa.2000.4939. Corbeil, S., Arzul, I., Robert, M., Berthe, F. C. J.,
Besnard-Cochennec, N. and Crane, M. St. J. (2006). Molecular characterisation of an Australian isolate of Bonamia exitiosa. Diseases of Aquatic Organisms71, 81–85.
Farley, C. A., Wolf, P. H. and Elston, R. (1988). A long-term study of ‘‘ microcell ’’ disease in oysters with a description of a new genus, Mikrocytos (g. n.), and two new species, Mikrocytos mackini (sp. n.) and Mikrocytos roughleyi (sp. n.). Fishery Bulletin86, 581–593.
Felsenstein, J. (1985). Confidence limits on phylogenies : an approach using the bootstrap. Evolution39, 783–791. Flakowski, J., Bolivar, I., Fahrni, J. and Pawlowski, J.
(2006). Tempo and mode of spliceosomal intron evolution in actin of Foraminifera. Journal of Molecular Evolution63, 30–41. doi : 10.1007/s00239-005-0061-z.
Hightower, R. C. and Meagher, R. B. (1986). The molecular evolution of actin. Genetics114, 315–332. Hine, P. M., Cochennec-Laureau, N. and Berthe, F. C. (2001). Bonamia exitiosa n. sp. (Haplosporidia) infecting flat oysters, Ostrea chilensis, in New Zealand. Diseases of Aquatic Organisms47, 63–72.
Huber, M., Garfinkel, L., Gitler, C., Mirelman, D., Revel, M. and Rozenblatt, S. (1987). Entamoeba histolytica : cloning and characterization of actin cDNA. Molecular and Biochemical Parasitology24, 227–235. doi : 10.1016/0166-6851(87)90154-X.
Kroeck, M. A. and Montes, J. (2005). Occurrence of the haemocyte parasite Bonamia sp. in flat oysters Ostrea puelchana farmed in San Antonio Bay (Argentina). Diseases of Aquatic Organisms63, 231–235.
Longet, D., Burki, F., Flakowski, J., Berney, C., Polet, S., Fahrni, J. and Pawlowski, J. (2004). Multigene evidence for close evolutionary relations between Gromia and Foraminifera. Acta Protozoologica43, 303–311.
Marty, G. D., Bower S. M., Clarke, K. R., Meyer, G., Lowe, G., Osborn, A. L., Chow, E. P., Hannah, H., Byrne, S., Sojonky, K. and Robinson, J. H. (2006). Histopatology and real time PCR assay for detection of Bonamia ostrea in Ostrea edulis cultured in western Canada. Aquaculture261, 33–42. doi : 10.1016/j.aqua-culture.2006.07.024.
Pawlowski, J., Bolivar, I., Fahrni, J., de Vargas, C. and Bowser, S. S. (1999). Naked foraminiferans revealed. Nature, London399, 27. doi : 10.1038/19881.
Pichot, Y., Comps, M., Tige´, G., Grizel, H. and Rabouin, M. A. (1980). Recherche sur Bonamia ostreae gen. n., sp. n., parasite nouveau de l’huıˆtre plate Ostrea edulis L. Revue des Travaux de l’Institut des Peˆches Maritimes43, 131–140.
Reece, K., Siddall, M. E., Burreson, E. M. and Graves, J. E. (1997). Phylogenetic analysis of Perkinsus based on actin gene sequences. Journal of Parasitology83, 417–423.
Reece, K., Siddall, M. E., Stokes, N. A. and Burreson, E. M. (2004). Molecular phylogeny of the Haplosporidia based on two independent gene sequences. Journal of Parasitology90, 1111–1122. doi : 10.1645/GE-102R. Sheterline, P. and Sparrow, J. C. (1994). Actin. Protein
Profile1, 1–121.
Swofford, D. L. (2003) PAUP*. Phylogenetic Analysis using Parsimony (*and other Methods), Version 4. Sinauer Associates, Sunderland, Massachusetts, USA.
Wesseling, J. G., Smits, M. A. and Schoenmakers, J. G. G. (1988). Extremely diverged actin proteins in Plasmodium falciparum. Molecular and Biochemical Parasitology30, 143–154. doi : 10.1016/
0166–6851(88)90107-7.
Winnepenninckx, B., Backeljau, T. and de Wachter, R. (1993). Extraction of high molecular weight DNA from molluscs. Trends in Genetics9, 407. doi : 10.1016/ 0168-9525(93)90102-N.
Zhou, J., Huang, B., Suzuki, H., Fujisaki, K., Igarashi, I. and Xuan, X. (2006). Isolation and identification of an actin gene from Babesia gibsoni. Journal of