PHARMACOLOGY AND CELL METABOLISM
Alterations of Homocysteine Serum Levels during Alcohol Withdrawal Are Influenced by Folate and
Riboflavin: Results from the German Investigation on Neurobiology in Alcoholism (GINA)
Peter Heese1, Michael Linnebank1,2, Alexander Semmler2, Marc A.N. Muschler3, Annemarie Heberlein3, Helge Frieling3,Birgit Stoffel-Wagner4, Johannes Kornhuber5, Markus Banger1, Stefan Bleich3and Thomas Hillemacher3,*
1
Department of Addiction and Psychotherapy, LVR-Clinic Bonn, Bonn, Germany,2Department of Neurology, University Hospital Zürich, Zürich, Switzerland,3Center for Addiction Research, Department of Psychiatry, Social Psychiatry and Psychotherapy, Hannover Medical School, Carl-Neuberg-Str. 1,
30625 Hannover, Germany,4Department of Clinical Chemistry and Clinical Pharmacology, University Bonn, Bonn, Germany and5Department of Psychiatry and Psychotherapy, University Hospital Friedrich-Alexander University, Erlangen, Germany
*Corresponding author: Tel.: +49-5115326561; Fax: +49-5115322415; E-mail: hillemacher.thomas@mh-hannover.de (Received 5 January 2012; first review notified 24 February 2012; in revised form 5 April 2012; accepted 16 April 2012) Abstract — Aims: Various studies have shown that plasma homocysteine (HCY) serum levels are elevated in actively drinking alcohol-dependent patients a during alcohol withdrawal, while rapidly declining during abstinence. Hyperhomocysteinemia has been associated not only with blood alcohol concentration (BAC), but also with deficiency of different B-vitamins, particularly folate, pyridoxine and cobalamin. Methods: Our study included 168 inpatients (110 men, 58 women) after admission for detoxification treatment. BAC, folate, cobalamin, pyridoxine, thiamine and riboflavin were obtained on admission (Day 1). HCY was assessed on Days 1, 7 and 11. Results: HCY levels significantly declined during withdrawal. General linear models and linear regression analysis showed an influence of BAC, folate and riboflavin on the HCY levels on admission as well as on HCY changes occurring during alcohol withdrawal. No significant influence was found for thiamine, cobalamin and pyridoxine. Conclusions: These findings show that not only BAC and plasma folate levels, but also plasma levels of riboflavin influence HCY plasma levels in alcohol-dependent patients.
INTRODUCTION
Homocysteine (HCY) metabolism is known to be fundamen-tally altered during alcohol intoxication and withdrawal (Bleich et al., 2000b,2004,2005). This has been shown for alcohol-dependent patients, but also—to a lesser extent—for social drinkers (Bleich et al., 2001). HCY levels found in alcohol-dependent patients tend to be much higher than the common cut-off levels for HCY, defined in a study of
Ubbink et al. (1995) as 11.7μmol/l or in a different investi-gation as 11.4μmol/l for male and 10.4 μmol/l for female subjects (Selhub et al., 1999).
The amino acid HCY is known to increase glutamatergic neurotransmission via activation of the N-methyl-D-aspartate (NMDA)-receptor of the glutamatergic system (Bleich et al., 2004; Bleich and Hillemacher, 2009). Elevated HCY levels lead to neurodegeneration and have been associated—inter alia—with vascular diseases and brain atrophy (Sachdev, 2004; Wilhelm et al., 2008). During alcohol withdrawal neurotransmission via the (up-regulated) NMDA-receptors is not longer blocked by ethanol, resulting in an extensive over-stimulation by HCY-associated NMDA-receptor agonism. This extensive glutamatergic reaction has been assumed to be the neurobiological background of the association between elevated HCY levels and the higher risk of alcohol withdraw-al seizures (Bleich et al., 2000a,2006;Bayerlein et al., 2005;
Hillemacher et al., 2007). Furthermore, elevated HCY levels have been found to correlate with short-term cognition defi-cits during alcohol withdrawal (Wilhelm et al., 2006) as well as long-term cerebral atrophy (Bleich et al., 2003).
This increase in HCY levels in alcohol-dependent patients is based on the direct effects of ethanol (Bleich et al., 2000b,
2005) as well as an alcohol-associated deficiency of folate (vitamin B9), cobalamin (vitamin B12) and pyridoxine (vitamin B6) (Majumdar et al., 1982; Cravo and Camilo,
2000;Bleich et al., 2004;Chen et al., 2011). Folate and 5-methyltetrahydrofolate are substrates for the remethylation of HCY to methionine via the action of the methionine synthase (Moat et al., 2003;Bleich et al., 2004), cobalamin acts as a cofactor for methionine synthase. Riboflavin is a precursor of flavin adenine dinucleotide (FAD), which is a coenzyme of methylenetetrahydrofolate reductase (MTHFR) (Moat et al., 2003). Pyridoxine acts as a cofactor for cystathionine-β-synthase (CBS), responsible for transsul-phuration of HCY into cystathionine (Bleich et al., 2004). Thiamine has been supposed to act on the HCY metabolism via enhancing the oxidative decarboxylation in the trans-amination of methionine (Franken et al., 1996). The rele-vance of B-vitamine intake on HCY levels has been shown in numerous studies (Konstantinova et al., 2007).
The present study was performed to validate previous find-ings investigating alterations of HCY serum levels during alcohol withdrawal in a large population of alcohol-dependent patients and to study the role of the B-vitamins involved in HCY metabolism in the pathogenesis of alcohol-associated hyperhomocysteinemia.
SUBJECTS AND METHODS
The present study was part of the German Investigation on Neurobiology in Alcoholism (GINA). All patients were recruited from the Department of Addiction and Psychotherapy of the hospital ‘Rheinische Kliniken’ in Bonn, Germany. Written informed consent was obtained from all 363 patients (251 men, 112 women). In a subsample of serial patients, we performed a prospective approach, obtaining data on Days 1, Day 7 and Day 11 after admission for detoxification treatment. This subsample was used in the present analysis, consisting of 168 patients (110 men, 58
Alcohol and Alcoholism Vol. 47, No. 5, pp. 497–500, 2012 doi: 10.1093/alcalc/ags058
Advance Access Publication 29 May 2012
women). All procedures were approved by the local ethics committee of the University of Bonn, Germany (Nr. 024/07), and were in accordance with the Helsinki Declaration of 1975, as revised in 1983. All participants suffered from alcohol dependency according to ICD-10 and were included in the study on admission for alcohol detoxification. Patients were mainly detoxified using clomethiazole following a symptom-triggered regime using the Banger-Score (Banger et al., 1992). If, for clinical reasons, clomethiazole could not be used, benzodiazepines were administered. Patients suffer-ing from dependence of other substances except alcohol and nicotine were excluded from the study.
Laboratory measurements
Fasting blood samples were obtained on Day 1 (admission), 7 and 11 of detoxification treatment. Blood samples were centrifuged and consecutive serum and lithium heparin plasma samples were stored at −80°C directly after collec-tion. HCY was assessed at all three time points while vitamin serum levels were obtained at admission.
Plasma total HCY concentrations were measured by means of particle-enhanced immunonephelometry with a Dimension Vista™ system according to the manufacturer’s instructions (Siemens Healthcare Diagnostics, Eschborn, Germany). The reference interval given by Siemens Healthcare Diagnostics was 4.9–15.0 µmol/l. Serum vitamin B12 and folate concen-trations were measured by means of a homogenous, competi-tive chemiluminescent immunoassay based on the LOCI™ technology with a Dimension Vista™ system (Siemens Healthcare Diagnostics). Reference intervals given by Siemens Healthcare Diagnostics were 3.1–17.5 ng/ml for folate and 254–1320 pg/ml for cobalamin.
Serum alcohol concentration was measured by means of an enzymatic test (alcohol dehydrogenase method) with a Dimension Vista™ system (Siemens Healthcare Diagnostics). Blood concentrations of thiamine, riboflavin and pyridox-ine were analyzed using commercially available high-per-formance liquid chromatography (HPLC) assays (Chromsystems Instruments & Chemicals GmbH, Munich, Germany) on an HPLC system with a fluorescence detector (Agilent, Series 1200, Agilent, Waldbronn, Germany). Reference intervals given by Chromsystems were 66.5–200 nnmol/l for thiamine, 174–471 nmol/l for riboflavin and 8.7– 27.3 µg/l for pyridoxine.
Statistical assessment
Results are presented as mean + SD or SE. Variables were normally distributed as tested using the Kolmogorov– Smirnov test. Linear regression models and general linear models for repeat measurements were used to test the influ-ence of different variables on HCY levels. Significance level (P-value) was set <0.05.
Data were analyzed using IBM SPSS Statistics 19.0 and Graph Pad PrismTM 5.0 (Graph Pad Software Inc., San Diego, CA, USA).
RESULTS
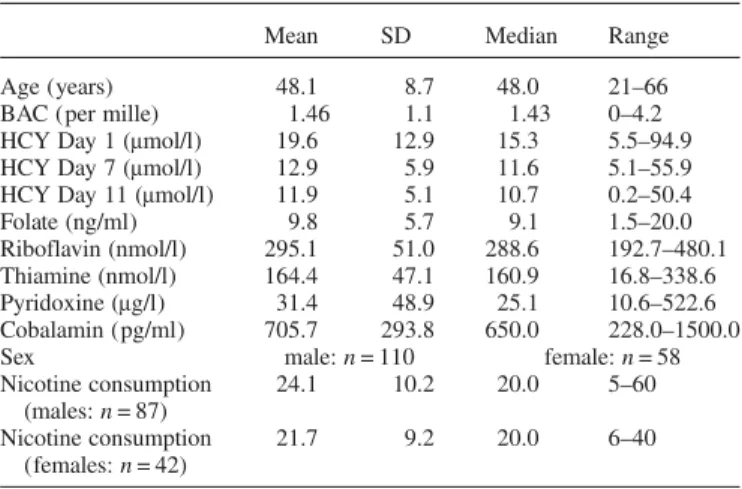
Demographic characteristics of the study population are given in Table1. Very few patients suffered from a definitive
B-vitamin deficiency (two patient presented folate defi-ciency, one patient thiamine defidefi-ciency, yet none of the other included B-vitamins).
Pearson’s correlation analysis showed significant results for HCY and folate (r =−0.48, P < 0.001), HCY and ribofla-vin (r =−0.28, P < 0.001) as well as for HCY and cobalamin (r =−0.21, P = 0.005). HCY and thiamine as well as HCY and pyridoxine were not significantly correlated.
Statistical analysis using general linear models for repeat measurements showed that HCY levels decline rapidly during alcohol withdrawal (F = 45.28, P < 0.001), with significant differences between all time points (Day 1/7: P < 0.001; Day 1/11: P < 0.001; Day 7/11: P < 0.001; Fig.1). A multivariate linear regression model showed that HCY serum levels on Day 1 of alcohol withdrawal are significantly influenced by blood alcohol concentration (BAC) on admission (B = 1.60,
Table 1. Demographic characteristics of the study population
Mean SD Median Range
Age (years) 48.1 8.7 48.0 21–66
BAC (per mille) 1.46 1.1 1.43 0–4.2
HCY Day 1 (μmol/l) 19.6 12.9 15.3 5.5–94.9
HCY Day 7 (μmol/l) 12.9 5.9 11.6 5.1–55.9
HCY Day 11 (μmol/l) 11.9 5.1 10.7 0.2–50.4
Folate (ng/ml) 9.8 5.7 9.1 1.5–20.0
Riboflavin (nmol/l) 295.1 51.0 288.6 192.7–480.1
Thiamine (nmol/l) 164.4 47.1 160.9 16.8–338.6
Pyridoxine (μg/l) 31.4 48.9 25.1 10.6–522.6
Cobalamin (pg/ml) 705.7 293.8 650.0 228.0–1500.0
Sex male: n = 110 female: n = 58
Nicotine consumption (males: n = 87) 24.1 10.2 20.0 5–60 Nicotine consumption (females: n = 42) 21.7 9.2 20.0 6–40
SD, standard deviation; BAC, blood alcohol concentration at admission; HCY, homocysteine serum levels, measured at Day 1, 7 or 11 after admission for in-patients detoxification treatment.
Vitamin levels were measured at admission. Nicotine consumption given as smoked cigarettes per day.
Fig. 1. Decrease of homocysteine serum levels during alcohol withdrawal. Box plot showing the changes of homocysteine plasma levels during withdrawal. Box represents 25–75 percentile and whiskers represent 5–95 percentile. Bar represents median and cross represents mean. Homocysteine plasma levels decreased significantly during the course of withdrawal.
Statistical details are summarized in Results section.
T = 2.30, P = 0.022), folate (B =−0.75, T = −5.47, P < 0.001) and riboflavin (B =−0.06, T = −3.44, P = 0.001), but not by thiamine, pyridoxine or cobalamin serum levels. Correlation analysis revealed no significant association between folate and riboflavin levels (r = 0.119, P = 0.121). To test which factors influence the changes of HCY levels over time (Days 1, 7 and 11), we performed a general linear model computing BAC and vitamin levels as covariates. We found a significant interaction between HCY changes over time and BAC on ad-mission (F = 4.80, P = 0.009), folate serum levels on admis-sion (F = 7.02, P = 0.001) and riboflavin serum levels on admission (F = 3.228, P = 0.042), but not with other tested variables (thiamine, pyridoxine or cobalamin). Including the interaction between folate and riboflavin and omitting thia-mine, pyridoxine and cobalamin results did not relevantly differ regarding the influence of thiamine, riboflavin and BAC on changes of HCY over time without showing a sig-nificant effect of the interaction (folate/riboflavin: F = 1.56, P = 0.214).
Comparing the subgroups of patients with high (HCY >15.35μmol/l, n = 84) and low (HCY ≤15.36 μmol/l, n = 84) HCY serum levels at admission, t-test for independent samples revealed that the high-HCY group also showed sig-nificantly elevated HCY levels on Day 7 (T = 6.4, P < 0.001) and elevated HCY levels on Day 11 (T = 6.0, P < 0.0001) as well as reduced folate (T =−6.3, P < 0.001), riboflavin (T = −2.7, P = 0.008) and pyridoxine (T = −2.1, P = 0.039) serum levels at admission.
Additionally, we performed the described linear regression analysis separately for both genders. This analysis showed a significant influence on HCY serum levels in male patients for folate (B =−0.78, T = −5.16, P < 0.001) and riboflavin (B =−0.05, T = −3.01, P = 0.003) but not for BAC, thiamine, pyridoxine and cobalamin. In female patients, the analysis showed a significant influence on HCY for folate (B =−0.74, T =−2.61, P = 0.012) and BAC (B = 3.52, T = 2.27, P = 0.028), not for any of the other included variables.
Furthermore, we compared smoking and non-smoking patients at the time of inclusion into the study. Using the pre-viously described linear regression analysis, the results show a significant influence on HCY levels at Day 1 for folate (B =−0.67, T = −2.41, P = 0.22), thiamine (B = 0.07, T = 2.14, P = 0.40) and riboflavine (B =−0.09, T = −2.25, P = 0.032) in the group of non-smoking patients (n = 39) and a significant finding for folate (B =−0.76, T = 0–4.54, P < 0.001), ribofla-vine (B =−0.5, T = −2.5, P = 0.013) and BAC (B = 2.04, T = 2.33, P = 0.021) in the smokers’ group (n = 129)
DISCUSSION
The present investigation confirms previous observations that reported elevated HCY levels in patients with alcohol depend-ence undergoing detoxification treatment. As shown previ-ously, on the time of admission the extent of the HCY serum levels depends significantly on BAC (Bleich et al., 2000b,
2005). However, apart from BAC, serum levels of riboflavin and folate also showed a significant influence on HCY serum levels at admission (Day 1), at least in the male subgroup. The same result was found when general linear model analysis was performed, analyzing the effect of BAC and B-vitamins on the changes of HCY during withdrawal.
Interestingly, cobalamin and pyridoxine showed no signifi-cant influence on HCY. The same results were found when comparing patients according to nicotine consumption and gender. This result is in line with previous studies showing a specific importance of folate and riboflavin supplementation on HCY serum levels in healthy volunteers (Ganji and Kafai, 2004; Araki et al., 2006), which may also depend on the MTHFR genotype (Chuang et al., 2006). Recently, riboflavin has also been studied as dietary supplement during pregnancy showing an effect on maternal HCY levels but not on orofa-cial clefts in the offspring (Vujkovic et al., 2010). However, riboflavin, which, to our knowledge, has not been studied in the context of alcohol-associated hyperhomocysteinemia before, showed a significant impact on HCY levels, which did not depend on its interaction with folate. Riboflavin is a precursor of various flavin coenzymes, particularly of FAD, which is a coenzyme of MTHFR (Moat et al., 2003). Substituted by FAD MTHFR catalyses 5,10-methylenetetrafo-late to 5-methylenetetrafo5,10-methylenetetrafo-late, which is of importance as a donor of methyl groups for remethylation of HCY (Moat et al., 2003). Accordingly, MTHFR activity is reduced in ribloflavin-deficient rats (Bates and Fuller, 1986).
It is surprising and difficult to interpret that we found no interaction between riboflavin and folate in our patient group. In further studies, it may be interesting to include analysis of FAD, which we did not perform in our study but which is the active coenzyme in the folate-dependent MTHFR metabolism (Hustad et al., 2002;Jacques et al., 2002).
However, the present work suffers from several limita-tions: first, an influence of withdrawal medication with ben-zodiazepines and possibly also with clomethiazole on HCY levels cannot be ruled out and was recently stated in a clinic-al study (Pompeia et al., 2009). The lack measurements of vitamin serum level on Day 7 and 11 must also be consid-ered a limitation. Furthermore, the lack of an association between cobalamin and pyridoxine and HCY in the regres-sion analysis is surprising. This may be explained at least partially by the wide variations in both vitamin serum levels. Overall, our results show that, apart from individual BAC, folate and riboflavin plasma levels on admission contribute to HCY elevation in alcohol-dependent patients. This effect was not only shown at the beginning of in-patient treatment but also regarding the decline of HCY during the withdrawal period. Noteworthy, only a negligible number of patients suf-fered from a definite B-vitamin deficiency. Thus, the present findings support the hypothesis that a supplementation of folate and riboflavin may be useful in alcohol-dependent patients during active drinking as well as detoxification and that currently used reference values for B-vitamins may need to be adjusted for alcohol-dependent patients.
Funding — We thank ERAB (European Foundation for Alcohol Research; former European Research Advisory Board) for supporting this study (grant number EA 07 04) and the Support of the Center for Clinical Research (‘Zentrum für Klinische Forschung’, M.L.).
REFERENCES
Araki R, Maruyama C, Igarashi S et al. (2006) Effects of short-term folic acid and/or riboflavin supplementation on serum folate and plasma total homocysteine concentrations in young Japanese male subjects. Eur J Clin Nutr 60:573–9.
Banger M, Philipp M, Herth T et al. (1992) Development of a rating scale for quantitative measurement of the alcohol withdrawal syn-drome. Eur Arch Psychiatry Clin Neurosci 241:241–6.
Bates CJ, Fuller NJ. (1986) The effect of riboflavin deficiency on methylenetetrahydrofolate reductase (NADPH) (EC 1.5.1.20) and folate metabolism in the rat. Br J Nutr 55:455–64.
Bayerlein K, Hillemacher T, Reulbach U et al. (2005)
Alcoholism-associated hyperhomocysteinemia and previous
withdrawal seizures. Biol Psychiatry 57:1590–3.
Bleich S, Hillemacher T. (2009) Homocysteine, alcoholism and its molecular networks. Pharmacopsychiatry 42(Suppl 1):S102–9. Bleich S, Degner D, Bandelow B et al. (2000a) Plasma
homocyst-eine is a predictor of alcohol withdrawal seizures. Neuroreport 11:2749–52.
Bleich S, Degner D, Wiltfang J et al. (2000b) Elevated homocyst-eine levels in alcohol withdrawal. Alcohol Alcohol 35:351–4. Bleich S, Bleich K, Kropp S et al. (2001) Moderate alcohol
consump-tion in social drinkers raises plasma homocysteine levels: a contra-diction to the‘French Paradox’? Alcohol Alcohol 36:189–92.
Bleich S, Bandelow B, Javaheripour K et al. (2003)
Hyperhomocysteinemia as a new risk factor for brain shrinkage in patients with alcoholism. Neurosci Lett 335:179–82.
Bleich S, Degner D, Sperling W et al. (2004) Homocysteine as a neurotoxin in chronic alcoholism. Prog Neuropsychopharmacol Biol Psychiatry 28:453–64.
Bleich S, Carl M, Bayerlein K et al. (2005) Evidence of increased homocysteine levels in alcoholism: the Franconian alcoholism research studies (FARS). Alcohol Clin Exp Res 29:334–6. Bleich S, Bayerlein K, Hillemacher T et al. (2006) An assessment
of the potential value of elevated homocysteine in predicting alcohol-withdrawal seizures. Epilepsia 47:934–8.
Chen YL, Yang SS, Peng HC et al. (2011) Folate and vitamin B12
improved alcohol-induced hyperhomocysteinemia in rats.
Nutrition 27:1034–9.
Chuang CZ, Boyles A, Legardeur B et al. (2006) Effects of ribofla-vin and folic acid supplementation on plasma homocysteine levels in healthy subjects. Am J Med Sci 331:65–71.
Cravo ML, Camilo ME. (2000) Hyperhomocysteinemia in chronic alcoholism: relations to folic acid and vitamins B(6) and B(12) status. Nutrition 16:296–302.
Franken DG, Blom HJ, Boers GH et al. (1996) Thiamine (vitamin B1) supplementation does not reduce fasting blood homocyst-eine concentration in most homozygotes for homocystinuria. Biochim Biophys Acta 1317:101–4.
Ganji V, Kafai MR. (2004) Frequent consumption of milk, yogurt, cold breakfast cereals, peppers, and cruciferous vegetables and intakes of dietary folate and riboflavin but not vitamins B-12 and B-6 are inversely associated with serum total homocysteine concentrations in the US population. Am J Clin Nutr 80:1500–7.
Hillemacher T, Frieling H, Bayerlein K et al. (2007) Biological markers to predict previous alcohol withdrawal seizures: a risk assessment. J Neural Transm 114:151–4.
Hustad S, McKinley MC, McNulty H et al. (2002) Riboflavin, flavin mononucleotide, and flavin adenine dinucleotide in human plasma and erythrocytes at baseline and after low-dose riboflavin supplementation. Clin Chem 48:1571–7.
Jacques PF, Kalmbach R, Bagley PJ et al. (2002) The relationship between riboflavin and plasma total homocysteine in the Framingham Offspring cohort is influenced by folate status and the C677T transition in the methylenetetrahydrofolate reductase gene. J Nutr 132:283–8.
Konstantinova SV, Vollset SE, Berstad P et al. (2007) Dietary
pre-dictors of plasma total homocysteine in the Hordaland
Homocysteine Study. Br J Nutr 98:201–10.
Majumdar SK, Shaw GK, O’Gorman P et al. (1982) Blood vitamin status (B1, B2, B6, folic acid and B12) in patients with alcoholic liver disease. Int J Vitam Nutr Res 52:266–71.
Moat SJ, Ashfield-Watt PA, Powers HJ et al. (2003) Effect of ribo-flavin status on the homocysteine-lowering effect of folate in
re-lation to the MTHFR (C677T) genotype. Clin Chem
49:295–302.
Pompeia S, Grego BH, Pradella-Hallinan M et al. (2009) Acute benzodiazepine administration induces changes in homocysteine metabolism in young healthy volunteers. Prog Neuropsycho pharmacol Biol Psychiatry 33:933–8.
Sachdev P. (2004) Homocysteine, cerebrovascular disease and brain atrophy. J Neurol Sci 226:25–9.
Selhub J, Jacques PF, Rosenberg IH et al. (1999) Serum total homocysteine concentrations in the third National Health and Nutrition Examination Survey (1991–1994): population refer-ence ranges and contribution of vitamin status to high serum concentrations. Ann Intern Med 131:331–9.
Ubbink JB, Becker PJ, Vermaak WJ et al. (1995) Results of
B-vitamin supplementation study used in a prediction model to define a reference range for plasma homocysteine. Clin Chem 41:1033–7.
Vujkovic M, Steegers EA, van Meurs J et al. (2010) The maternal homocysteine pathway is influenced by riboflavin intake and MTHFR polymorphisms without affecting the risk of orofacial clefts in the offspring. Eur J Clin Nutr 64:266–73.
Wilhelm J, Bayerlein K, Hillemacher T et al. (2006) Short-term cognition deficits during early alcohol withdrawal are associated with elevated plasma homocysteine levels in patients with alco-holism. J Neural Transm 113:357–63.
Wilhelm J, Frieling H, von Ahsen N et al. (2008) Apolipoprotein E polymorphism, homocysteine serum levels and hippocampal volume in patients with alcoholism: an investigation of a gene-environment interaction. Pharmacogenomics J 8:117–21.
![[PDF] TD/TP Packet Tracer Réseau n°3 | Formation informatique](data:image/gif;base64,R0lGODlhAQABAIAAAP///wAAACH5BAEAAAAALAAAAAABAAEAAAICRAEAOw==)