Short communication
Evaluation of role of concentration and molecular weight of oat
b-glucan in determining effect of viscosity on plasma glucose and
insulin following an oral glucose load
P. J. Wood
1*, M. U. Beer
2and G. Butler
31
Agriculture and Agri-Food Canada, Southern Crop Protection and Food Research Centre, 93 Stone Road West, Guelph, Ontario, N1G 2W1 Canada
2
Novartis Nutrition Research AG, CH-3176 Neuenegg, Switzerland
3Agriculture and Agri-Food Canada, Eastern Cereal and Oilseed Research Centre, Ottawa, Ontario, K1A 0C6 Canada
(Received 17 May 1999 – Revised 28 October 1999 – Accepted 25 January 2000)
Data from clinical studies established that there was an inverse linear relationship between measures of postprandial blood glucose and insulin responses to an oral glucose load, consumed in a drink, and the logarithm of viscosity of the drink. These data have been re-analysed using concentration and molecular weight as the dependent variables. Molecular weight (M) of the b-glucans used was determined using high-performance size exclusion chromatography equipped with a triple detector system of right angle light scattering, viscometry and refractive index. A significant relationship between changes in peak blood glucose and a combination of logarithm of the concentration and logarithm of M was found.
b-Glucan: Molecular weight: Glycaemic response
The (1→3)(1→4)-b-D-glucan (oat b-glucan) polysaccharide present in oats has been accepted by the Food and Drug Administration in the USA as a component which can lower serum cholesterol levels (Anon, 1997). An oat b-glucan isolate was shown to lower serum cholesterol levels in hypercholesterolaemic subjects by 9 % (Braaten et al. 1994). Viscous soluble fibres like oat b-glucan and guar gum, in addition to reducing blood cholesterol levels, also attenuate postprandial blood glucose and insulin levels. Jenkins et al. (1978) reported that viscosity was important for the latter activity but the role of viscosity in lowering serum choles-terol levels in human subjects is less well established. Wood
et al. (1994) modified the viscosity of a glucose drink by
using partially hydrolysed b-glucan and by changing the concentration in the drink. In this drink model, a significant inverse linear relationship between glycaemic response to a 50 g oral glucose load and log10 viscosity (at 30 /s) of a
solution of oat b-glucan or guar gum, consumed by healthy subjects was established. The relationship was true for blood glucose or insulin peak increments above baseline, excur-sions, or areas under the 2 h curve.
The shear thinning behaviour of random coil polysacchar-ides such as guar galactomannan and oat b-glucan requires that viscosity measurements be quoted for a specific shear rate, and comparison of products is difficult, with relative values dependent on the concentration and shear rates chosen for comparison (Wood et al. 1990). Viscosity of polymer solu-tions is mainly controlled by concentration in solution and molecular size and its distribution. These might be more fundamental variables with which to evaluate the ability of a polysaccharide to modify blood glucose and insulin response. Beer et al. (1997) determined the molecular weight (M) of
b-glucans using high-performance size exclusion
chroma-tography (HPSEC) and analysed the eluted material with refractive index, right angle light scattering and viscometric detectors (Viscotek, Houston, TX, USA). This system has now been applied to determine the M of the b-glucan and partially hydrolysed products used to modify the viscosity of the drinks consumed in the study of Wood
et al. (1994). This paper reports the 1994 blood glucose
data, re-analysed using the variables of concentration and weight average molecular weight (Mw) instead of viscosity. Abbreviations: HPSEC, high-performance size exclusion chromatography; M, molecular weight; Mw, weight average molecular weight.
Materials and methods
General
The clinical studies, preparation and characterisation of the b-glucan and measurements of viscosity were described in Braaten et al. (1991) and Wood et al. (1989, 1994).
b-Glucan was extracted by sodium carbonate at pH 10, and
after isoelectric precipitation of protein, isolated by preci-pitation with ethanol. Depolymerised b-glucan was pre-pared by mild acid hydrolysis (0⋅1M-HCl, 708C, 15 and 60 min) from the original oat gum, and isolated by pre-cipitation with ethanol. Viscosity (h) was determined on a Carri-Med Controlled Stress Rheometer (Carri-Med Ltd, Dorking, Surrey, England. (No longer in manufacture.)) using cone and plate geometry (6 cm 28, 4 cm 28 and 4 cm 18) in a range of shear rate up to 100 /s. Data were analysed using the apparent viscosity at 30 /s.
Subjects consumed 50 g glucose in a fixed volume of 500 ml water containing polysaccharide, or control with glucose alone. Three different trials with 9–11 subjects each were analysed. In one study (Braaten et al. 1991) 14⋅5 g doses of oat and guar ‘gums’ were compared (the gums used contained about 80–90 % polysaccharide). In a second study, 7⋅2, 3⋅6 and 1⋅8 g oat gum were compared and in a third study 7⋅2 g of the two partially hydrolysed oat gums. After subjects had consumed the glucose ‘drinks’, blood glucose and insulin levels were determined over 3 h. The data from each experiment (Braaten et al. 1991; Wood et al. 1994) were examined (Wood et al. 1994) to determine if the groups used in each experiment had significantly different plasma glucose and insulin character-istics. Generally similar mean baseline plasma glucose, and response to the glucose control meal (peak plasma glucose increment about 3⋅0 mmol/l), were observed in each experi-ment and analysis of the glucose data (peak increexperi-ment, area under curve (AUC)) from the control meals showed no statistically significant differences between the different subject groups. Thus dose and viscosity effects were evalu-ated using all data points from experiments 1–3, leading to significant (P, 0⋅0001) inverse linear relationships between increment, excursion and the area under the 2 h AUC of both blood glucose and insulin, and log10[viscosity] (at
30 /s) (Wood et al. 1994).
Determination of molecular mass
Molecular weight distribution of the oat b-glucan was deter-mined by HPSEC essentially as described by Beer et al.
(1997). Two columns (300×7⋅5 mm) in series (Shodex OHpak KB806M, Waters Ultrahydrogel; Waters, Milford, MA, USA) and a Waters model 590 pump were used for HPSEC. Samples were filtered (0⋅45mm) before analysis. The columns were maintained at 408C and eluted with 0⋅1M -NaNO3 buffer at 0⋅6 ml/min. A Perkin-Elmer ISS 100
autosampler and injector was used with an injection volume of 150ml, with detection by refractive index, viscosity (Model 250, Viscotek, Houston, TX, USA), and right angle laser light-scattering (RALLS, Viscotek). The system was controlled and the data processed by TRISEC V2⋅7 software (Viscotek). Values are average of duplicates.
Analysis of data
The blood glucose increment data from the three trials were re-analysed on the basis that the viscosity measured was a function of concentration (c) and Mw, using the general
linear models procedure of SAS (Statistical Analysis Systems Inc., Cary, NC, USA). Regression analysis was done on the basis of weighted means (subject numbers 9, 10 and 11 in the three trials). Analysis was also done on the individual responses to check for possible lack of fit of the models used.
Results and discussion
The molecular weights and concentrations of the oat b-glu-cans used in the clinical studies are summarised in Table 1. Accuracy of the Mwvalues is uncertain (although difference
between replicates in the system is, 5 %). We determined a Mwof 214 000 for a standard b-glucan. Another laboratory,
similarly using HPSEC and the Viscotek detector system, found a Mwof 268 000, or using a multi-angle light
scatter-ing detector a Mwof 278 000 (M. Fishman, personal
com-munication). Many factors, such as the refractive index increment, dn/dc, used in calculations, may influence the absolute value. In the following analyses, these differences would alter the modifying constants of equations, but not the general validity.
The weighted multiple regression revealed a significant (P=0⋅042) relationship (R20⋅88) of the form:
DG=7⋅93−0⋅68 log10(c)−1⋅01 log10(Mw), (1)
where DG is the peak blood glucose increment above fasting level, c is concentration, and Mw is the weight average
molecular weight of the b-glucan. The standard errors for the intercept, and log c and log Mwmodifiers were 1⋅3, 0⋅28
and 0⋅22 respectively, based on six means (c. 0).
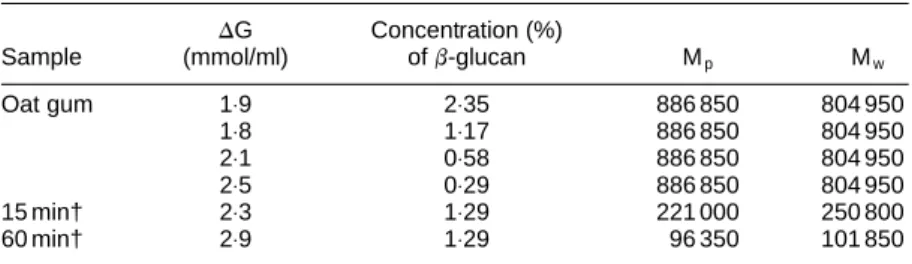
Table 1. Plasma glucose increments (DG) and molecular weights* and concentrations
ofb-glucans
DG Concentration (%)
Sample (mmol/ml) ofb-glucan Mp Mw
Oat gum 1⋅9 2⋅35 886 850 804 950 1⋅8 1⋅17 886 850 804 950 2⋅1 0⋅58 886 850 804 950 2⋅5 0⋅29 886 850 804 950 15 min† 2⋅3 1⋅29 221 000 250 800 60 min† 2⋅9 1⋅29 96 350 101 850
* Mp, peak molecular weight; Mw, weight average molecular weight.
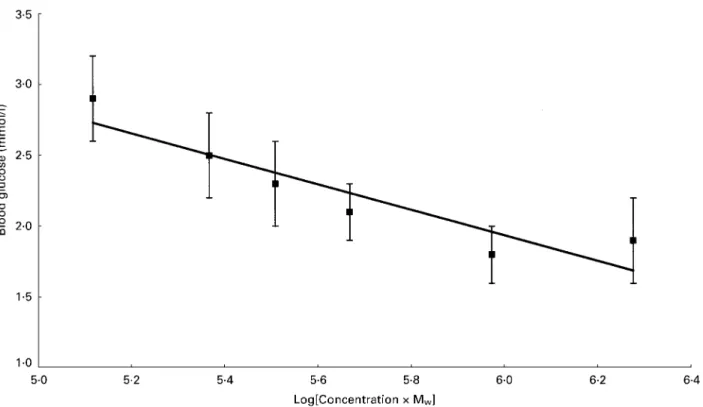
To express the relationship on a two-dimensional plot (Fig. 1), equation 1 may be approximated to the form:
DG=7⋅30−0⋅90 log10(c.Mw), (2)
when R20⋅83 (P=0⋅0112). Estimating an additional modi-fier, separately for each of log10(c) and log10(Mw) in equation
1, does not give a significantly better fit (P=0⋅36). Thus, although equations 1 and 2 are not algebraically equivalent, the difference between the two is not statistically significant. Furthermore regression analysis based on all fifty-nine indi-vidual DG values did not indicate a significant lack of fit for either model (P. 0⋅50). An eventual plateau is to be expected, and exclusion of the high c data point in equation 2 slightly improves R2(0⋅97) and P (0⋅0018), but this cannot be taken to mean that a plateau has been reached at this point, although the relationship of the point to the trend line might suggest this.
Above a critical concentration, apparent viscosity may be empirically related to both concentration and Mwin a power
law function (Fig. 2). Since:
DG=a+blog10(h), (3)
where h was viscosity at 30 /s, and a and b constants (Wood
et al. 1994), a relationship such as equation 2 was to be
expected.
The 2 h AUC for glucose also shows an inverse linear relationship with log10(c.Mw):
AUC=289−32 log10(c.Mw), (4)
with R2 0⋅77 (P=0⋅0215). As commented previously (Wood et al. 1994), when sufficient measurements are taken (i.e. every 10 min) the time independent peak values
appear to better reflect group response than values averaged at a fixed point in time (as in the group averaged glycaemic response curves) or AUC values.
Similarly, the relationship with glycaemic index (GI) was:
GI=358−48 log10(c.Mw), (5)
with R2 0⋅83 (P=0⋅0113). Thus there is little difference whether peak glucose increment, AUC or glycaemic index is used.
‘Zero shear’ mass specific viscosity (specific viscosity measured at zero shear rate, hsp0), like molecular weight,
is a more fundamental variable for evaluation, and was used by Ellis et al. (1995) in pig studies. Specific viscosity, hsp, is
(h−hs)/hs) where h is viscosity of sample and hsis viscosity
of solvent.
For oat b-glucan (Doublier & Wood, 1995), for c. about 0⋅3 % (w/v) and hsp0. about 10 mPa.s:
hsp0~ (c[h])3⋅9, (6)
where c is concentration and [h] intrinsic viscosity. The exponent of 3⋅9 is typical of random coil polysaccharides.
The Mark-Houwink-Sakurada (MHS) equation relating [h] to Mwof oat b-glucan was found to be (M. U. Beer,
unpublished results):
[h]=7⋅3×10−4(Mw)0⋅72. (7)
If the relationship of equation 3 is held to zero shear rate, then combining equations 3, 6 and 7:
DG=A9+B9 log10(cMw0⋅72). (8)
The values found empirically for A9 and B9, by fitting DG
Fig. 1. Plot showing the relationship of peak blood glucose increment (DG) (mean peak level above starting value) to log10of concentration (g/
100 ml) and weight average molecular weight (Mw) ofb-glucan consumed. Values are means with between subject standard errors represented by
in terms of log10(c . Mw0⋅72), are 6⋅27 and−0⋅99 respectively
(R20⋅73, P=0⋅0293). However, viscosity was determined, not at zero shear rate but at 30 s−1, so concentration and Mwvalues
from equations 6 and 7 cannot be substituted in equation 3, which might have a different form, and would have different constants, if zero shear viscosity had been used.
Equation 8 expands to:
DG=A9+B9 log10(c)+0⋅72 B9 log10Mw, (9)
which has the same general form as equation 1, where the exponents of Mwand c were estimated. Clearly, however,
the relative magnitudes of the modifiers of log10c and
log10M are different in these two equations, as would be
expected because viscosity was the value at a shear rate of 30 s−1and not specific viscosity at zero shear rate.
Thus empirical analysis, from limited data but with some support from theoretical relationships, establishes that the glycaemic response, in this model, may be related logarith-mically to concentration and molecular weight. If either is kept constant, then equation 1 reduces to a simple linear relationship with log c or log M. In this study, substitution of peak molecular weight (which may be more simply deter-mined) for Mw gave similar relationships, but this would
depend on the molecular weight distribution. The treatment described here deals with neutral random coil polysacchar-ides above the critical concentration.
It follows that in real foods treatments that either lower solubility or bring about depolymerisation of the polysac-charides might reduce physiological effectiveness. It must
be recognised, however, that real foods will have various differences from the drink model described here. Firstly, liquid volume of intake is not ‘fixed’. Secondly, other food interactions and microstructure will play a role (Brennan
et al. 1996). It must also be remembered that our
measure-ments were of material as consumed, whereas the site of physiological activity is the gastrointestinal tract. For exam-ple, the presence of particulate matter will significantly modify rheological behaviour. Despite these caveats, how-ever, appropriate measurements of real foods based on the above treatment might help clarify the relative contributions of viscosity and other factors to the physiological response. A key step towards achieving this objective would be to relate meal or drink measurements to measurements in the gastrointestinal tract.
Acknowledgements
Contribution numbers S011 of Southern Crop Protection and Food Research Centre and 1480 of Eastern Cereal and Oilseed Research Centre.
References
Anon (1997) Food labeling: Health claims; Oats and coronary heart disease. Federal Register 62, no. 15, 3584–3601. Beer MU, Wood PJ & Weisz J (1997) Molecular weight
distribu-tion and (1→3)(1→4)-b-D-glucan content of consecutive extracts of various oat and barley cultivars. Cereal Chemistry 74, 476–480.
Fig. 2. Plot showing the relationship between log10viscosity at 30 /s and log10of concentration (g/100 ml) and weight average molecular weight
Braaten JT, Wood PJ, Scott FW, Riedel KD, Poste LM & Collins MW (1991) Oat gum, a soluble fiber which lowers glucose and insulin in normal individuals after an oral glucose load: compari-son with guar gum. American Journal of Clinical Nutrition 53, 1425–1430.
Braaten JT, Wood PJ, Scott FW, Wolynetz MS, Lowe MK, Bradley-White P & Collins MW (1994) Oat b-glucan reduces serum cholesterol concentration in hypercholesterolemic sub-jects. European Journal of Clinical Nutrition 48, 465–474. Brennan CS, Blake DE, Ellis PR & Schofield JD (1996) Effects of
guar galactomannan on wheat bread microstructure and on the
in vitro and in vivo digestibility of starch in bread. Journal of Cereal Science 24, 151–160.
Doublier J-L & Wood PJ (1995) Rheological properties of aqueous solutions of (1→3)(1→4)-b-D-glucan from oats (Avena sativa L.). Cereal Chemistry 72, 335–340.
Ellis PR, Roberts FG, Low AG & Morgan LM (1995) The effect of high molecular-weight guar gum on net absorption of glucose and net apparent insulin and gastric inhibitory polypeptide
production in the portal blood of the pig: relationship to rheological changes in the jejunal digesta. British Journal of
Nutrition 74, 539–556.
Jenkins DJA, Wolever TMS, Leeds AR, Gassull MA, Dilawari JB, Goff DV, Metz GL & Alberti KGM (1978) Dietary fibres, fibre analogues and glucose tolerance: importance of viscosity.
British Medical Journal 1, 1392–1394.
Wood PJ, Braaten JT, Scott FW, Riedel D & Poste LM (1990) Comparisons of viscous properties of oat and guar gum and the effects of these and oat bran on glycemic index. Journal of
Agriculture and Food Chemistry 38, 753–757.
Wood PJ, Braaten JT, Scott FW, Riedel KD, Wolynetz MS & Collins MW (1994) Effect of the dose and modification of viscous properties of oat gum on plasma glucose and insulin following an oral glucose load. British Journal of Nutrition 72, 731–743.
Wood PJ, Weisz J, Fedec P & Burrows VB (1989) Large-scale preparation and properties of oat fractions enriched in (1→3) (1→4)-b-D-glucan. Cereal Chemistry 66, 97–103.