Improving the prediction of secondary structure of 'TIM-barrel'
enzymes
Thomas Niermann and Rasper Kirschner1
Abteilung Biophysikalische Chemie, Biozentrum, University of Basel. Klingelbergstrasse 70. CH-4056 Basel, Switzerland
'To whom correspondence should be addressed
The information contained in aligned sets of homologous protein sequences should improve the score of secondary structure prediction. Seven different enzymes having the
(j3/a)g or TIM-barrel fold were used to optimize the
prediction with regard to this class of enzymes. The a-helix, /3-strand and loop propensities of the Gamier -Osguthorpe-Robson method were averaged at aligned residue positions, leading to a significant improvement over the average score obtained from single sequences. The increased accuracy correlates with the average sequence variability of the aligned set. Further improvements were obtained by using the following averaged properties as weights for the averaged state propensities: amphipathic moment and a-helix; hydropathy and /3-strand; chain flexibility and loop. The clustering of conserved residues at the C-terminal ends of the /3-strands was used as an additional positive weight for /3-strand propensity and increased the prediction of otherwise unpredicted /3-strands decisively. The automatic weighted prediction method identifies > 95% of the secondary structure elements of the set of seven TIM-barrel enzymes.
Key words: (/3/a)g barrel/homologous proteins/secondary
structure prediction/TIM barrel
Introduction
It is desirable to improve the accuracy of empirically predicting the secondary structure of protein sequences. Progress in these efforts could ultimately lead to the correct prediction of the chain fold (Taylor, 1987, 1988; Argos and McCaldon, 1988; Schulz,
1988; Argos, 1990).
The empirical prediction algorithms rarely achieve >60% correctly predicted residue positions. Joint predictions involving the combination of several different empirical methods slightly alleviate this unsatisfactory situation (Biou et al., 1988). Further improvements should result from exploiting the redundant folding information contained in homologous protein sequences (Wooton, 1974; Chothia and Lesk, 1987), which are becoming increasingly available due to the development of cDNA cloning and sequencing techniques. Since the secondary structure of small, single-domain monomeric proteins is predicted with greater accuracy than that of large, multi-domain oligomers (Argos et al., 1976), it appears advisable to concentrate on the former class of proteins.
We have recently used 10 different amino acid sequences of the a subunit of tryptophan synthase to predict its secondary structure (Crawford et al., 1987). Two different empirical prediction methods (Chou and Fasman, 1978; Gamier et al., 1978) were used on the aligned set of sequences, and the consensus predictions were combined with patterns of averaged hydrophobicity and chain flexibility to achieve a joint prediction.
The sequence of secondary structure elements was consistent with the chain fold of an 8-fold /3a [(/3/a)8 or TIM]-barrel. Data on
the limited proteolysis, chemical modification and mutagenesis of the protein from Escherichia coli further supported the suggested protein fold, which was subsequently established by protein crystallography (Hyde et al., 1988). At least 18 different enzymes have the (/3/a)g-barrel fold (Farber and Petsko, 1990). Figure 1 shows indoleglycerol phosphate synthase (IGPS; Priestle
et al., 1987) as an example. This structure consists of a single
structural domain in which the alternating /3-strands and a-helices interact mainly with their neighbours and where quaternary interactions do not seem to be important for stability. In the work reported here we have chosen those seven (j3/a)8-barrel
enzymes that are presently associated with seven or more known amino acid sequences from different organisms to develop an automatic procedure for improved prediction of their secondary structure.
We show that, at a first level, averaging of the empirical predictions of secondary structure, according to Gamier et al. (1978) and Gibrat et al. (1987), at each aligned residue position improves the score in proportion to the variability of the sequence. Moreover, the patterns of averaged amphipathic helical moment, hydrophobicity and chain flexibility can be used as weights for improving the score further. At a second level the correlation between /3-strands and segments of low sequence variability was used to improve specifically the prediction of /3-strands. Finally,
a7
a8
Fig. 1. Schematic ribbon diagram of a (/3/a)8-barrel enzyme: IGPS synthase from E.coli. The C-terminal ends of the internal /3-strands (arrows) in the barrel are pointing towards the reader. The external a-helices are numbered sequentially from the N-terminus.
T.Niermann and K.Kirschner
it is shown that the 8-fold repeat of a specific template of supersecondary structure matches well to the observed sequences of secondary structure elements of the seven (/3/a)8-barrel
enzymes in the learning set.
Materials and methods
Alignment of amino acid sequences
The sequences of the proteins used in the work reported here were obtained from the MIPS data bank (Mewes, 1990). The sequences were first aligned in pairs, using the computer program FASTA (Pearson and Lipman, 1988; GCG Sequence Analysis Software Package, 1989). The computer programs PROFILE and PROFILEGAP (Gribskov et al., 1988; GCG Sequence Analysis Software Package, 1989) were used for multisequence alignment. Minor rearrangements in the sequence alignments were greatly aided by the frequent occurrence of conserved residues at the C-terminus of /3-strands or the following loops, or both. The final sequence alignment was carried out by eye, aligning the gaps and minimizing their number as far as possible. Gaps were located exclusively to known surface loops. The periodic clustering of both identical residues and gaps throughout the sequences provided the necessary internal register for confident alignment. The numbering of the set begins with the first amino acid of that sequence which has the longest N-terminal extension (not shown here). It is continuous throughout the longest segments that span each of the clustered gaps. The variability at each residue position was defined according to Wu and Kabat (1970) and used for constructing the variability weighting profile as described in the text.
Averaging of secondary structure propensities
The secondary structure 'GOR' prediction algorithm (Gamier
et al., 1978; Gibrat et al., 1987) was first used to calculate the
propensity of each residue for one of the three states H (a-helix), S (/3-strand) and C (non-H, non-S or coil, loop) for each original continuous amino acid sequence. Then the propensities corres-ponding to each residue were located to that residue's position in the matrix of aligned sequences. The average state propensities at each position were obtained by summing up and dividing the sum by the actual number of occupied positions in that column (Gamier et al., 1978). The predictions were finally converted to averaged 'state profiles' by smoothing with a three-residue span. The positions corresponding to the inserts (which define the gaps in the alignments) are given the same weight as the fully occupied positions on both sides of the gap, but for smoothing purposes only. We preferred this procedure to the use of Gly as a dummy residue in gap positions (Zvelebil et al., 1987). The state with the highest average propensity defines the predicted state at that position. This procedure is unbiased and unequivocal. By contrast, consensus procedures in which the secondary structure is determined by the predominant state can lead to ambiguous results (Crawford et al., 1987).
Accuracy of the prediction and optimization of decision constants (DCs)
There are different ways to estimate the accuracy of a secondary structure prediction on a per-residue basis. It can be quantified either by suitable quotients (Kabsch and Sander, 1983) or by correlation coefficients (Matthews, 1975). The distribution of all predicted states over all known states constitutes a 3 x 3 scoring matrix (Schulz, 1988: see also Table I). Taylor and Thornton (1984) have shown that only three states («-helix, H; /3-strand, S; loop, C) need to be considered for a//3 proteins (Levitt and Chothia, 1976).
138
The most commonly used measure of accuracy is the quotient 23 (the 'success rate'), i.e. the sum of the diagonal elements of
the scoring matrix divided by TV, the total number of residues considered.
_ H + S + C N
N is smaller than given by the total number of residue positions
in the aligned set of sequences. This difference results from ignoring gap positions and overhanging N- and C-termini, justified as follows. First, the available sequence data in gap regions is necessarily limited and second, there is no X-ray information on the secondary structure of segments which are inserted relative to the reference sequence.
Since the three different conformational states are not populated equally, there is an inherent tendency to bias Q3 towards improved prediction of the more abundant H and C states at the expense of the S state. In this work we balanced the scores of the three conformational states H, S and C, expressed as Q{ values. For example, Q, H = H/£H where H is the number of
correctly predicted H-states divided by EH, the total of known
H-states (i.e. the sum of the horizontal cells in the matrix of Table I). We observed that, upon varying the decision constants (Gamier et al., 1978) for a-helix, DC(H) and /3-strand, DC(S) in steps of 25 from —50 to 50 centinats [leaving DC(C) constant at 0], Q3 values for each of the seven test proteins varied only in a limited fashion, but the score for Qus varied strongly.
If the accuracy of prediction were determined on a per-element basis, a relatively large number of/3-strands would be unpredicted due to a relatively small fraction of unpredicted single /3-strand residues. For the combination of DC(H) = 50 and DC(S) = - 2 5 the (2i values were approximately equal for all three states in six out of seven test proteins. For alpha amylase (Amy) the optimal combination was DC(H) = 50 and DC(S) = 25. By contrast the DCs that were optimized by Taylor and Thornton (1984), and later confirmed by Gibrat et al. (1987), were also found to be optimal for the prediction of single sequences used here. The data on the average score of single sequences given in Tables I and II were obtained with the values of Gibrat et al. (1987), DC(H) = 25, DC(S) = 30 and DC(C) = 0.
We used the structure abstract procedure of Taylor (1984), for scoring predicted strings of secondary structure elements with respect to the known secondary structure (see Table II). The following additional rules provide for an unambiguous quantifica-tion of the predicquantifica-tion on a per-element basis. Predicted elements were classified into true positive (tp), false positive (fp) and false negative (fh). The sum (tp + fn) corresponds to the total of known H(S) elements. True negatives (tn) were not considered because they coincide with the category 'tp' of the other state prediction. Predictions within clustered gap positions were converted to coil predictions. The minimal length of a predicted helix was either four continuous H predictions or an interrupted run of four H out of five positions. The minimal length of a predicted /3-strand was either three continuous S predictions or an interrupted run of three S out of four positions. Runs of only three a-helical or two /3-strand positions were eliminated by reassigning them evenly to the state of the positions at the two sides. The classifica-tion of the turn or coil predicclassifica-tion was omitted because 'fp' coils appear as "fn' in the H or S prediction and 'fn' coils appear as 'fp' in the H or S prediction. Predicted H(S) elements were classified as tp' if they overlapped with known H(S) secondary structure elements by at least two residues. Missing overlaps of known H(S) elements with predicted H(S) elements were
classified as 'fn'. Predicted H(S) elements were classified as 'fp' if they overlapped with known S(H) secondary structure elements by at least two residues. This rule was applied with the following exception: if a predicted H(S) element qualified as 'tp' but also overlapped an adjacent known S(H) element, this second overlap was only classified 'fp' if it was not simultaneously overlapped by a 'tp' S(H) prediction. The intention was to ignore incorrect overlaps where the sequence of secondary structure elements was predicted correctly. This exception had to be considered only once (see the predictions for /38, a8 of aldolase in Figure 4), but
it poses a general problem for the quantitative scoring of predicted secondary structure elements. Table II shows the per-element score of each set of aligned sequences, which was evaluated from the data presented in Figure 4.
Profiles of averaged residue properties
The profiles of chain flexibility of individual sequences were calculated according to Karplus and Schulz (1985). Hydropathy profiles are calculated using the scale of Kyte and Doolittle (1982) over a five-residue span setting, and were finally smoothed with a three-residue span. The scale of Kyte and Doolittle (1982) (Cornette et al., 1987) was also used for the calculation of the helical amphipathic moment at 100 degrees (Eisenberg et al., 1984) with a span setting of 11 residues.
The chosen span settings are reasonable with respect to the average lengths of observed secondary structure elements; a-helix: n - 12; /3-strand: n = 5 (Taylor and Thornton, 1984). The averaging of these 'property profiles' for an aligned set of sequences followed essentially the procedures described above for the state profiles.
State prediction weighted by property
The three property profiles were first normalized to a maximum value of 600 centinats (Gamier et al., 1978) to allow quantitative weighting with the 'state profiles'. Then a threshold of 150 centinats was defined by iterative optimization. If a given property profile exceeded this threshold it was added to the corresponding state profile and the sum divided by two to give the 'weighted averaged state profile' in that region of sequence. The geometric mean gave practically the same improvements.
fi-Strand prediction reinforced by sequence variability
Wu and Kabat (1970) defined sequence variability as follows. The number of different amino acids at a given position of aligned sequences is divided by the fraction of the predominant residue. This variability parameter (line var. in Figure 2A) was used to enhance the /3-strand prediction in regions of low variability. The following procedure is the result of empirical optimization. The value of the normalized average /3-strand propensity was increased by 100 centinats only if the two following conditions were fulfilled simultaneously: (i) the average variability over a span of five residues was <30% of the average variability parameter over the entire set of aligned sequences; and (ii) both the average hydropathy parameters in this region were > -150 centinats and the average flexibility parameters were < 150 centinats. The second condition prevented overprediction of /3-strands in the subsequent loop regions.
Results
(Pla)g-Barrel enzymes
The seven (/3/a)8-barrel enzymes of the learning set were
phosphoribosyl anthranilate isomerase (PRAI); indoleglycerol phosphate synthase (IGPS); the a-subunit of tryptophan synthase (TSA); triose phosphate isomerase (TIM); aldolase (Aldo); alpha
amylase (Amy) and enolase (Eno). Figure 1 is a schematic ribbon diagram (Priestle, 1988) of one member of the learning set, IGPS from Escherichia coli (Priestle et al., 1987). Except for the additional a-helix a0 at the N-terminus, and the short a-helix
a8. in the loop between /38 and a8 IGPS is a 'limit 03/a)g-barrer
protein. The eight parallel j3-strands that are buried in the centre are connected on the outside by eight a-helices that are antiparallel to the eight /3-strands. Enolase is an unorthodox &\(S2a\a2 (j3/a)6-barrel enzyme (Lebioda et al., 1989). The alignments
and the predictions were performed with the full sequences of each protein. Alpha amylase is the exception, where both the large B-domain that is inserted between ft and a^ and the C-terminal domain were eliminated. The B-domain was treated as a gap for the quantitative evaluation. Although the full sequence of enolase was aligned and analysed, only the /3-barrel domain was considered for the quantitative evaluation.
Sequence alignment of indoleglycerol phosphate synthase
Figure 2(A) presents a region, 150 amino acids long, of a set of aligned sequences of IGPS from 16 different organisms. This region was selected because it is one of the least-well-predicted ones in the set of seven test proteins. It comprises - 8 0 % of the secondary structure elements of IGPS (see Figure 1). The general approach of averaging and weighting of state propensities will be illustrated qualitatively with this representative region. The quantitative prediction scores involving the full set of seven (/3/a)8-barrel enzymes will be presented further on.
The first row below the stack of aligned sequences indicates conserved residues. Upper-case letters correspond to 16 identical residues, whereas lower-case letters allow for two nonidentical residues, anticipating possible sequencing errors. Several of these residues are candidates for either substrate binding or catalytic function or both (e.g. Glul95, Asn217, Arg219 and Ser251). Residue positions in the vicinity of conserved ones frequently contain residues of similar polarity and size. The variability of the amino acid sequence is expressed by the histogram of the variability parameter defined by Wu and Kabat (1970), on a truncated scale (bottom of Figure 2A).
The next row ('X') further down corresponds to the known secondary structure of IGPS from E.coli (Priestle et al., 1987; M.Wilmanns and J.N.Jansonius, personal communication), comprising all secondary structure elements of IGPS between /32 and a8 (see Figure 1). Blank spaces correspond to clustered
gaps in the set of aligned sequences above.
Averaged secondary structure prediction
Gamier et al. (1987) proposed that homologous sequences could be used to improve the accuracy of secondary structure prediction by averaging. Panel B of Figure 2(B) depicts the three averaged secondary 'state profiles' of the aligned IGPS sequences of Figure 2(A). The coloured bar codes at the top of Figure 2(B) represent the sequences of secondary structure elements defined by the corresponding profiles below. Here, blue is a-helix, red is /3-strand and green is loop. Thus the bar code labelled 'av' corresponds to panel B, whereas the upper bar code labelled 'X' corresponds to the known secondary structure of IGPS. These known and predicted secondary structure elements are repeated in Figure 2(A), in the row labelled 'X', as runs of H (a-helix), S (j3-strand), the underscore character 0°op) and blank spaces (gap) below the set of aligned amino acid sequences. Comparison between the bar codes labelled 'X' and 'av' shows that /33 is
underpredicted, and /34 is incorrectly predicted as a portion of
one long a-helix (position 150-190). /38 is also mispredicted as
a-helix, and a loop segment around position 223 is mispredicted as /3-strand.
125 135 145 155 165 175 185 195 205 I I I I I I I I I
E c o PIVSQIAP QPILCKDrilDPYQtYLARYYQADACLLMLSVLDDDQYRQLAAVAHSLEHOVLTEVSNEEEQERAIALQ' Sty PVVSQSAP QPILCKDFIIDPYQIYLARYYO.ADACLLMLSVLDDEQYRQLSAVAHSLKMGVLTEVSNDEERERAIALa-Vp« PQVRRQVK QPVLC1CDFMVDTYO.VYLARHYGADAVLLMLSVLNDEEYKALEEAAHSLNMGILTEVSNEEELHRAVQLO-B l a ATVOATSH LPVLCKDFIIDPVQVRPARYFQADAILLMLSVLDDEEYDALAAEAARFDLDILTEVIDEEEVARAIKLO-Ppu QQARAAVS P*« KEARAACA ACa AIARQHCS Rm« TKAREACP LPALRKDFMFOTYQVFEARAWOADCILLIMASLaDNDARRLEEAAFALOMDVLVEVHDAEEMERALRLS-Bsu SDVKRAVS
Lea KEISQOVS VPTLRKDFTIDPYMIYEAKANGAVU LLIVAILTDQQLRDYRQLAEKLGMHAIVEAYTAAEVTRALgSO-Ncr RAVRQVLNONP NRPAVLRKEFIFDEYQILEARLAOADTVLLIVKMLEYELLERLYKYSLSLQMEPLVEVQNTEEMATAIKLO-And RAVRASLEOLT NRPAILRKEFIFDEYQILEARLAOADTVLLIVKMLDTELLTRLYLYSQSLGMEPLVEVNTPDENKIAVDLO-Ang RAVRQSLEOMT NRPAILRKEFVFDEYQILEARLAOADTVLLIVKHLSVELLTRLYHYERSLQMEPLVEVNTPEEMKIAVDLG-Pch RAVRQSLEOLP NRPAVLRKEFVFEEYQILEARLAGADTVLLIVKMLDIELLTRLYHYSRSLGMEPLVEVNTPEEMKIAVDLO-Pbl RQVREACPLLP NRPCILRKTFLLDTYQILEARLYOADTVLLIVAMMSDEDLRELYQYSVSLGMEPLVEVNNAEEMARANAVa-215 225 235 245 255 265 275 I I I I I I I AKVVGINNRDLRDLSIDLNRTRELAPKLGH NVTVISESGINTYAOVRELSHFA-NOFLIOSALMA AKVVGINNRDLRDLSIDLNRTBQLAPKLGH GVTVISESGINTYGQVRELSHFA-NOFLIOSALMA AKVIGINNRNLRDLTTDLNRTKQLAPTIRKLAPNATVISESGIYTHQQVROLAKYA-DOFLIOSSLMA AKIFGVNHRNLHDLSIDLDRSRRLSKLIPA DAVLVSESOVRDTETVRQLOOHS-NAFLVOSQLTS DRLAITESGILNRADVELMAINEVYSFLVGEAFMR DRLVVTESOILNRADVELMEVSEVYAFLVOEAFMR SRLLVTESGIATPO.DVQLMQEHDIHSFLVOESFMK SPLVOINNRNLRTFEVDLAVSERLAAMVSA DRLLVOESGVFTHEDCRRLEKSOITSFLVGESLMR : ESLLVSESGIGSLEHLTFVKEHOARAVLIOESLMR AKIIGINNRNLKDFRVDFTNSLKLRAMVPD NIPVVAESGIKTQEDVEKLAAAGFNAILIOETLMR AKVVGVNNRDLHSFNVDLNTTSNLVESIPK DVLLIALSQITTRODAEKYKKEQVHOFLVOEALMK AKVIGVNNRNLESFEVDLOTTORLRSMVPS DTFLCALSGINTHQDVLDCKRDGVNOILVQEAIMR AQVIGVNNRDLTSFEVDLGTTSRLMDQVPE STIVCALSOISGPKDVEAYKKDGVKAILVOEALMR AEVIOVNNRDLTSFEVDLGTTSRLHDQVPS S T I V C A L S O I S Q P K D V E A Y K K E O V K A I L V Q E A I . H R SEVIGVNNRDLTSFEVDLGTTSRLMDQVPE STIVCALSOISGPQDVEAYKKEGVKAILVOEALMR AKLIGVNNRQLHSFDVDMETTSRLAEMVPE GTILCALSOISTRADVETYVSQGVHGLLVGEALMR cons . X HHHHHH wt. HHHHHH" IV. HHHHHH" ir. 23 1213 2 1 | 2 0 | 18 | 16 | 1 5 14 13 12 HI 10 | 9 | « l 7 | « l 5 | 4 | 3 1 2 | 1 I 1 K F SSSSSSS SSSSSSH HHHHHHHHHHHHHHHSSSSSSHHHHHHHHHHHHHHHHHH_SSSSSS~ HHSHHHH~HHHHHHHHHHKHHHHHHHHHHHHHHHKHHHHHHHHHHHH SSSSHH~ d yq ar HHHHHHHHH Ad LL SSSSS 1 1 Ev HHHHHHHHHHH SSSSSSS • a G NnR L HHHHHHHHHH SSSSS "HHHHHHHHHHH SSSSSS HHHHHHHHHHH SSSSSS~ SGi 11 1111 21 "4 121 HHHHHHHHHHH SSSSSHHHH HHHH ~ SSSSSHHHHHHHHHH a6 1 1 2 11 113 SSSSSS ssssss" "SSSSSS 111 L G m HHHHKHHHHH SSSSHHHHHH ~ HHHHHHHHH HSSSSSHHHHH HHHHHHHHH HHHHHHHHHHH "7 P8 ° 8 ' 22 1 4 1 1 2 4 2 I 135
[L
1 4 5U
U
1 5 5IT
n
Ji1
Ul
u
T 175 I 185 195I 2 1 5 I 2 2 5H
\f\
235 2 4 5 I 2 6 5 12 7 5 TAveraged prediction improves with increasing sequence variability
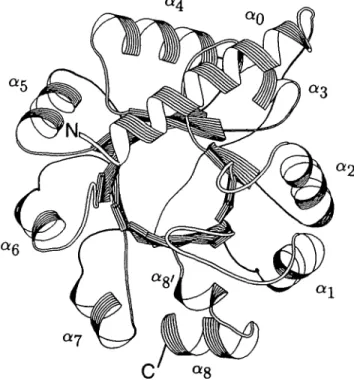
The degeneracy of the folding code (Jaenicke, 1987) (Figure 2A) that permits many different sequences to fold to the same secondary structure element in a given tertiary structure suggests that the relative improvement of prediction accuracy should depend on the variability of the sequence. To test this idea we compared the percentage increase of prediction accuracy to the average variability of each protein in the learning set. The following a/fi proteins with chain folds that differ from the 03/a)8-barrel motif were included to check the generality of this
proposal: aspartate aminotransferase (AAT) (Eichele et al., 1979; J.N.Jansonius, personal communication) and dihydrofolate reductase (DHFR) (Matthews et al, 1977). As seen in Figure 3, there is a clear correlation between the percentage increase of prediction accuracy obtained by averaging (A%) and the overall sequence variability. The accuracy cannot increase indefinitely. It appears that the relationship shown in Figure 3 approaches a plateau at a variability index above 14. A further increase of variability would render the sequence alignment progressively equivocal (Strasser et al., 1989). Predictions were performed with the optimal decision constants DC(H) = 50, DC(S) = - 2 5 and DC(C) = 0, as described in Materials and methods. For Amy, Q3 increases by 8%, but in this case these constants lead to overprediction of /3-strands, for unknown reasons. The empty symbol (D) for Amy in Figure 3 corresponds to an increase of (?3 by 13%, which was obtained with DC(S)
= 25, leaving DC(H) and DC(C) unchanged.
Averaged property profiles
Profiles of physico-chemical residue properties correlate with structural features and are useful to identify secondary structure elements. Patterns of residue properties are furthermore well-tried ingredients of pattern-matching methods (Lim, 1974; Cohen
et al., 1983). The previous study of TSA a-subunit (Crawford et al., 1987) had shown that there is generally good agreement
between buried /3-strands and local maxima of averaged hydropathy profiles (Kyte and Doolittle, 1982) as well as between surface loops and local maxima of averaged chain flexibility profiles (Karplus and Schulz, 1985). Since then we have found that the local maxima of the averaged amphipathic helical moment (Eisenberg et al., 1984) correlated well with the known a-helices in all seven test proteins. Panel A of Figure 2(B) presents the profiles of the averaged amphipathy, hydropathy and flexibility values corresponding to the representative region of IGPS in Figure 2(A). They were calculated and smoothed as described in Materials and methods.
It is seen that all known /3-strands are associated with pronounced local maxima in the hydropathy profile, whereas the correlation with the incorrectly predicted /3-strand around residue position 223 is only subliminal. The maxima in the flexibility
profiles generally correlate well with known loop segments. Moreover the profiles of hydropathy and flexibility generally vary in a reciprocal fashion. Quantitative comparisons (omitted here) showed that maxima of (3-strand profiles correlated better with maxima of hydropathy than with minima of chain flexibility. Similarly, maxima of loop profiles correlated better with maxima of chain flexibility than with minima of hydropathy. Finally, the amphipathy profiles, which have only positive values, correlate well with the known a-helical elements. Similar correlations were observed for the other test proteins (data not shown).
Weighted state prediction
Maxima of 'cognate' property profiles correlate well with known secondary structure elements. As already pioneered by Taylor and Thornton (1984) these qualitative correlations were used to develop an automatic weighting procedure, as follows. First, the three averaged property profiles were added to the corresponding averaged state profiles and the sum divided by two. The weighted averaged state profiles of a-helix, /3-strand and loop are presented in panel D and in the corresponding colour bar code labelled 'wt' in Figure 2(B), and the symbol code labelled 'wt' in Figure 2(A). Zvelebil et al. (1987) have shown recently that sequence variability profiles can be used to improve secondary structure prediction. The periodic decrease of variability that is observed at the C-terminus of (3-strands and the subsequent loops is caused by the clustering of conserved residues required for function of
15
15 17 19 21 variobility
Fig. 3. Prediction accuracy improves with sequence variability. The difference of per-residue prediction accuracy between the average of single sequences and the averaged prediction of aligned sequences [see A% (av) in Table II] is plotted versus the overall average of the variability parameter as described in Materials and methods. D , Improvement for Amy if optimal decision constants are used (see text).
Fig. 2. Secondary structure prediction is improved by weighting the averaged predictions with correlated averaged properties. (A) Section of aligned sequences
of indoleglycerol phosphate synthase from 16 different organisms (a2 to a8) . Organism acronyms: Eco. Escherichia coli; Sty, Salmonella typhimurium; Vpa, Vibrio parahaemolyticus; Bla, Brevibacterium laaofermenium; Ppu, Pseudomonas putida, Pae, Pseudomonas aeruginosa; Aca, Acinetobacter
calcoacelicus; Rme, Rhizobium meliloli; Bsu, Bacillus subiilis; Lea, Lactobacillus casei; See, Saccharomyces cerevisiae; Ncr, Neurospora crassa:
And, Aspergillus nidulans; Ang, Aspergillus niger; Pch, Penicillium chrysogenum; Pbl, Phycomyces blakesleeanus. Labelled rows: cons, conserved residues; single-letter amino acid code (upper case, conserved residues; lower case, partially conserved residues, allowing for two differences). X, Known secondary structure of the E.coli IGPS; wt, weighted averaged prediction; av, averaged prediction. Blank spaces in these lines correspond to gaps in the alignment, var, variability index (Wu and Rabat, 1970) for each position of the alignment, represented below as a truncated step profile. (B) Colour code: blue, helix and amphipathic moment profile; red, /3-strand and hydropathy profile; green, coil and flexibility profile. Panel A, Profiles of three averaged properties:
panel B, profiles of three averaged state propensities; panel C, the step profile, used for refined /3-strand prediction as described in Materials and methods; panel D, profiles of three weighted averaged state propensities. The /3-strand profile is modulated further by profile of panel C as described in Materials and
methods. The full-scale vertical axes in panels A, B and D correspond to ±400 centinats (Gamier et al., 1978). The height of the steps in panel C corresponds to 100 centinats. Bar codes: X, wt and av as defined in (A).
T.Niermann and K.Kirschner
(/3/a)8-barrel enzymes (see Figure 2A). Therefore we used the
pattern of sequence variability, to enhance specifically the prediction of /3-strands, as follows. The weighted /3-strand propensity profile—and only it—was incremented by a fixed value in regions where the average hydropathy was maximal and the average flexibility was minimal. This step function is shown in panel C of Figure 2(B). It is seen in panel D, that the previously unpredicted /3-strands /?3 and /38 were now predicted correctly.
These observations were representative of the improvements, failures and remaining ambiguities found in the other seven proteins (not shown here).
The weighting procedure generally improved the prediction of all three states. The reason is that the property profiles correlate generally well with the known secondary structure elements. In particular, most peaks in the hydropathy profiles correlate better with known /3-strands than peaks in the /3-strand propensity profile. Moreover, all known /3-strands correlate well with minima in the variability profile (see Figure 2A). They therefore all qualify for reinforcement of the /3-strand prediction as described in Materials and methods. Figure 2(B) also shows that the underpredicted /3-strand /33 is associated with small
amplitudes of the profiles of both averaged state propensity (panel B) and of averaged properties (panel A). Thus, on one hand, this segment (and similar segments in the remainder of the learning set) did not exceed the threshold required for applying the weighting procedure (see Materials and methods). On the other hand, the amplitudes of both the hydropathy and the flexibility profiles and the minimum in the variability profile associated with /33 qualified for application of the reinforcement
procedure.
The weighting procedure fails to improve the prediction in the region between residues 220 and 233; i.e. the loop around position 223 remains mispredicted as /3-strand, and the region becomes even more ambiguous by insertion of a loop into the previously correctly predicted helix a6.
Quantitative evaluation
To show how averaging and weighting of the secondary structure propensities increased the number of correctly predicted residue positions over those obtained from single sequences (si), we have (i) averaged the predictions of all the single sequences of a particular test protein, and (ii) compared that score to both the averaged (av) and to the weighted (wt) predictions.
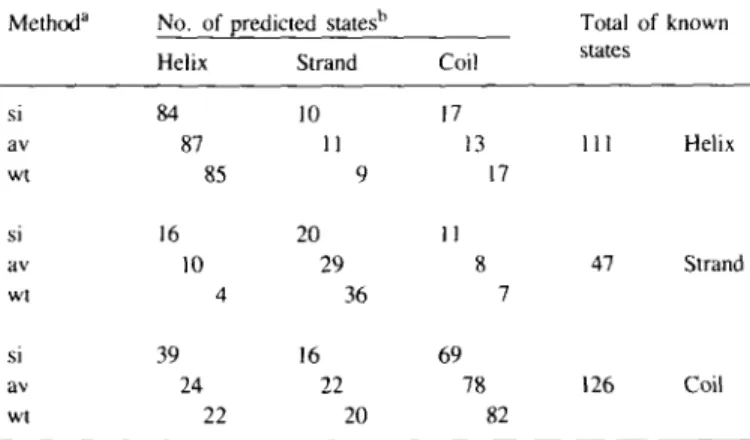
To present an unbiased summary of the results we have followed Schulz' (1988) suggestion to use a scoring matrix (Table I). The numbers represent the sum of predicted residues from all seven test proteins divided by 7 to give a realistic impression of the error distribution observed with an 'average barrel enzyme', which has a total of 284 residues.
Table I shows that the number of predicted states increases from 'si' via 'av' to 'wt' for the /3-strand and coil prediction, whereas the helix prediction remains practically unchanged. As shown in the off-diagonal cells of Table I, the increase of correctly predicted residues was necessarily paralleled by a decrease in some categories of mispredicted residues. Q3, the total score of correctly predicted residues expressed in percent, was calculated from Table I as described in Materials and methods. It increases from single sequences (61 %), via the averaging of the predictions of aligned sequences (68%), to the weighted predictions (71 %). For comparison, the score of random assignment of secondary structure to proteins of the a/j3 class on a per-residue basis is 38% (Gibrat et ai. 1987; Schulz, 1988).
Table II summarizes the individual results obtained for all seven test proteins. The Q3 values vary considerably amongst the 142
Table I. Prediction score
(/3/a)8-barrel enzyme on Method" si av wt si av wt si av wt of three conformational a per-residue basis No. of predicted statesb Helix 84 87 85 16 10 4 39 24 22 Strand 10 11 9 20 29 36 16 22 20 Coil 17 13 11 8 69 78 states 17 7 82 of an average Total states 111 47 126 of known Helix Strand Coil
"Method of prediction: si. single sequences, averaged; av, averaged; wt, weighted averaged.
'The results from the seven enzymes of the learning set were divided by 7 to yield results pertaining to an 'average' (/3/a)8-barrel enzyme.
members of the set, but the relative improvement (A%) obtained by averaging and weighting is not correlated to the (?3 scores
of the single sequences. Qt s is the score of correctly predicted /3-strand states expressed in percent. In proteins with highly diverse sequences as judged by the average variability criterion, the <2i,s value increases dramatically by averaging and weighting. These procedures lead to the recognition of previously unpredicted /3-strands (see Figure 2B). This improvement is not adequately represented by the Q3 value and requires an alternative scoring procedure.
Score based on predicted secondary structure elements
Empirical prediction methods, which draw on a statistical data base, cannot be expected to predict the borders of structural elements exactly (Taylor and Thornton, 1984; Schulz, 1988). Moreover, the appropriate standard of comparison would have to be the sequence of average secondary structure elements determined from high-resolution crystallographic data on each member of the aligned set. It is unlikely that such data will become available in the forseeable future.
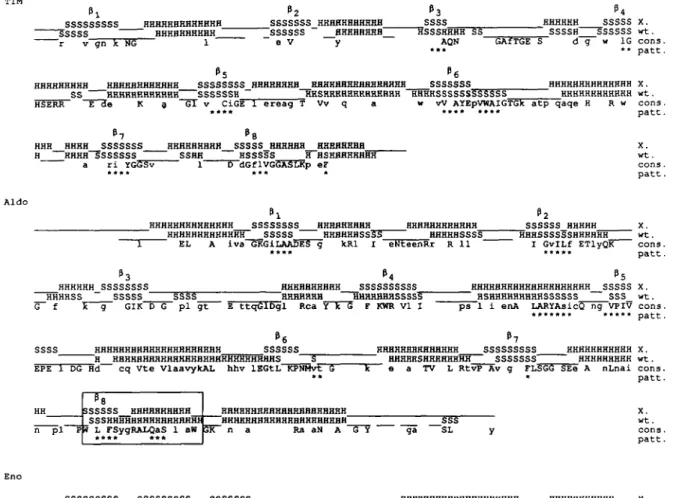
If secondary structure prediction is to be a step in recognizing the correct chain fold (Schulz, 1988), it is more important to predict correctly the number and sequence of secondary structure elements (here designated the 'secondary sequence'), rather than their exact borders. This presentation has the advantage that the 100% limit is clearly defined. Figure 4 presents the X-ray and the predicted secondary sequences of all seven (/3/a)g~barrel enzymes. These pairs of sequences are abstracted readily for preparing the quantitative score (Taylor, 1984), as described in Materials and methods. The results obtained from the entire set of test proteins are presented in Table II.
The high accuracy of correctly predicted single states in the weighted prediction for TSA, PRAI and IGPS is more significant on a per-element basis than on a per-residue basis. An inspection of the per-element scores in the matrix cells of Table II reveals that the prediction of the secondary sequence of TSA, PRAI and IGPS is very close to 100% correct. This score is a significant improvement over the score of the simpler averaging procedure that led to the correct prediction of the chain fold of TSA (Crawford et al.. 1987). In the case of TIM three out of five false negative helices are "loop helices' (see Figure 4). The part of the unorthodox (/3/a)8-barrel chain fold of Eno was also
In four cases the Q3 values attain 75% correctly predicted single residues or higher. Taking these cases together, only one out of 38 known helices was missed in the prediction, and three predicted helices had to be classified as false positives. Only one out of 32 known /3-strands was missed and five false positives were predicted.
Discussion
The availability of a relatively large number of homologous sequences of seven different (|3/a)g-barrel enzymes prompted us
to modify the existing methods of predicting the secondary structure for this predominant chain fold (Farber and Petsko, 1990) in the class of a/fi proteins. Following the suggestion of
_HHHHHHHHHHHH_ HHHHBBBRRH _SSSSSSSSSS_ HSSSSSSS HHHHHHHHHH _HHHHHHHHHHH P2 SSSSSS HHHHHHHHHHH gad E1G pf DP adGp iq a
SSBHHHHHHH~ HHHHHHHHHHH "HHHHHHHHHHH" X. wt. cons. patt. HHHHHHHHHH "4 SSSSS HHHHHHHHHH SSSSSS g f g D P BHHHHHHH HHHHHHHHH SSSSSSS " SSSSSS HHHHHHRHH SSSSS _HSHHHHHHH SSSSSSSSSSS Y S G TG H X. _HHH wt. cons. patt. "7 "8 HHHHHHHHH SSSSS HHHHHHHHH SSSS HHHHHHHH HHHHHHHHHH SSSSSSS HHHHHHHH SSSSSFTSSSSHHHHHH^ p gFG a g GS HHHHHHHUUHHHHHHHHHH HHHHHHBHHHHHHHHHHHHHH X. wt. cons. patt. "l "2 SSSSS HHHHHHHHHH SSSSS ~SSSSSS HHHHHHHHHHHSSSSSST" K CG a A G **** ***** ***** HHHHHHHHH HRHHHHHHSH X. wt. cons. patt. SSSSSSS HHHHHHHHHH SSSS HHHHHHHHHH SSSSSSS HHHHHHHHHH SSSS _HHHHHHHH vgvf n QlHg "5 "6 SSSSSSSSS HHHHHHHHH SSSSS SHSSSSS HHHHHHHHH HSSSS" D gG G SSSSHHHHH SSSS HHHHHHHHHH "BSSSSSS HHHHHHH 1AGG1 p n HHHHHHHHHHHH RHHHHHHHHHHH X. wt. cons. patt. X. wt. cons. patt. HHHHHHHHHHHHHHHHHHH "HHHHHHHHHHHHHHH 1 i HHFHHHH1 " HHHHHHHH X. HHHHHHH wt. A X cons, patt. P2 HHH SSSSS HH 5"SSSSS5~ HHHHHHHHHH HH HHHHHHHHHHH P3 P4 p5 SSSSSSS HHHHHHHHH SSSSS HHHHHHHHHHH SSSSSSS HH X. |[_SSSSSSHTHHHHHHHHHHHHHHSSSS5SHHHHHHHHHHHHHHHHHS_SSSSSS HH wt. 1 K F d yq ar Ad LL 1 1 1 Ev cons. ******** ***** ... patt. P6 HHHHHHHH SSSSS HHHHHHHHH SSSSSS HHHHHHHHHHH SSSSSHHHH HHHH_ G NnR L 1 P7 "8 SSSSSS HHHHHRHHHH SSSSHHHHHH HHHHHHHHHH "SSSSSS HHHHHHHHH~HSSSSSHHHHHH HHHHHHHHHH SGi L G m X. wt. cons. patt. Amy ssssssss HHHHHHHHHH SHHHHHHHHH " "2 SSSS X. wt. cons. patt. "3 _HHHHHHHHHHHHB SSSSSS HHHHHHHH ~S"SSSSSSSSSS D V n H "4 HHHHHHHHBHHHHHHHH SSSS HHHHHHHHHHHHHHH SSHHHHHHHHH v ~ g R D kh HHHHHHH X. _HHHHHHH wt. cons. patt. HHH_ HHH P5 sss "SSSSSSSH E "6 SSS "sssS" HHHHHHHHHH HHHHHSSSS HHHHH SSSSS SS " X. wt. cons. patt. "7 SSSS 5sssss"s~~ t nhD HHHHHHHHHH S HHHHHHHHHSSSSS~ SSSSSS ~ SSSSS" X. wt. cons. patt. HHHHHHHHHH HHHHHHSSS X. wt. cons. patt.
T.Niermann and K.Kirschner SSSSSSSSS HHHHHHHHHHBHH_ SSSSS HHHHHHHHHH z v gn X NG 1 _SSSSSSS_HHHHHHHHHHH_ SSSSSS HHHHHHHH_ e V y P3 SSSS HSSSHHHH SS AQN HHHHHH SSSSS X. [_SSSSH SSSSSS wt. S d g w 1G cons. ** patt. HHHHHHHHH HHHHHHHHHHHH SSSSSSSS_HHHHHHHB HHHHHHHHHHHHHHHH SSSSSSS HHHHHHHHHHHHHH X. SS HHHHHHHHHHHH SSSSSSH ^HHSHHBHHHHHHHHHH HHHHSSSSSSSSSSSS HHHHHHHHHHHH wt. HSERR E de K a ~6T v CiGE 1 ereag T Vv q a w vV AYEpVWAIGTGk atp qaqe H R w cons.
**** * * * * * * * * patt. P7 "8 HHH HHHH SSSSSSS HHHHHHHHH SSSSS HHHHHH HHHHHHHH H HHHfl~~S"SSSSSS SSHH HSSSSS H HSHHHHHHHH a ri YGSSv 1 5~dGfIVGGASLKp eF X. wt. cons. patt. Aldo _HHHHHHHHHHHHHH SSSSSSSS HHHHHHHHH HHHHHHHHHHHH HHHHHHHHHHHHH SSSSS HHHHHHSSSS HHHHHSSSS
EL A iva GKGiLAADES g kRl I eNteenRr R 11 * * **
SSSSSS_HHHHH X. HHHSSSSSSHHHHHH wt.
I GvILf ETlyQK cons. •«**« patt. HHHHHH SSSSSSSS HHHHSS SSSSS SSSS G~ f GIK D G pi gt HHHHHHHHHH SSSSSSSSSS HHHHHHH HHHHHHHSSSSS" HHHHHHHHHHHHHHHHHHHH SSSSS X . HSHHHHHHHHHSSSSSS SSS wt. HHHHHHHHHHHHHHHHHHHHH SSSSSS ~H HHHHHHHHHHHHHHHHHHHHHHHHHHHS 5" EPE 1 DG Hd cq vte vlaavykAL hhv lEGtL KPNMvt G
HHHHHHHHHHHHHH SSSSSSSSS HHHHHSHHHHHHHH SSSSSSS" "Tc e a TV L Rtvp Av g FL5 SSSSSS HHHHHHHHHH SSSHHHHHHHHHHHHHHHH HHHHHHHHHHHHHHHHHHHHH 4 L FSygRALQaS 1 an **** *** HHHHHHHHHHHHHHHHHHHHH HHHHHHHHH n a Ra aN A G Y SSS ga SL HHHHHHHHHHH X. ~ HHHHHHHHH wt. SEe A nLnai cons,
patt. x. wt. cons. patt. SSSSSSSSS SSSSSSSSS SSSSSSS HHHHHHHHHHHHHHHHHHHH HHHHHHHHHHH X. HHHHHHSSSSS SSSSHHHHHHSSSSSS HHSHHHHH HHHHHHHHHHHHHHHHHH SSSHHHHHHHHHHH HHHHHHHH wt. si ki ARei DSRGnPTVEVdL T KG FRaaVPSGASTGiyEALEIRD DK r GKGV kAV hiN ti PA1 1 VveQeJt D mie DGT cons.
_HHHHHHHHHHHHHHHHHHH HHHHHHHHH HHHSSSSSSSSHHHH H HHHHHHHHH
SSSSS HHHHHHHHHHHHHHHHHHHHH X. SSSSSSSSSSH HHHHHHSSSS HHHHHHHHHHHHHHHHHHHHH wt. eNKSKfGANAiLGVSLAvckAgAaeKgvPLYrHiAdLagn LPVPafNViNGGSHAGnkLAmQEFMilPvGA sF eAmRiGaEVYH LK viK cons.
HHHHHHHHHHHHHHH SSSSSSS HHHHHHHHHHHHHH SSSS X .
~"33~ HHHHHHHSS §5S wt. HHHHHHHHHHHHHHHHH SSSSSSSHH HHHHH ~ . . kYGkdAtNVGDEGGfAPNIlen EaLeLlk AI AGy dkwIGmDvAaSEF rdGkYDLDFKsP Dpsr it qL 1Y sf k YPvVSIEDPFd cons.
P5 P6 P7 Pg
HHHHHHHHHH SSSSS HHHHHHHHHH SSSSS HHHHHHHHHHHHHH SSSSSS HHHHHHHH SSSS X. HHHHHHHHHHH SSSSS HHHHHHHHHHHHHSSSS HHHHHHHHHHH SSSSS HHHSSSSSSSSS wt. q3dW AW F a glQvVgDDLTVtNPKRIa A e kacncLLLkVNQIGSvtEa qAcklaq nGWGVMVSHRSgETEDTFIADLWGLcTGQIktGA cons.
HHHHHHHHHHHHHHHH
HHHHHHHHHHHHHHHHHHHHHHHHHH HH PcRSERLAKyNQl rIEEeLG kA FAG Frnp
Fig. 4. Weighted state predictions of the seven (0/ar)8-barrel enzymes (line 'wt'). aligned to the known secondary structure (line 'X"). The abbreviations of enzymes are given in footnotes to Table II. Totally conserved residues are indicated by their upper-case single-letter amino acid code. Positions where all except maximally two amino acids are conserved are indicated by lower-case amino acid codes (line 'cons'). Asterisks (line pan") indicate the occurrence of low sequence variability correlated to hydropathy and flexibility as described in Materials and methods. The pattern is omitted for Eno because of the generally low sequence variability in the set of aligned sequences. Parentheses between /33 and a3 of Amy indicate the position of domain B. which is no
component of the (/3/a)g-barrel fold. For the significance of the boxed region (/38. as of Aldo) see Materials and methods.
Gamier el al. (1978), it is shown that the averaged three-state prediction for all residues at aligned position (i.e. the per-residue
Q3 vaJue, Table II) was significantly better than the average accuracy of that prediction for single sequences. The use of averaged property profiles, which correlate with the three conformational state profiles, as quantitative weights increased the accuracy to 67-82% on a per-residue basis. Use of the minima in the associated sequence variability profiles as
144
quantitative reinforcement of the /3-strand propensities improved the prediction even further, so that >95% of the known secondary elements were assigned correctly (see the per-element scores in Table II). This result constitutes a significant improve-ment over the previous joint prediction approach that led to the correct prediction of the chain fold of the a-subunit of TSA (Crawford et al., 1987). Table II shows that only two out of 70 known elements were missed and eight were overpredicted.
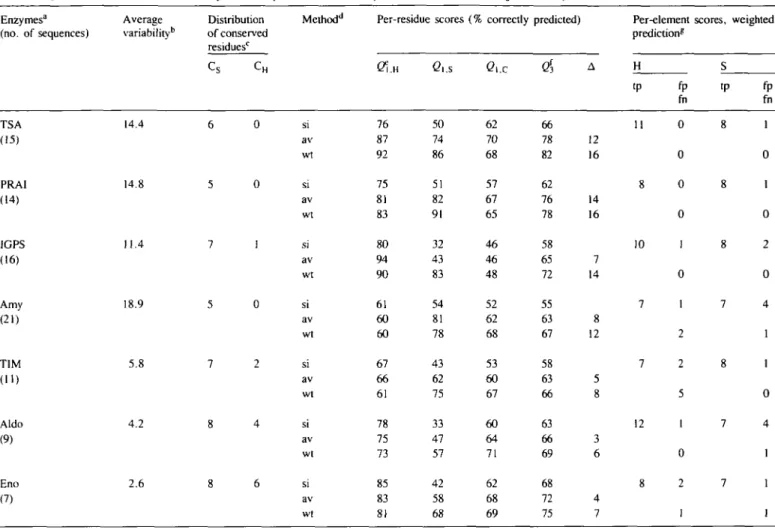
Table II. Quantitative evaluation of secondary structure predictions—summary of data from seven (/3/a)g barrel enzymes Enzymes'1 (no. of sequences) Average variability1" Distribution of conserved residuesc Methodd Per-residue 76 87 92 75 81 83 80 94 90 61 60 60 67 66 61 78 75 73 85 83 81 scores (' e,.s 50 74 86 51 82 91 32 43 83 54 81 78 43 62 75 33 47 57 42 58 68 % correctly Ci.c 62 70 68 57 67 65 46 46 48 52 62 68 53 60 67 60 64 71 62 68 69 predicted) $ 66 78 82 62 76 78 58 65 72 55 63 67 58 63 66 63 66 69 68 72 75 A 12 16 14 16 7 14 8 12 5 8 3 6 4 7 Per-element prediction* H «P 11 8 10 7 7 12 8 fp fn 0 0 0 0 1 0 1 2 2 5 1 0 2 1 scores. S tp 8 8 8 7 8 7 7 weighted fp fn 1 0 1 0 2 0 4 1 1 0 4 1 1 1 TSA (15) PRA1 (14) 1GPS (16) Amy (21) TIM (ID Aldo (9) Eno (7) 14.4 14.8 11.4 18.9 5.8 4.2 2.6 si av wt si av wt si av wt si av wt si av wt si av wt
aTSA. a subunit of tryptophan synthase; PRAI, phosphoribosyl-anthranilate isomerase; IGPS, indoleglycerol phosphate synthase; Amy, alpha amylase; TIM, triose phosphate isomerase; Aldo, aldolase; Eno, enolase. The number of individual amino acid sequences used is given below the name of the enzyme in parentheses.
^*he variability parameter defined in Materials and methods averaged over the entire sequence.
CCS, number of 0-strand plus loop segments that carry conserved residues; maximum value 8. CH, Number of a-helix plus loop segments that carry conserved residues; maximum value 8.
dMethod: si, predictions of single sequences, averaged; av, averaged; wt, weighted averaged predictions of aligned sets of sequences.
CQ\ H. Q\ s- Q\ c< percent of residues in state (H, S, C) predicted correctly as described in Materials and methods.
fQ3, percent of total residues predicted correctly. A%, increase of Q3.
gPer-element scores, based on weighted averaged predictions of aligned sets of sequences. The data of Figure 4 were evaluated by the structure abstract procedure described in Materials and methods. H, a-helix; S, /3-strand. The score for each enzyme is presented as 2 x 2 matrix. See Materials and methods for definition of tp (true positive), fp (false positive) and fn (false negative).
Therefore, it is reasonable to conclude that a g3 value of 75%
is sufficiently high to recognize the chain fold of a G3/a)8-barrel
enzyme.
What are the possible reasons for the improvement achieved with the method described in this work? The symmetric chain fold of (/?/a)8-barrel enzymes has a number of a priori
favourable properties (see Figure 1): (i) it is a single domain; and (ii) medium-range interactions (amongst subsequent a-helices and (3-strands) predominate, except for the packing of residues in the interior of the barrel (Lasters et al., 1988; Lesk et al.,
1989).
Since the work of Wooton (1974) homologous sequence information has been used in various ways (Bajaj et al., 1987; Fishleigh et al., 1987; Webster et al., 1987; Zvelebil et al., 1987; Perkins etai, 1988, 1989; Quian and Sejnowsky, 1988; Ghetti
et al., 1989) to improve the score of predicting secondary
structure. Averaging per se and the smoothing procedures lead to a suppression of ambivalent regions of the state propensity
profiles. Moreover, averaging takes into account the quantitative propensities of homologous secondary structure elements. Averaging is therefore preferable to consensus prediction procedures, which consider only the relative number of predicted states, but not their amplitudes. The chainfold of (/3/a)g-barrel enzymes permits a structurally correlated assignment of certain physico-chemical properties (i.e. hydrophobicity and chain flexibility) with particular secondary structure elements, which focus on aspects of the protein structure that are different from directional information. The conserved sequence patterns which are characteristic for amphipathic a-helices, internal /3-strands and neighbourhood correlations in oligopeptide loops at the surface seem to lead to the observed amplification of the corresponding propensities upon averaging the values at aligned residue positions. Thus, external a-helices are associated with amphipathic helical moments, internal /3-strands with pronounced hydrophobicity and surface loops with high chain flexibility. However, some amino acids have ambivalent properties (e.g. the
T.Niermann and K.Kirschner
V
Fig. 5. Schematic representation of the repeated pattern of 8-fold
(/3/a)8-barrel enzymes. Top: linear array of 0-strand (arrow) loop, a-helix (cylinder) and loop. N, N-terminus; C, C-terminus; V, sites that tolerate insertions and deletions; # , conserved residues. Bottom: bending of the linear segment generates a /3a supersecondary structure that is repeated 8-fold in (/3/a)g barrel enzymes (see Figure 1).
hydrophobic linker connecting the polar guanidino group of arginine to its a-carbon atom) and cannot be assigned uniquely to a particular secondary structure. Averaging of the property profiles of single protein sequences eliminates the ambiguity of individual amino acid residues. Similar to the effects observed with the state propensities, averaging also amplifies structurally correlated amplitudes and suppresses amplitudes which arise from ambivalent segments. The correlations between averaged propensity and property profiles are more pronounced than those of individual sequences. Thus the property profiles can be used to advantage for automatically weighting the secondary structure prediction.
Because all of the seven proteins are enzymes, there is incomplete separation between those regions that stabilize the fold and those regions that are responsible for the binding and turnover of substrates. This interdependence leads to preferred clustering of conserved residues in loops between /3-strands and a-helices and of gaps in loops between a-helices and /3-strands. Although this periodic pattern is not perfect it automatically subdivides the sequence into a number of segments (see Figure 2A). In addition, the lengths of a-helices and /3-strands are rather narrowly distributed around the average values of a//3 proteins determined by Taylor and Thornton (1984) (a, n = 12; /3, n = 5).
The periodic occurrence of /3-strands, a-helices, clustered conserved residues and gaps (see Figure 2) can be represented as a higher-level pattern that is characteristic of monomeric, single-domain (/3/a)8-barrel enzymes. Figure 5 shows the
following sequence of elements. First, a hydrophobic /3-strand, frequently carrying clustered conserved residues at its C-terminus, is followed by a loop that also frequently carries clustered, conserved residues and tolerates insertions and deletions only rarely. Occasionally non-core helices are inserted into these loops (see ag> in Figure 1). Second, an amphipathic a-helix is
followed by a loop that frequently tolerates insertions and deletions. This sequence of elements is repeated eight times. Figure 5 also shows how bending of the first loop converts the repeating unit into a supersecondary structure. Circular packing of these units to form a central closed hyperboloid of eight parallel /3-strands generates the barrel fold that carries the active site at
the C-terminal end of the /3-strands (Lasters et al., 1988; Lesk
et al, 1989).
The higher-level supersecondary structure pattern of Figure 5 can be used to detect and correct most of the mis- or unpredicted secondary structure elements shown in Figures 2 and 4. Additional cause for reconsideration is given in the case of multidomain or oligomeric (/3/a)g-barrel enzymes (e.g. TIM,
Aldo and Eno) where the various domains or subunits frequently interact via a-helices, superimposing conservation restraints that are extrinsic to the stability requirements of limit (/3/a)8-barrel
enzymes per se. Therefore the pattern can be used to discriminate tentatively between different possible chain folds in cases where the predicted pattern is not as clear-cut as for PRAI, IGPS and the a-subunit of TSA (see Figure 4).
It is interesting in this regard that the secondary structure of Eno, a heterodox 8-fold barrel enzyme (Lebioda et al., 1989), is also predicted with high accuracy on a per-element basis. In particular, the unusual N-terminal sequence /3l02(X](X2 's
correctly predicted, probably because the environments of the antiparallel /3-strand (32 and the associated helix a2 are identical to those of the other secondary structure elements.
Can the general approach that has been developed for known (;3/a)8-barrel enzymes be applied to other proteins? A problem
might arise in the alignment of a protein with unknown structure. The correct location of gaps is important because, in the final version of the alignment, even a single gap leads to a loop prediction. With proteins of unknown structure it might be difficult to assign gaps in an unequivocal manner especially if the sequence variability in that region is high. It may become necessary to reconsider the alignment where gaps and predicted a-helices or /3-strands overlap. For example, if a gap interrupts a strong peak in the a-helix profile, it must be shifted to one of the flanks of the peak. In practice only the borders of an aligned gap are somewhat arbitrary, but not its location between two predicted secondary structure elements. This statement is supported by the correct location of all five clustered gap positions in the aligned sequences of TSA before the structure was known (Crawford et al., 1987). It should be possible to determine from inspection of the two aligned sets of averaged propensity and property profiles whether an unknown protein belongs to the a/(3 class (Levitt and Chothia, 1976) or not. Averaging improves the predicted conformational propensity also of some other chain folds of the a//3 class, e.g. DHFR and AAT (see Figure 3). The averaged property profiles can also be used to enhance qualitat-ively the tentative prediction of secondary structure elements of a//3 proteins. Due to their different chain folds it will be difficult to identify /3-strands that are at the edge of extended /3-sheets and are therefore not hydrophobic, or internal a-helices, which are not amphipathic. It is therefore not advisable to use the automatic weighting or the reinforcement procedure of/3-strands that is based on minima of sequence variability.
The strongly predicted propensity peaks that correlate well with the cognate property peaks can be recorded as relatively reliable regions of secondary structure, using the rules of Taylor's (1984) structure abstract procedure. Sometimes a strong peak in the property profile may enhance a weak peak in the propensity profile, and vice versa. The tentative sequence of secondary structure can then suggest the use of ad hoc templates for enhancing ambiguously predicted regions (Webster et al., 1987). Furthermore, relevant information from genetics, the effects of chemical modification and limited proteolysis (Crawford et al.. 1987: Hurle et al.. 1988) can. in principle, help to support the prediction.
Acknowledgements
We thank M.Wilmanns and J.N.Jansonius for the refined secondary structure assignments of PRAI:IGPS and AAT, and C.Chothia for encouragement. This work was supported by the Swiss National Science Foundation, grant no. 3.255-0.85.
References
Argos.P. (1990) Methods Enzymoi, 182, 751-775.
Argos.P. and McCaldon,P. (1988) In Setlow,J. and Hollander.A. (eds), Genetic
Engineering. Plenum Press, New York. Vol. 10, pp. 21—66.
Argos,P., Schwarz,J. and Schwarz.J (1976) Biochim. Biophys. Acta, 439, 261-273.
Bajaj.M., Waterfield.M.D., Schlessinger,J., Taylor.W.R. and BlundeU,T. (1987)
Biochim. Biophys. Acta, 916, 220-226.
Biou,V., Gibrat.J.F., Levin.J.M., Robson,B. and Garnier.J. (1988) Protein
Engng, 2, 185-191.
Chothia,C. and Lesk,A.M. (1987) EMBOJ., 5, 823-826. Chou,P.Y. and Fasman.G.D. (1978) Adv. Enzymol., 47, 45-148.
Cohen.F.E., Abarbanel,R.M., Kuntz.I.D. and Fletterick,R.J. (1983) Biochemistry,
22, 4894-4904.
Cornette,J.L., Cease.K.B., Margalit,H., Spouge,J.L., Berzofsky,J.A. and DeLisi,C. (1987) 7. Mol. Bioi, 195, 659-685.
Crawford,I.P., Niermann,T. and Kirschner.K. (1987) Proteins, 2, 118 —129. Eichele.G., Ford,G.C, Glor.M. and Jansonius,J.N. (1979)7. Mol Bioi, 133,
161-180.
Eisenberg,D., Weiss,R.M. and Terwilliger.T.C. (1984) Proc. Natl Acad. Sci.
USA, 81, 140-144.
Farber,G.K. and Petsko.G.A. (1990) Trends Biochem. Sci., IS, 228-234. Fishleigh.R.V., Robson.B., Garnier.J. and Finn,P.W. (1987) FEBSLett., 214,
219-225.
Gamier,J., Osguthorpe.D.J. and Robson,B. (1978) 7. Mol. Biol., 120, 9 7 - 120. Genetics Computer Group (GCG), University of Wisconsin, Sequence Analysis
Software Package, Version 6.1 (1989).
Ghetti,A., Padovani,C, DiCesare,G. and Morandi.C. (1989) FEBS Lett., 257, 373-376.
Gibrat,J.-F., Garnier.J. and Robson,B. (1987) 7. Mol. Biol., 198, 425-443. Gribskov,M., McLachlan,A.D. and Eisenberg,D. (1987) Proc. Natl Acad. Sci.
USA, 84, 4355-4358.
Hurle,M.R., Matthews,C.R., Cohen.F.E., Kuntz,I.D., Toumadje,A. and Johnson.W.C. (1987) Proteins, 2, 210-224.
Hyde.C.C, Ahmed.S.A., Padlan,E.A., Miles,E.W. and Davies.D.R. (1988)7.
Biol. Chem, 263, 17857-17871.
Jaenicke,R. (1987) Prog. Biophys. Mol. Biol., 49, 117-247. Kabsch.W. and Sander.C. (1983) FEBS Lett., 155, 179-182.
Karplus.P.A. and Schulz.G.E. (1985) Naturwissenschafien, 72, 212-213. Kyte,J. and Doolittle,R.F. (1982) J. Mol. Bioi, 157, 105-132.
Lasters.I., Wodak.S.J., Alard.P. and van Cutsem,E. (1988) Proc. Natl Acad.
Sci. USA, 85, 3338-3342.
Lebioda,L., Stec.B. and Brewer,J.M. (1989)7. Biol. Chem., 264, 3685-3693. Lesk.A.M., Branden.C.-I. and Chothia.C. (1989) Proteins, 5, 139-148. Levitt.M. and Chothia,C. (1976) Nature, 261, 552-557.
Lim.V.I. (1974)7. Mol. Biol., 88, 873-894.
Matthews,B.W. (1975) Biochim. Biophys. Acta, 405, 442-451.
Matthews,D.A., Alden.R.A., Bolin,J.T., Freer,S.T., Hamlin.R., Xuong.N., KrautJ., Poe,M. and Hoogsteen,K. (1977) Science, 197, 452-455. Mewes.H.W. (1990) MIPS; Max-Planck Institute for Protein Sequences. Nagano.K. (1973) 7. Mol. Bioi, 75, 401-420.
Pearson,W.R. and Lipman.D.J. (1988) Proc. Natl Acad. Sci. USA, 85, 2444-2448.
Perkins.S.J., Haris.P.I., Sim,R.B. and Chapman,D. (1988) Biochemistry, 27, 4004-4012.
Perkins.S.J., Nealis,A.S., Dudhia.J. and HardinghamJ.E. (1989)7. Mol. Bioi.
206, 737-753.
Priestle,J.P. (1988)7. Appi Crystallogr., 21, 235-248.
Priestle,J.P., Griitter,M.G., WhiteJ.L., Vincent,M.G., Kania.M., Wilson,E., Jardetzky.T.S., Kirschner,K. and Jansonius,J.N. (1987) Proc. Natl Acad. Sci.
USA, 84, 5690-5694.
Quian.N. and Sejnowski,T.J. (1988) 7. Mol. Bioi, 202, 865-884. Schulz.G.E. (1988) Annu. Rev. Biophys. Biophys. Chem., 17, 1-21. Strasser,A.W.M., Selk.R., Dohmen.R.J., NiermannJ., Bielefeld.M., Seeboth,P.,
Tu,G. and Hollenberg.C.P. (1989) Eur. 7. Biochem., 184, 699-706. Taylor.W.R. (1984) 7. Mol. Bioi, 173, 512-514.
Taylor.W.R. (1987) In Bishop.M.J. and Rawlings.C.J. (eds), Nucleic Acid and
Protein Sequence Analysis: a Practical Approach. IRL Press, Oxford,
pp. 285-322.
Taylor,W.R. (1988) Protein Engng, 2, 7 7 - 8 6 .
Taylor.W.R. and Thornton.J.M. (1984) 7. Mol. Bioi, 173, 487-512. Webster,T.A., Lathrup,R.H. and Smith.T.F. (1987) Biochemistry, 27,
6950-6957.
Wooton,J.C. (1974) Nature, 252, 542-546.
Wu,T.T. and Kabat.E.A. (1970) 7. Exp. Med., 132, 211.
Zvelebil,M.J.. Barton.G.J., Taylor.W.R. and Stemberg.M.J.E. (1987) 7. Mol.
Bioi, 195, 957-961.
![Fig. 3. Prediction accuracy improves with sequence variability. The difference of per-residue prediction accuracy between the average of single sequences and the averaged prediction of aligned sequences [see A% (av) in Table II] is plotted versus the overa](https://thumb-eu.123doks.com/thumbv2/123doknet/14916883.661050/5.937.506.879.537.818/prediction-accuracy-variability-difference-prediction-sequences-prediction-sequences.webp)