Population Regulation of Gypsy Moth (Lepidoptera:
Lymantriidae) by Parasitoids: Does Spatial Density
Dependence
Lead to Temporal
Density Dependence?
C. S. FERGUSON,l
J.
S. ELKINTON,2J.
R. GOULD,3 AND W. E. WALLNER4 Department of Entomology, University of Massachusetts, Amherst, MA01003Environ. Entomol. 23(5): 1155-1164 (1994)
ABSTRACT In 1987, four gypsy moth,Lymantria dispar, (L.) densities were established in eight I-ha plots in western Massachusetts, ranging from50,000 to1.4M neonates per hectare. Two tachinid parasitoid species, Compsilura concinnata (Meigen) and Paraseti-gena silvestris (Robineau-Desvoidy), exhibited spatial density-dependent parasistism and C. concinnata was the major source of gypsy moth mortality. This study investigated whether spatial density-dependent mortality in 1987 translated into temporal density-dependent mortality of experimental gypsy moth populations created the following year (1988). C.concinnata was responsible for the largest percentage of gypsy moth mortality again in 1988, however, overall mortality caused by C.concinnata in 1988 was consider-ably less than in 1987. Gypsy moth mortality caused by P.silvestris was greater in 1988. The killing power of either parasitoid in 1988 were not linearly related to the estimated density of the parasitoids produced in the previous year. We saw no evidence for a between-generation numerical response (l-ha scale) of either the generalist parasitoid, C.
concinnata, or the specialist parasitoid, P.silvestris, between 1987 and 1988. KEYWORDS Lymantria dispar, parasitoids, density dependence
AGGREGATIONSOF PARASITOIDSto patches of high-host density may contribute to the stability of host-parasitoid systems (Hassell & May 1973) and to the success of biological control agents (Beddington et al. 1978). These findings oc-curred in the context of Nicholson-Bailey mod-els for specialist parasitoids in which the number of hosts parasitized in generation (t) determined the number of parasitoids available to attack hosts in the next generation (t
+
1). The effect of parasitoid aggregation and spatial density-dependent parasitism on the stability of host-parasitoid systems predicted by these earlier studies has been challenged (Murdoch et al. 1984, Reeve & Murdoch 1985, Murdoch & Stew-art-Oaten 1989). Hassell (1985), Hassell et al. (1987) and Latto&
Hassell (1988) conducted simulations that indicated that spatial density-dependent mortality by generalist parasitoids re-sults in temporal density dependence andregu-1Current address: Biology Department, Hobart and William Smith Colleges, Geneva, NY 14456.
2Current address: Department of Entomology, University of Massachusetts, Amherst, MA 01003.
3Current address: Niles Biological Control Laboratory, USDA-APHIS PPQ, Niles, MI 49120.
4Current address: Center of Biological Control of Forest Insects and Diseases, Northeast Forest Experiment Station, Hamden, CT 06514.
lation of the host population, under some conditions. Dempster & Pollard (1986) and Stew-art-Oaten & Murdoch (1990) argued that these simulations contained built-in temporal density dependence. Alternative models suggested by Stewart-Oaten & Murdoch (1990) indicate that spatial heterogeneity of parasitoid attack can de-stabilize host populations and that spatial den-sity dependence may cause inverse temporal density dependence. The conditions under which spatial density dependence leads to tem-poral density dependence and the importance of spatial density dependence to population regu-lation remain unresolved.
In 1987, a strong spatial density-dependent re-sponse by a tachinid parasitoid, Compsilura
con-cinnata
(Meigen), was demonstrated in experi-mentally created gypsy moth (Lyman tria dispar) field populations ranging from 40,000 to 1.1 M first instars per hectare (Gould et al.1990).
C.concinnata,
a multivoltine generalist parasitoid (Culver 1919), was the principal source of gypsy moth larval mortality and the primary reason for the collapse of the experimental popula-tions (Gould et al. 1990).Parasetigena silvestris
(Robineau-Desvoidy), a specialist tachinid para-sitoid, demonstrated a weak density-dependent response to the experimental gypsy moth popu-lations (Gould et al. 1990). P.
silvestris
has been 0046-225XJ9411155-1164$02.00/0 © 1994 Entomological Society of America1156 ENVIRONMENTAL ENTOMOLOGY Vol. 23, no. 5
implicated in the regulation oflow-density gypsy moth populations in Europe (Montgomery & Wallner 1988). These results occurred when na-tive gypsy moth population densities were low, <10,000 first instars per hectare.
In recent analyses of 10 yr of gypsy moth den-sity and parasitism data from New Jersey, Wil-liams et a!. (1992) concluded that gypsy moth mortality by four of the five dominant parasitoid species, including P. silvestris, was directly density dependent. Although, none of the corre-lations were very strong (Williams et al. 1992). The fifth parasitoid species, C. concinnata, did not exhibit density dependence. Neither P.
sil-vestris or C. concinnata exhibited delayed
den-sity dependence as indicated by regressions of percentage of parasitism with the density in pre-vious years, and no parasitoid exhibited a strong numerical response to increases in gypsy moth densities (Williams et a!. 1992).
We hypothesized that responses of C.
concin-nata and P. silvestris may playa role in
suppress-ing locally dense gypsy moth populations (Gould et a1. 1990). However, we do not know if the spatial density dependence documented for ei-ther species, translated into temporal density de-pendence. Therefore, in 1988 we investigated the between-generation numerical response of C. concinnata and P. silvestris by experimentally creating gypsy moth populations of 500,000 first ins tars per hectare in the same augmentation plots established in 1987. We hypothesized that higher rates of gypsy moth parasitism by the spe-cialist P. silvestris would occur in the plots re-ceiving the higher gypsy moth densities in the previous year, but no increase in parasitism by the generalist C. concinnata would occur, be-cause the latter species requires alternate over-wintering hosts.
Materials and Methods
Study Site. Field studies were conducted at the Cadwell Memorial Forest, a state owned for-est located in Pelham and Belchertown, MA, and on the nearby Quabbin Reservoir Forest. In 1988, we used eight I-ha plots established in 1987 for a gypsy moth augmentation study (Gould et a1. 1990). The species composition of the overs tory and understory vegetation in these plots have been previously described (Gould et a1. 1990). Two additional plots, not manipulated in 1987, were established nearby in the Quabbin Forest as controls. Each-l ha plot consisted of 100 flagged points, evenly spaced, in a 10 by 10 grid (Fig. 1). All plots were separated by at least 500m.
Collection and Release of Egg Masses. Ap-proximately 30,000 egg masses were collected from wild gypsy moth populations in Queen Annes County, Maryland, in March 1988. The Maryland populations ranged from moderate,
500 egg masses per hectare, to high density, 8,000 egg masses per hectare. Egg masses were transported to the USDA Forest Service
Labora-tory in Hamden, CT, and stored at 6°C until de-ployed in May. Hatch rate was determined by dividing a random selection of egg masses into five I-g samples (±0.5 mg) in individual acrylic mesh packets. The packets were surface steril-ized in a 10% formalin solution to remove viable nuclear polyhedrosis virus from the egg surface, rinsed in tap water for 1 h, dried for 2.5 h, and placed in individual petri dishes and held at room temperature. The petri dishes were checked daily and first instars were counted and removed until hatch ceased (P. Grinberg, Ham-den Forest Service Laboratories, personal com-munication). The mean number of larvae hatch-ing per gram of eggs was used to calculate the number of grams of eggs required to approximate a larval density of 500,000 first instars per hectare.
On 12 May 1988, 100 acrylic packets contain-ing gypsy moth egg masses were deployed in each of the 10 plots coincident with native gypsy moth hatch and oak leaf flush in the plots. The resulting densities (500,000 first instars per hect-are) were equivalent to the second highest den-sity created in 1987 (see Gould et a!. 1990 for density classes). A single packet was stapled at breast height to an overstory tree near each of the 100 flagged points in each plot.
Gypsy Moth Density Estimates. In each plot, gypsy moth densities were monitored using the same techniques used in 1987 (Gould et a!. 1990). Frass traps (n =48) (Liebhold & Elkinton 1988a) were systematically placed in each plot to estimate the density of third to sixth instars per hectare as described by Liebhold & Elkinton (1988b). Also, "'='100overs tory trees (dbh >4.0 cm) in each plot were wrapped with burlap ("'='25 cm wide) at breast height to provide refuge for older-instar and pupal gypsy moths. Burlapped trees were checked weekly from fourth instar through pupation and the number of larvae in each instar and the number of male and female pupae were recorded. The number of larvae un-der burlap does not directly translate into the number of larvae per hectare. Therefore, these values were used only to estimate changes in gypsy moth densities for later instars and pupae.
In September 1988, egg masses were counted in each plot using nine 5-m fixed radius circles. No burlapped trees were included in the fixed-radius circles. The number of eggs per egg mass was estimated using the methods described by Moore & Jones (1987). Gypsy moth survival dur-ing the 1988 season was compared with gypsy moth survival in 1987 based on the density esti-mates of gypsy moths in all plots.
Monitoring Gypsy Moth Mortality. One hun-dred gypsy moth larvae were collected weekly from each plot over a 7-wk period, beginning the
EGG MASSES 0- - 0 1987 .-. \988 L __ 2_ L2 L3 L L, 2 L 3.4 L4 5 LS 6 • 3.4 L4 LS ,
t~,'
LS.6P LS.6f..."t, \\UPAE. ADULTS LS.6·P 't.. PUPAE '- EGG PLOT 38 '-,t
MASSES 0- -'0 1987 , .-. \ 988 ' EGG , MASSES Ll 0.. L3 L3 4-~-~:~.S,
L, L2 ~LS.6 LS.6 L3 ~ LS.6 LJ.4 't, t..~LS'6'P LS.6't, LS 6'6 PUPAE ." EGGPLOT 48 PUPAE', loIASSES
----
,
t
0- -0 \987 ' , EGG .-. \988 '- MASSES .-. CONTROL \ 0- - 0 CONTROL 2 1000000 100000 10000 1000 100 \0 PLOT 4A 0- -0 1987 .-. 1988 PLOT 3A 0- - 0 1987 .-. 1988 1000000 100000 10000 1000 100 10 1000000 100000 10000 1000 100 10«
I "- 1000000 U'l I 100000 r-0 10000~
>-
1000 U'l 0- 100>-'-'
10 0 Z 1000000 100000 10000 1000 100 10 \1 May 21 May 10 Jun 30 Jun 20 Jul 9 Aug
DATE
Fig.!. Density of gypsy moths (moths per hectare) in each I-ha plot during 1987 and 1988. Larval instars are represented by L1-L6. Two previously unmanipulated plots were used as control plots in 1988.
1158 ENVIRONMENTAL ENTOMOLOGY Vol. 23, no. 5
last week of May and continuing to the 2nd wk in July when pupation started. Early instars were collected from foliage cut from the overs tory with pole pruners. Later ins tars were collected from understory foliage, litter, and tree trunks. All collected larvae were placed individually in 30-ml plastic cups containing artificial diet (Bell et al. 1981) and kept in an outdoor insectary lo-cated in Cadwell Forest. Larvae in the insectary were checked weekly and their condition as-sessed, those living remained in the insectary for subsequent mortality checks. If the fate of the dead larvae was not discernible, they were held for an additional week in the laboratory. If no parasitoids emerged in the additional time, lar-vae were dissected and checked for unemerged parasitoids and a smear taken to discern occlu-sion bodies of the nuclear polyhedrosis virus under a phase-contrast microscope at 1,OOOX magnification (Woods & Elkinton 1987). All un-explained mortality was categorized as
other.
Weekly mortality checks continued until the death or adult emergence of all collected speci-mens.
Estimating C. concinnata Density. C.
cancin-nata
is a multivoltine generalist parasitoid; therefore, it would have attacked alternate hosts for one or more generations since parasitizing gypsy moth in 1987. We attempted to estimate C.concinnata
population densities (before our 1988 egg mass release) in five of the 10 plots by placing 50 conical ground-emergence traps (modeled after Polles&
Payne 1972) at 20-m intervals throughout the plots. Additionally, yel-low sticky traps (8.9 by 12.7 em) (Olson, Pest Management, Amherst, MA) were hung at breast height at 25 points in these plots to monitor C.concinnata
populations throughout the season (Weseloh 1981). The sticky traps were checked weekly and changed every other week from May through August and all tachinids similar to C.concinnata
were identified (Sabrosky & Reardon 1976).Mortality Analysis. The proportion of mortality caused by each parasitoid was calculated on a weekly basis from the rearing data for each plot (Table 1) (SAS Institute 1987). Because para-sitoids can act simultaneously on a single host and host mortality can be attributed to only one parasitoid, a marginal probability of mortality (Royama 1981, Elkinton et al. 1992) caused by a particular parasitoid was calculated using a com-puter program written by
J.
Buonaccorsi (Bounaccorsi & Elkinton 1990). The proportion of individuals surviving the action of each para-sitoid (5) was used to calculate the killing power, k-value, of that parasitoid;k
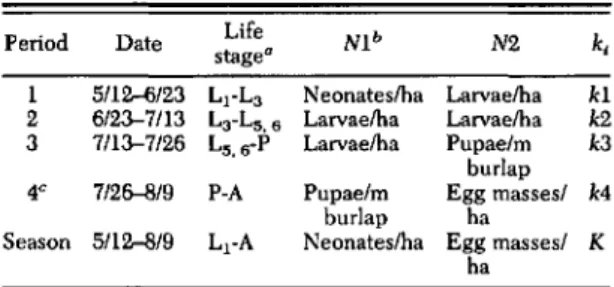
= -log105 (Varley et al. 1973). Weekly k-values for each cause of death were summed across weeks within each time period. The mortality caused by parasitoids and diseases estimated form the rearing data ac-counts for only part of the total decline in densityTable 1. Parameters used to calculate period k-values based on the density estimates in aU plots, where kl =
-10810 N2/NI
Period Date Life Nib N2 k,
stage"
I 5/12-6/23 L)"La Neonates/ha Larvae/ha kl
2 6/23-7/13 La-L5.6 Larvae/ha Larvae/ha k2
3 7/13-7/26 L5. G-p Larvae/ha Pupaelm k3
burlap
4C 7/26--819 P-A Pupae/m Egg massesl k4
burlap ha
Season 5/12-8/9 L1-A Neonates/ha Egg masses/ K ha
" Life stage designations are as follows; L
=
larva, P=
pupa, A = adult.bNl =initial density, N2=surviving density, k
=
k-value.CIndicates period 4 was adjusted by assuming an
approl<i-mate 50:50 sel<ratio and calculating fraction of eclosed females out of total eclosed males and females
=
k.rin each time period, the remainder caused by predators and other unknown sources we call residual mortality (Gould et al. 1990). The k-value for residual mortality (kresicV was calcu-lated as the difference between the k-value for total mortality for the time period (ki, i= 1,2,3,4) based on the estimates of density:
k,
=-loglO(Ni+
lINi) and the k-value for all causes of mortality(parasitoids and disease) estimated from the rear-ing data. The k-value for the last period (k4) in-cludes a sex-ratio effect, because larval counts include both males and females, whereas only the females produce egg masses. We estimated a k-value for sex ratio
k.
r=-loglo(f)
wheref
is the fraction of the population that was female. An estimate of this fraction was determined from the burlap counts of male and female pupae. A re-vised estimate ofk4
was made by subtractingk
srfrom the estimate of
k4
based on change in den-sity during this period.The proportion of gypsy moths surviving weekly after each parasitoid acted was multi-plied across the 7-wk larval collection period to obtain gypsy moth mortality caused by each par-asitoid for each plot. By
percentage of mortality
we mean the marginal probability of dying (Royama 1981) expressed as a percentage, which we believe is the best measure of parasitoid im-pact (Bellows et al. 1992). The percentage of mortality caused by parasitoids were compared by plot between years (1987 versus 1988).
To determine if a between generation numer-ical response of C.
concinnata
and P.silvestris
occurred, the estimated loglO number of adult parasites of each species in the 1987 plots was regressed against the observed 1988 percent par-asitism (expressed as a k-value) of each para-sitoid (Abacus Concepts 1990). A significant (P
<
0.05) positive correlation would be evidence for a between-generation numerical response.
Pupal Survival. Pupal predation in each plot was determined by deploying 48 individual
fe-Table 2. Fall egg mass counts in 1987 and 1988 and the corresponding 1988 egg densilies Cor all plots including two control (CNT) plots estahlished in 1988
Plot Egg masses/ha Eggs/haa 95% CI
1987 1988 1988 Lower Upper lA 0 28 4,383 4,277 4,711 IB 34 283 42,183 42,120 4,253 2A 23 198 104,440 104,217 105,688 2B 23 325 50,127 50,062 50,491 3A 0 46 7,922 7,850 8,327 3B 0 42 12,259 12,137 12,943 4A 0 0 0 0 0 4B 0 56 7,698 7,640 8,021 CNT 1 169 24,801 24,739 25,147 CNT2 70 31,320 31,133 32,369
0, No egg masses were found. -, Indicates that two control plots (CNT 1 and 2) were not sampled in 1987.
aThe number of eggs per hectare was calculated using the Moore & Jones (1987) regression equation. male gypsy moth pupae, adhered to small burlap
pieces with beeswax, in each plot for a period of 3 d (Smith & Lautenschlager 1981). The pupae were placed on the ground at the same flagged points in all plots. On day 3, the pupae were examined and their fate determined based on the type of feeding damage we observed (Smith
&
Lautenschlager 1981). The goodness-of-fit of the observed pupal survival in each plot to pupal survival in the same plots in 1987 was tested using the chi-square test statistic (SAS Institute 1987).Results
Gypsy Moth Density Estimates. Final gypsy moth densities were considerably higher in 1988 than in 1987 in seven of the eight field plots based on fall egg mass counts (Table 2). Plot designations are the same as those used by Gould et al. (1990). In 1988, the most substantial drop in gypsy moth density occurred between late instars, pupal and adult stages (Fig. 1). The rate of decline during these life stages was
sim-ilar to the decline observed during the same life stages in 1987. However, the 1987 gypsy moth populations also exhibited substantial drops in density during midlarval stages (L3-Ls). Survi-vorship curves were almost identical for the gypsy moth populations in the two control plots that had not been manipulated in 1987 (Fig. 1). Mortality Analysis. The same parasitoid spe-cies were recovered from gypsy moth larvae in both years, two dipeteran parasites, C.
concin-nata and P. silvestris, and two hymenopteran parasites, Cotesia melanoscela Ratzburg (Bra-conidae) and Phobocampe disparis Veireck
(Ich-neumonidae). Total gypsy moth mortality was higher in the 1987 plots than in the same plots in 1988 based on analysis of the rearing data (Table 3) and coincided with decreased gypsy moth sur-vivorship in 1987. Total gypsy moth mortality in the two control plots were comparable to levels of gypsy moth mortality observed in the other
eight plots, although control plot 1 (CNTl) did
have the lowest gypsy moth mortality out of the10 1988 plots.
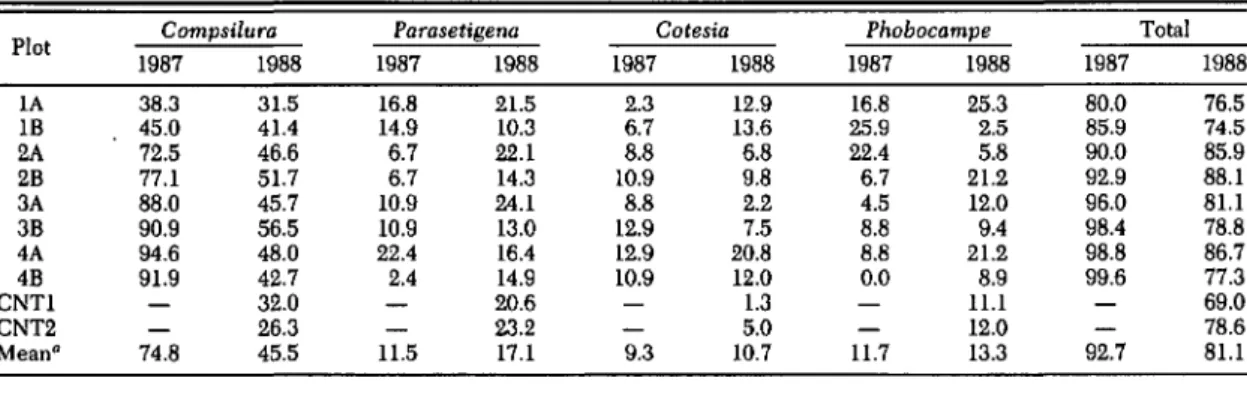
Table 3. Gypsy moth percentage of mortality caused by natural occurring parasitoids within experimental plots in 1987 and 1988
Plot Compsilura Parasetigena Cotesia Phobocampe Total
1987 1988 1987 1988 1987 1988 1987 1988 1987 1988 lA 38.3 31.5 16.8 21.5 2.3 12.9 16.8 25.3 80.0 76.5 IB 45.0 41.4 14.9 10.3 6.7 13.6 25.9 2.5 85.9 74.5 2A 72.5 46.6 6.7 22.1 8.8 6.8 22.4 5.8 90.0 85.9 2B 77.1 51.7 6.7 14.3 10.9 9.8 6.7 21.2 92.9 88.1 3A 88.0 45.7 10.9 24.1 8.8 2.2 4.5 12.0 96.0 81.1 3B 90.9 56.5 10.9 13.0 12.9 7.5 8.8 9.4 98.4 78.8 4A 94.6 48.0 22.4 16.4 12.9 20.8 8.8 21.2 98.8 86.7 4B 91.9 42.7 2.4 14.9 10.9 12.0 0.0 8.9 99.6 77.3 CNTl 32.0 20.6 1.3 11.1 69.0 CNT2 26.3 23.2 5.0 12.0 78.6 Meana 74.8 45.5 11.5 17.1 9.3 10.7 11.7 13.3 92.7 81.1 7
Mortality was computed as (1 - n (1 - mal)) where rna is the marginal probability of dying from agent A in week i over a 7-wk
l~l
period and total mortality
=
1 - the product of the total proportion of gypsy moths surviving alter each parasitoid acted. Total mortality will not equal the sum of the parasitoid mortality. See Gould et al. (1990), Elkinton et al. (1992) for details.1160 ENVIRONMENTAL ENTOMOLOGY Vol. 23, no. 5
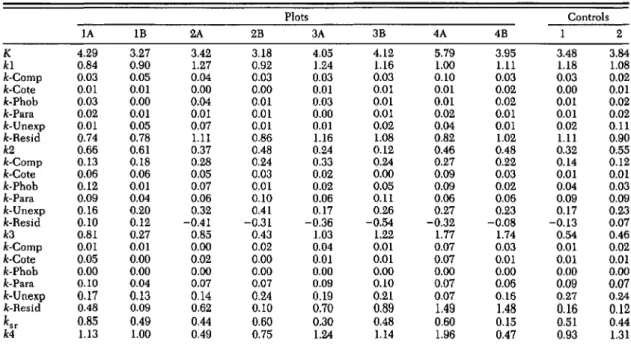
Table 4. The killing power (k.value) of mortality agents during five periods in 1987 and 1988
Plots Controls lA IB 2A 2B 3A 3B 4A 4B 1 2 K 4.29 3.27 3.42 3.18 4.05 4.12 5.79 3.95 3.48 3.84 kl 0.84 0.90 1.27 0.92 1.24 1.16 1.00 1.11 1.18 1.08 k-Comp 0.03 0.05 0.04 0.03 0.03 0.03 0.10 0.03 0.03 0.02 k-Cote 0.01 0.01 0.00 0.00 0.01 0.01 0.01 0.02 0.00 0.01
k·Phob 0.03 0.00 0.04 O.oI 0.03 O.oI 0.01 0.02 0.01 0.02
k-Para 0.02 0.01 0.01 0.01 0.00 O.oI 0.02 0.01 0.01 0.02 k-Unexp 0.01 0.05 0.07 0.01 0.01 0.02 0.04 O.oI 0.02 0.11 k-Resid 0.74 0.78 1.11 0.86 1.16 1.08 0.82 1.02 1.11 0.90 k2 0.66 0.61 0.37 0.48 0.24 0.12 0.46 0.48 0.32 0.55 k-Comp 0.13 0.18 0.28 0.24 0.33 0.24 0.27 0.22 0.14 0.12 k-Cote 0.06 0.06 0.05 0.03 0.02 0.00 0.09 0.03 O.oI 0.01 k-Phob 0.12 0.01 0.07 0.01 0.02 0.05 0.09 0.02 0.04 0.03 k-Para 0.09 0.04 0.06 0.10 0.06 0.11 0.06 0.06 0.09 0.09 k-Unexp 0.16 0.20 0.32 0.41 0.17 0.26 0.27 0.23 0.17 0.23 k-Resid 0.10 0.12 -0.41 -0.31 -0.36 -0.54 -0.32 -0.08 -0.13 0.07 k3 0.81 0.27 0.85 0.43 1.03 1.22 1.77 1.74 0.54 0.46 k-Comp 0.01 O.oI 0.00 0.02 0.04 0.01 0.07 0.03 0.01 0.02 k-Cote 0.05 0.00 0.02 0.00 0.01 O.oI 0.07 0.01 0.01 0.01 k-Phob 0.00 0.00 0.00 0.00 0.00 0.00 0.00 0.00 0.00 0.00 k-Para 0.10 0.Q4 0.07 0.07 0.09 0.10 0.07 0.06 0.09 0.07 k-Une1Cp 0.17 0.13 0.14 0.24 0.19 0.21 0.07 0.16 0.27 0.24 k-Resid 0.48 0.09 0.62 0.10 0.70 0.89 1.49 1.48 0.16 0.12 ksr 0.85 0.49 0.44 0.60 0.30 0.48 0.60 0.15 0.51 0.44 k4 1.13 1.00 0.49 0.75 1.24 1.14 1.96 0.47 0.93 1.31
1: 5/12-6/23 (kl), period 2: 6/23-7/13 (k2), period 3:7/13-7/26 (k3), period 4: 7/26-8/19 (k4) and the entire season: 5/12-8/9 (K)
in 1988 plots.
Comp, CompsiluTa concinnata, cote, Cotesia melanoscelus, phob. Phobacampe disparis, para, Parasetigena silvestris, unexp. unexplained rearing mortality, and resid, residual mortality not accounted for by rearing.
The generalist parasitoid, C.
concinnata,
caused the largest percentage of gypsy moth mortality in both 1987 and 1988 (Table 3). How-ever, in 1988, gypsy moth mortality caused by C.
concinnata
was considerably less than mortality caused by C.concinnata
in 1987 (mean mortal-ity; 45.5 and 74.8%, respectively). The specialist tachinid parasitoid, P.silvestris,
caused less overall mortality to gypsy moth than C.concin-nata
in both years, but mortality caused by P.silvestris
was higher in 1988 than in 1987 (mean mortality; 17.1 and 11.5%, respectively). Parasit-ism by P.silvestris
was not higher in plots re-ceiving higher gypsy moth densities in 1987 (Ta-ble 3). In the two control plots, mortality caused by P.silvestris
was comparable to mortality caused by C.concinnata.
The mean percentage of mortality attributed to C.
melanoscela
and P.disparis,
neither of which displayed a density-dependent response in 1987, was comparable in both years (Table 3). The contribution of each of these parasitoids to gypsy moth mortality varied considerably between plots in 1988.To assess the relative importance of each par-asitoid on different life stages of gypsy moth, the killing power (k-values) of each agent was com-pared during four discrete time periods (Table 4). In all plots, the largest contribution to period 1 k-values (k1), which includes early instars (L l-L3), was residual mortality. Because residual mortality measures mortality not accounted for by rearing, it appears that either dispersal
(Le-onard 1971) or predation (Campbell 1969) may be important in early instar losses. Overall, mor-tality caused by parasitism was negligible during period 1.
In period 2, when gypsy moths were primarily in mid-larval stages (L3-Ls), residual mortality was inconsequential, which implies that rearing mortality accurately reflected field mortality dur-ing this period. The largest contribution to pe-riod 2 k-values
(k2)
was by C.concinnata
(Table 4). Period 3 k-values (k3) were greater than k2values in seven of the 10 plots, which coincides with declines in gypsy moth survivorship during later instar and pupal stages (Table 4; Fig. 2).
P.
silvestris
contributed the most to period 3k-val-ues in 1988 and contrasts with 1987, when C.
concinnata
remained the primary mortality agent acting during period 3 (Gould et al. 1990). Residual mortality was the largest component ofk3
and may be attributed in part to predation (Table 4). A variety of invertebrates was ob-served under the burlap bands during this time period. Most noticeable were the carabid bee-tles,Calosoma
spp., immature staphilinids, pen-tatomids, ants, and spiders. We made no attempt to measure their impact.Vertebrate predation of the last instars and pu-pae was not directly assessed but was probably a contributing factor to the period 3 k-value. Un-explained mortality was also an important com-ponent of
k2
andk3
and probably reflects factors associated with handling field collected larvae.4.0 3.5
•
•
3.0•
•
2.5r---~._.J
•
•
0.16 00 00 0.12 a. ,....5
•
v,-
0.08 '1:.•.
III'"
-=
0.04 'Uj&
~ 0.00 6.0 1.5 2.0 5.0•
4.0 0.5 ClCl ClCl a. 0.4 ,....5
~.•.
0.3 ':! l:: l:: 'C 0.2 l:: c..•
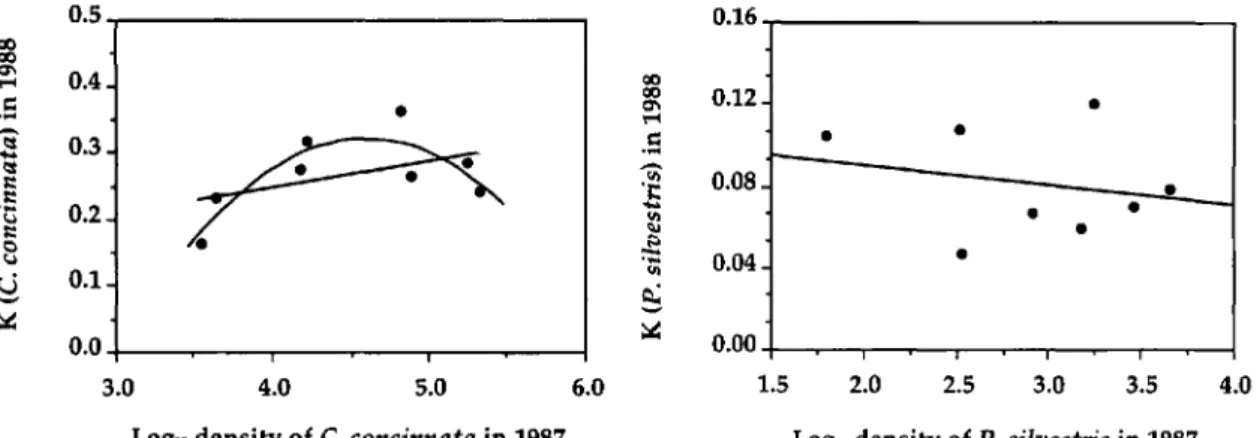
~ 0.1 ~ 0.0 3.0Log1. density of C.concinnata in1987 Fig. 2. Regression of the k-value for C. concinnata in 1988 on IOglOdensity of C. concinnata in 1987(Y =
0,087 +0.040(X); R2 =0.2209; P == 0.240, Y=-2.38 +
1.17(X) - 0.13(x2); R2
=
0.728; P=
0.0384).LOg1. density ofP.silvestris in1987 Fig. 3. Regression of the k-value for P. silvestris in 1988 on IOgl~density of P. silvestris in 1987 (Y
=
0.11 -0.0098(X); R=
0.052; P=
0.577).Table 5. Survival offemale gypsy moth pupae in 1987 and 1988 when deployed over a 3-d period
Small mammal predation of gypsy moth pupae probably contributed to the disappearance of pu-pae under burlap in period 4 (Campbell & Sloan 1977 a, b; Elkinton et al. 1989). Pupal survival in 1988 was not significantly different from pupal survival in 1987 (J! = 0.50) based on the pupal predation of field deployed female pupae (Table 5).
Regression Analysis. The killing power of C.
concinnata in 1988 was not linearly related to the density of hosts parasitized by C. concinnata in 1987 (R2 =0.2209, P =0.240) (Fig. 2). These
results suggest that the generalist parasitoid, C.
concinnata, did not exhibit a between-generation numerical response as we expected given the requirement of this species for alternate hosts. However, a q,uadratic equation (Y = -2.38
+
1.17X - 0.13x"') provided a better fit for this data(R2 = 0.728, P = 0.0384) suggesting a weak nu-merical response.
The killing power of P.
silvestris
in 1988 also was not related by linear or by polynomial re-gression to the density of the specialist para-sitoid, P.silvestris,
in 1987(R
2=
0.052, P=
0,577) (Fig. 3). The lack of correlation between the density of P.
silvestris
in 1987 and the killing power of the same parasitoid in 1988 inconjunc-Plot lA IB 2A 2B 3A 3B 4A 4B Mean
Proportion of pupae surviving
1987 1988 0.27 0.56 0.34 0.65 0.34 0.73 0.50 0.19 0.36 0.40 0.60 0.50 0.38 0.15 0.62 0.08 0.43±0.12 0.41±0.23
tion with no increase in parasitism by P.
silves-tris
in plots receiving higher gypsy moth densi-ties in 1987 suggests that a between-generation numerical response by the specialist parasitoid did not occur and does not support our hypothe-sis.Discussion
Although each of the 10 plots had approxi-mately equivalent initial gypsy moth densities (500,000 neonates per hectare), their final densi-ties were quite variable, ranging from 0 egg masses per hectare in plot 4A to 325 egg masses per hectare in plot 2B. These results contrast with the final density estimates from 1987, where all experimental gypsy moth populations col-lapsed, with five of the eight plots having zero egg masses per hectare in postseason counts. The three plots with the greater number of egg masses in 1988, (lB, 2A, and 2B) were also the only plots to have egg masses in the 1987 post-season count. The estimated number oflarvae in these three plots at the beginning of 1988 was 20,000 larvae per hectare in IB and 13,000 larvae per hectare in each of2A and 2B (Moore & Jones 1987). These numbers are negligible compared with the 500,000 neonates per hectare added to these plots in 1988.
Site conditions could not have contributed to the divergent gypsy moth survival between years because the same plots were used in both years (Campbell & Sloan 1977b). However, environ-mental conditions were different between 1987 and 1988 and the effect of temperature and mois-ture on the developmental rate of both host and parasitoid populations needs to be more fully addressed. From examination of the minimum and maximum temperatures during both years it appears that the duration of the pupal period in 1988 was shorter than in 1987 by 2 d as predicted by the temperature-dependent growth model of
ENVIRONMENTAL ENTOMOLOGY 1162
<{
100
I
et::
90
w
80
0...
(f)
70
w
60
(f)
(f)
50
<{
:2
40
0
30
0
W
20
LL
0
10
0
0
Z
0-0
plot 2
.-.
plot 4
~-~
plot 6
A-A
plot 12
0-0
plot 13
.-.
plot 15
\l-\l
plot 17
~-~
plot 20
85-86
87-88
YEARS
Vol. 23, no. 5•
88-89
Fig.4. Gypsy moth population trends (egg masses per hectare) in western Massachusetts from 1985 through 1989.
Casagrande et al. (1987). A shorter pupal period in conjunction with equivalent daily rates of pre-dation on pupae (Table 5) could result in higher survival to the adult stage.
Another explanation for the difference in the number of gypsy moths surviving in 1987 and in 1988 would be the difference in parasitism levels in each year. In both years, the same four para-sitoid species were obtained from neld-collected gypsy moth larvae, however, overall mortality from parasitoids differed between years. C.
con-cinnata
caused the majority of mid-larval (be-tween third and nfth instar) gypsy moth mortality in 1987 and 1988. In 1987, C.concinnata
was also the primary mortality agent of last-instar and pupal gypsy moths, but P.silvestris
was the pri-mary mortality agent in this same period (period 3) in 1988. The reduction in parasitism by C.concinnata
in 1988 may reflect the current re-gional increase of gypsy moth densities (Fig. 4). Consequently, the strong spatial density-depen-dent response of C.concinnata
in 1987 may be damped out in 1988 because of less contrast be-tween experimental plots and surrounding gypsy moth densities. In general, the prevalence of C.concinnata
in 1988 supports past nndings that it is the dominant parasitoid in this geographic re-gion (Barbosa et al. 1975, Reardon 1976), espe-cially in terms of percentage of parasitism.The effect alternate-host densities may have on the density and distribution of C.
concinnata
has not been documented. Berryman (1991) sug-gests that a generalist parasitoid may switch to more abundant alternate hosts resulting in a first-order negative feedback or spatial density de-pendence. C.
concinnata
are multivoltine gener-alists (four generations per year) with one generation developing when gypsy moths are vulnerable to parasitism (Culver 1991, Sabrosky & Reardon 1976, Weseloh 1982). The high den-sity of C.concinnata
emerging from parasitized gypsy moth hosts in 1987 would require an equally high density of alternate hosts within our I-ha plots in order to overwinter. The fact that no C.concinnata
were recovered from either ground emergence traps or sticky traps located inside five of the plots may mean that C.concin-nata
dispersed away from our experimental plots in search of alternate hosts. We did not attempt to measure the density of alternate hosts but we did observe that another host of C.concinnata,
the forest tent caterpillar,Malacosoma disstria,
was abundant in our 1988 plots at the same time that gypsy moths were vulnerable to parasitism by C.concinnata.
We did not anticipate a between-generation numerical response by the multivoltine general-ist parasitoid, C.
concinnata.
The fact that aqua-dratic model fit the data better suggests that there are lower and upper limits to the number of lO'psy moths C.
concinnata
can parasitize as was suggested by Gould et a1. (1990) in relation to the density-dependent response of C.compsilura
in 1987. In conjunction, Berryman et a1. (1987) would predict a nonlinear second-order negative feedback for a multivoltine generalist. We did predict a between-generation numerical re-sponse by P.silvestris
because it is a univoltine specialist parasitoid and synchronized with gypsy moth, but our results indicate that parasit-ism in lO'psy moth populations, at least on the I-ha scale, is dominated by spatial responses and between-year effects are minor (Elkinton et a1. 1990). This raises the question of what is the most appropriate spatial scale to conduct such a study (Heads &Lawton 1983). It is possible that temporal density dependence would be ob-served on a larger regional scale. Our study il-lustrates a methodology for examining temporal density dependence experimentally as an alter-native or supplement to the classical approach of following populations over a long period of years.Acknowledgments
We are very grateful to C. Boettner and G. Boettner for field and technical assistance. We are also grateful to M. Abbell, S. Ambs,
J.
Catlin, E. Clark, G. Davis, L. McGlinchey, H. Nichols, B. Postier, W. Stratz, andJ.
Wells for field assistance and A. Bonser, C. Kish, and K. Murray for assistance in the laboratory. We thank A. DeVito for field assistance and P. Grinberg for research assistance and data entry from the Northeastern Forest Experiment Station in Hamden, CT. We also thank personnel from Maryland Forest Pest Management for their assistance in collecting egg masses, D. Argan-bright of the Department of Forestry and Wildlife at the University of Massachusetts for access to Cadwell Forest, and the Massachusetts District Commission for access to the Quabbin Reservoir. This research was supported by a cooperative agreement with U.S. Forest Service 23-142.References Cited
Abacus Concepts. 1990. Super ANOVA. Berkeley, CA.
Barbosa, P.,
J.
L. Capinera & E. A. Harrington. 1975. The gypsy moth parasitoid complex in westem Massachusetts: a study of parasitoids in areas of high and low host density. Environ. Entomo!. 4: 842-846.Beddington,
J.
R., C. A. Free &J.
H. Lawton. 1978. Characteristics of successful natural enemies in models of biological control of insect pests. Nature (Lond.) 273: 513-519.Bell, R. A., C. D. Owens, M. Shapiro &
J.
R. Tardif. 1981. Development of mass-rearing technology, pp. 599-633. In C. C. Doane & M. L. McManus[eds.], The gypsy moth: research toward integrated pest management. U.S. Dep. Agric. Tech. Bull. 1584.
Bellows, T. S., R. G. Van Driesche &
J.
S. Elkinton. 1992. Life-table construction and analysis in eval-uation of natural enemies. Annu. Rev. Entomo!. 37: 587-614.Berryman, A. A. 1991. Gypsy moth in North Amer-ica: a case of successful biological control? Tree 6: 110-111.
Berryman, A. A., N. C. Strenseth &A. S. Isaev. 1987. Natural regulation of herbivorous forest insect pop-ulations. Oecologia (Bed.) 71: 174-184.
Buonaccorsi,
J.
P. &J.
S. Elkinton. 1990. Estimation of contemporaneous mortality factors. Res. Popul. Eco!. 32: 151-171.Campbell, R. W. 1969. Studies on gypsy moth pop-ulation dynamics, pp. 29-34. In Proceedings, For-est Insect Population Dynamics Workshop, 1967. U.S. Dep. Agric. For. Servo Res. Pap. NE 125. Campbell, R. W. & R.
J.
Sloan. 1977a. Naturalreg-ulation of innocuous gypsy moth populations. En-viron. Entomo!. 6: 315-322.
1977b. Release of gypsy moth populations from in-nocuous levels. Environ. Entomol. 6: 323-330. Casagrande, R. A., P. A. Logan & W. E. Wallner.
1987. Phenological model for gypsy moth,
Lyman-tria dispar (Lepidoptera: Lymantriidae), larvae and pupae. Environ. Entomol. 16: 556-562.
Culver,
J.
J.
1919. A study of Campsilura cancin-nata, an imported Tachinid parasite of the gypsy moth and the brown-tail moth. U.S. Dep. Agric. Bull. 776: 1-26.Dempster,
J.
P. & E. Pollard. 1986. Spatial hetero-geneity, stochasticity and the detection of density dependence in animal populations. Oikos 46: 413-416.Elkinton,
J.
S.,J.
P. Buonaccorsi, T. S. Bellows &R. G. Van Driesche. 1992. Marginal attack rate, k-val-ues and density dependence in the analysis of con-temporaneous mortality factors. Res. Popul. Ecol. 34: 29-44.Elkinton,}. S.,}. R. Gould,A. M. Liebhold, H. R. Smith &W. E. Wallner. 1989. Are gypsy moth popula-tions in North America regulated at low density?, pp. 233-249. In W. E. Wallner [ed.], The Lyman-triidae: comparisons of features of new and old world tussock moths. U.S. Dep. Agric. For. Servo Gen. Tech. Rep. NE-123.
Elkinton,
J.
S.,J.
R. Gould, C. S. Ferguson, A. M. Liebhold & W. E. Wallner. 1990. Experimental manipulation of gypsy moth density to assess im-pact of natural enemies, pp. 275-287. InA. Watt, M. Hunter, S. Leather & N. Kidd [eds.], Population dynamics of forest insects. Intercept, Hampshire,U.K.
Gould, }. R., }. S. Elkinton & W. E. Wallner. 1990. Density dependent suppression of experimentally created gypsy moth, Lymantria dispar (Lepidop-tera: Lymantriidae), populations by natural ene-mies.
J.
Anim. Eco!. 59: 213-234.Hassell, M. P. 1985. Insect natural enemies as reg-ulating factors.
J.
Anim. Eco!. 54: 323-334.Hassell, M. P. & R. M. May. 1973. Stability in in-sect-host parasite models.
J.
Anim. Eco!. 42: 693-726.Hassell, M. P., T.R.E. Southwood & P. M. Reader. 1987. The dynamiCS of the viburnum whitefly
(Aleurotrachelus jelinekii): a case study of popula-tion regulapopula-tion.
J.
Anim. Ecol. 56: 283-300.1164 ENVIRONMENTAL ENTOMOLOGY Vol. 23, no. 5
Heads, P. A. &
J.
H. Lawton. 1983. Studies on the natural enemy complex of the holly leaf-miner: the effects of scale on the detection of aggregative re-sponses and the implications for biological control. Oikos 40: 267-276.Latto,
J.
&M. P. Hassell. 1988. Generalist predators and the importance of spatial density dependence. Oecologia (Berl.) 77: 375-377.Leonard, D. E. 1971. Air-borne dispersal of larvae of the gypsy moth and its influence on concepts of control. J. Econ. Entomol. 64: 638-641.
Liebhold, A. M. &
J.
S. Elkinton. 1988a. Tech-niques for estimating the density of late-instar gypsy moth, Lymantria dispar (Lepidoptera: Ly-mantriidae), populations using frass drop and frass production measurements. Environ. Entomol. 17: 381-384.1988b. Estimating the density of larval gypsy moth,
Lymantria dispar(Lepidoptera: Lymantriidae), us-ing frass drop and n-ass production measurements: sources of variation and sample size. Environ. En-tomol. 17: 385-390.
Montgomery, M. E. & W. E. Wallner. 1988. The gypsy moth a westward migrant. In A. A. Berryman [ed.], Dynamics of forest insect populations, pat-terns, causes and implications. Plenum, New York. Moore, K.E.B. & C. G. Jones. 1987. Field
estima-tion of fecundity of gypsy moth (Lepidoptera: Ly-mantriidae). Environ. Entomol. 16: 165-167. Murdoch, W. W. & A. Stewart-Oaten. 1989.
Aggre-gation by parasitoids and predators: effects on equi-librium and stability. Am. Nat. 134: 288-310. Murdoch, W. W.,
J.
D. Reeve, C. B. Huffaker & C. E.Kennett. 1984. Biological control of scale insects and ecological theory. Am. Nat. 123: 371-392. Polles, S. G. &
J.
A. Payne. 1972. An improvedemergence trap for adult pecan weevils.
J.
Econ. Entomol. 65: 1529.Reardon, R. C. 1976. Parasite incidence and ecolog-ical relationships in field populations of gypsy moth larvae and pupae. Environ. Entomol. 5: 981-987. Reeve,
J.
D. & W. W. Murdoch. 1985. Aggregationby parasitoids in the successful control of the
Cali-fornia red scale: a test of theory.
J.
Anim. Ecol. 54: 797-816.Royama, T. 1981. Evaluation of mortality factors in insect life table analysiS. Ecol. Monogr. 5: 495-505. Sabrosky, C. W. & R. C. Reardon. 1976. Tachinid parasites of the gypsy moth, Lymantria dispar,with keys to adults and puparia. Misc. Pub I. Entomol. Soc. Am. 10: 126.
SAS Institute. 1987. SAS user's guide: statistics. SAS Institute, Cary, NC.
Smith, H. R. & R. A. Lautenschlager. 1981. Gypsy moth predators, pp. 96-124. In C. C. Doane & M. L. McManus [eds.], The gypsy moth: research toward integrated pest management. U.S. Dep. Agric. Tech. Bull. 1584.
Stewart-Oaten, A. & W. W. Murdoch. 1990. Tem-poral consequences of spatial density dependence.
J.
Anim. Ecol. 59: 1027-1045.Varley G. C. G. R. Gradwell &M. P. Hassell. 1973. Ins~ct po~ulation ecology: an analytical approach. University of California Press, Berkeley.
Weseloh, R. M. 1981. Relationship between colored. sticky panel catches and reproductive behavior of forest tachinid parasitoids. Environ. Entomol. 10: 131-135.
1982. Implications of tree microhabitat preferences
ofCompsilura concinnata, Diptera: Tachinidae, for its effectiveness as a gypsy moth, Lymantria dispar,
parasitoid. Can. Entomol. 114: 617-622.
Williams, D. W., R. W. Fuester, W. W. Metterhouse, R.
J.
Balaam, R. H. Bullock, R.J.
Chianese & R. C. Reardon. 1992. Incidence and ecological relationships of parasitism in larval populations ofLymantria dispar (Lepidoptera: Lymantriidae). BioI. Control 2: 35-43.
Woods, S. A. &
J.
S. Elkinton. 1987. Bimodal pat-terns of mortality from nuclear polyhedrosis virus in gypsy moth (Lymantria dispar) populations.J.
In-vertebr. Pathol. 50: 151-157.Received for publication 2 November 1993; ac-cepted 5 May 1994.