HAL Id: hal-01436778
https://hal.archives-ouvertes.fr/hal-01436778
Submitted on 18 Jan 2017
HAL is a multi-disciplinary open access
archive for the deposit and dissemination of
sci-entific research documents, whether they are
pub-lished or not. The documents may come from
teaching and research institutions in France or
abroad, or from public or private research centers.
L’archive ouverte pluridisciplinaire HAL, est
destinée au dépôt et à la diffusion de documents
scientifiques de niveau recherche, publiés ou non,
émanant des établissements d’enseignement et de
recherche français ou étrangers, des laboratoires
publics ou privés.
Graph Structuring of Skeleton Object for Its High-Level
Exploitation
Rabaa Youssef, Anis Kacem, Sylvie Sevestre-Ghalila, Christine Chappard
To cite this version:
Rabaa Youssef, Anis Kacem, Sylvie Sevestre-Ghalila, Christine Chappard. Graph Structuring of
Skeleton Object for Its High-Level Exploitation. 12th International Conference on Image Analysis
and Recognition (ICIAR 2015), Jul 2015, Niagara Falls, ON, Canada. pp.419 - 426,
�10.1007/978-3-319-20801-5_46�. �hal-01436778�
Graph structuring of skeleton object for its
high-level exploitation
Rabaa Youssef1,2, Anis Kacem2, Sylvie Sevestre-Ghalila2, Christine Chappard3
1. COSIM, University of Carthage, Cit´e Technologique des Communications, Tunisia 2. CEA-LIST CEA-LinkLab, Cit´e Technologique des Communications, Tunisia 3. B2OA, UMR CNRS 7052, Universit´e Paris Diderot, PRES Sorbonne Paris Cit´e,
Paris, France
Abstract. Skeletonization is a morphological operation that summa-rizes an object by its median lines while preserving the initial image topology. It provides features used in biometric for the matching process, as well as medical imaging for quantification of the bone microarchitec-ture. We develop a solution for the extraction of structural and morpho-metric features useful in biomorpho-metric, character recognition and medical imaging. It aims at storing object descriptors in a re-usable and hier-archical format. We propose graph data structures to identify skeleton nodes and branches, link them and store their corresponding features. This graph structure allows us to generate CSV files for high level anal-ysis and to propose a pruning method that removes spurious branches regarding their length and mean gray level. We illustrate manipulations of the skeleton graph structure on medical image dedicated to bone mi-croarchitecture characterization.
1
Introduction
Skeletonization is used in various applications such as biometrics [1,2], medi-cal imaging [3,4,5] and character recognition [6] since it provides features that enables user to access high-level analysis of the image objects. In fact, object matching methods based on skeleton features are used in biometric identifica-tion through minutiae comparison of hand vein [1] or digital fingerprint [2], in bronchial airway trees monitoring [5], in symbols identification [7] and in char-acter recognition [6]. In addition, classification methods using morphometric features extracted from skeleton helps diagnose osteoporosis [4] and osteoarthri-tis [3] diseases.
Graph-based representation of the skeleton is widely investigated for matching issues since the correspondence between skeleton branches with graph edges and nodes with its vertices is natural and intuitive. The proposed solutions in the literature are based on shock graphs [7] or attributed relational graphs [9]. These representations based on adjacency matrix can only consider acyclic graphs which restricts the application domains.
Our contribution is to develop a solution for the exploitation of skeleton features in binary and grayscale domain and to save them in a re-usable format easily
manipulated. We propose to construct a graph able to represent any skeleton and to store its structural and morphometric features. To this purpose, we identify skeleton with multigraph [10] where multiple edges between nodes and emer-gence of mass of junctions are permitted. We store the skeleton structural and morphometric features in data structures that link graph vertices to their adja-cent edges. This solution allows us to manipulate the skeleton information and to implement a pruning procedure that takes into account not only segments lengths but also their average gray values in order to decide which branches are spurious and thus, delete them. The use of this contribution is illustrated in the context of medical application that cover almost all usable features.
This work is composed of five sections. The first one presents skeleton features for medical application which covers biometric and character recognition struc-tural features. The second section describes the used topological definitions for the graph construction. The third section is devoted to the graph data struc-tures proposed in this work. The fourth section is dedicated to the implemented pruning and the manipulation of the structured graph skeleton on image of subchondral bone in the tibial knee with the aim of characterizing its microar-chitecture.
2
Skeleton features in medical imaging
Concerning the characterization of bone microarchitecture, studies has shown that bone changes from a healthy person to a person with osteoporosis [4] or osteoarthritis [3]. These changes are quantified using morphometric parameters of bone microarchitecture such as the number of pixels of the skeleton, the half-width and the length of trabeculae, the number of trabeculae and the number of nodes and ends. These morphometric parameters covers also structural de-scriptors (detection of nodes and extremities) used in biometric and character recognition applications [1] [2] [6]. We notice that skeletonization methods used to extract features for applications cited above are binary or gray. Consequently, we choose to make this feature extraction tool applicable on both types of skele-ton. Furthermore, we notice that skeleton gray levels are not actually exploited. We propose to consider in the extracted features the segment mean gray level which is useful for the pruning of insignificant skeleton branches.
3
Identification of topological configurations
First of all, we need to identify the topological nature of each skeleton point in order to position it in the graph. A skeleton is formed of ridge, junction and end pixels. A ridge is a skeleton pixel placed on a crest line that splits the local background in 2 4-connected components. A junction splits the local background to 3 or 4 4-connected components and an end is a skeleton pixel with a unique skeleton neighbor.
x x x x x x x x x x x x x x x x x
ridge end junction junction mass of junctions
Fig. 1.Topological configurations of skeleton pixels.
Our graph proposal is designed to accept as input any type of skeleton. To do so, it is important to identify critical situations that a conventional graph cannot handle. Indeed, a skeleton could have a mass of junctions that cannot be thinned. In Figure 1, pixels noted x and identified as mass of junctions divide the back-ground in two 4-connected components according to their 8-neighbors. However, these pixels belong to a mass of nodes that should be entirely considered as a unique junction. In the literature, an erosion at nodes is performed before the construction of adjacency matrix in order to eliminate such configurations and to avoid a cyclic graph. A decomposition of the possible mass junctions in 3 × 3 configurations (with rotations) is made for our proposal in order to identify these pixels when processing the skeleton for graph construction. Once the ambiguous configurations identified, we can proceed with the construction of graph data structures.
4
Graph construction
Since we intend to conceive a graph that takes into account any kind of skele-ton, simple graphs constructed using an adjacency matrix are not appropriate. A graph with multiple edges (multigraph) that manages mass of junctions and stores other morphometric features of skeleton branches is chosen in this work. We detail in the next the data structures used to construct the proposed multi-graph and the linking step that permits to connect multi-graph vertices and edges. 4.1 Data structures for the graph construction
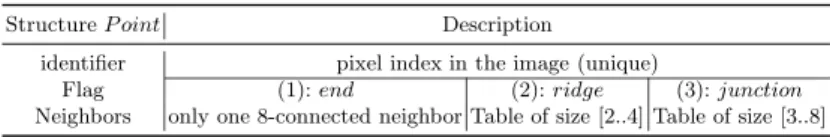
First, we define in Table 1 P oint data structure that differentiates end, junction and ridge pixels and establish a primary link between current pixel and its direct skeleton neighbors.
Table 1.Data structure: P oint Structure P oint Description
identifier pixel index in the image (unique)
Flag (1): end (2): ridge (3): junction Neighbors only one 8-connected neighbor Table of size [2..4] Table of size [3..8]
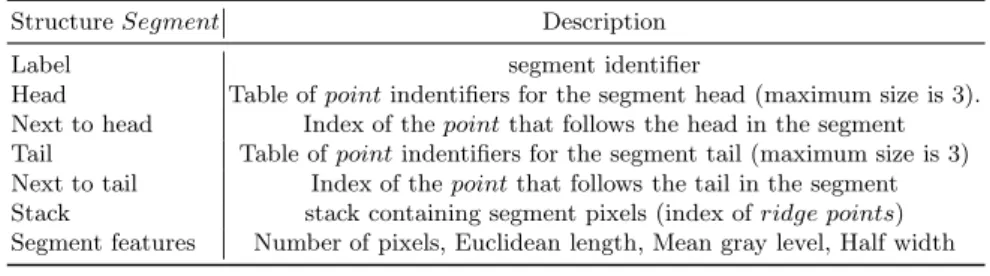
Having defined the point structure, we can define the Segment structure that corresponds to a graph edge. Intuitively, a segment has two extremities. There are 3 types of segments. The first one has two free extremities. The second has its extremities identified as junctions and the third one has a free end and a junction at its respective extremities. Therefore, we need to identify the segment extremities in the data structure in order to point out the segment type. The data structure segment is defined by the attributes listed in Table 2.
Table 2.Data structure: Segment
Structure Segment Description
Label segment identifier
Head Table of point indentifiers for the segment head (maximum size is 3).
Next to head Index of the point that follows the head in the segment
Tail Table of point indentifiers for the segment tail (maximum size is 3)
Next to tail Index of the point that follows the tail in the segment
Stack stack containing segment pixels (index of ridge points)
Segment features Number of pixels, Euclidean length, Mean gray level, Half width
Tail and head attributes correspond to segment extremities. These attributes are useful to establish links between graph edges. Since our solution is intended to be general, covering all types of skeleton graph, we consider segments having multiple heads and tails as illustrated by Figure 2.(a). Hence, we choose for the head attribute (respectively tail) an array of points of size 3.
J1 J2 J3 1 2 3 4 5 6 A B C D E 1 2 2 2 3 3 3 4 5
(a): 3 junctions in red (b): Multiple segments for the ”head” of segment 1 between two junctions
Fig. 2.Particular situations for segment structure. In blue: segment end. In red: seg-ment head (or tail) labeled as junction. In yellow: segseg-ment ridge point.
Furthermore, and unlike graphs based on adjacency matrix that cannot han-dle loops, we get our solution to consider a general case that defines more than one segment between two nodes. Consequently, we add two other attributes to the data structure, which are ”Next to head” and ”Next to queue” in order to distinguish the multiple segments appearing between two junction pixels. Such a case is illustrated by Figure 2.(b).
4.2 Linking step for segment structure
This module enables the implementation to fill point data structures and then, create segment structures by browsing the skeleton. It proceeds by first search-ing for graph nodes (junctions or ends) and second, by monitorsearch-ing the ridge pixels of the same segment structure. Using the “neighbor” attribute stored in the point structure, it is possible to follow the segment and fill its remaining attributes. A stop condition of filling a segment is the detection of an end or other junction. This means that the linking step reached the end of the seg-ment, can finally calculate its features and move to the next segment via the “tail” attribute. Figure 3 illustrates an example of segments attributes obtained for the binary skeleton sample of Figure 2.(b).
Attributes Seg 1 Seg 2 Seg 3 Seg 4 Seg 5
Label 1 2 3 4 5 Head C A A B B Next to head 1 2 6 5 9 Tail A B B D E Next to tail 1 4 8 5 9 Stack 1 2, 3, 4 6, 7, 8 5 9 Number of pixels 3 5 5 3 3 Euclidean length 2 ·√2 2 + 2 ·√2 2 + 2 ·√2 1 +√2 2 ·√2 Average gray level 255 255 255 255 255
Fig. 3.Segments data structures for image from Figure 2.(b).
Finally, the flow chart of Figure 4 resumes the complete processing stages for the extraction of skeleton features. The graph construction is applicable to gray or binary skeleton resulting from any method of the literature.
5
Pruning as an application of graph structuring
Skeletonization methods, and especially homotopic thinning are often subject to the emergence of spurious branches. For better reliability of results and perti-nence of analysis, a pruning step is performed to eliminate these branches. In some applications, it is the orientation of the segment that indicates its ”signif-icance”. However, orientation cannot be pertinent for microarchitecture quan-tification since trabeculae moves in various directions. Through experiments, we notice that the average gray level of spurious branches is informative and generally smaller than the average gray level of significant ones. We propose to implement a pruning procedure based on our graph construction that takes into account not only the length but also the mean gray value of segments to suppress noisy branches. In fact, according to the resulting skeletons of Figure 5 and their respective features, we can establish an upper threshold for segment lengths and gray values at a fixed percentile (50% in this case). These thresholds adequately adjusted permit to detect spurious branches and delete them in both cases.
Original image Skeleton 1 Skeleton 2
Features for segments with free ends Percentile(50%)
Skeleton 1 Pixelwise length 5
Mean gray level 183,38
Skeleton 2 Pixelwise length 6
Mean gray level 120,72
Pruning 1 Pruning 2
Fig. 5. Results of gray skeletonization using methods published in [11] and in [12]. Color intensity (white to blue) reflects segments lengths.
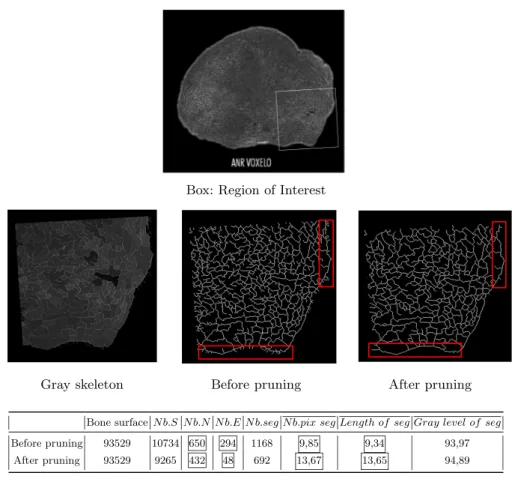
An application of such process is performed on high resolution peripheral computed tomography (HR-pQCT) slice image from Voxelo project1
as
illus-1
trated in Figure 6. We note respectively N b.S, N b.N , N b.E, N b.seg the number of skeleton pixels, nodes, ends and segments, and N b.pix seg, Length of seg, Gray level of seg the mean pixelwise length, euclidian length an gray level of segments. We observe in the update of skeleton features a gain in pertinence after pruning spurious branches while preserving significant trabeculae.
Box: Region of Interest
Gray skeleton Before pruning After pruning
Bone surface N b.S N b.N N b.E N b.seg N b.pix seg Length of seg Gray level of seg Before pruning 93529 10734 650 294 1168 9,85 9,34 93,97
After pruning 93529 9265 432 48 692 13,67 13,65 94,89
Fig. 6.Skeleton pruning of the trabecular microarchitecture in a slice image of suchon-dral bone in tibial knee: Gain in relevance of features.
6
Conclusion
The proposed graph construction applies to binary and gray skeletons and fa-cilitate a high level manipulation of the skeleton via the structural and mor-phometric features it stores. The analysis of the trabecular microarchitecture aiming to differentiate normal bone from osteoarthritis is an example of skeleton graph structure usefulness. The pruning procedure exploiting graph and skeleton features eliminates efficiently spurious branches according to thresholds of the
mean gray level and length of segments. This high level skeleton manipulation can be used in biometric and character recognition applications in the match-ing process. Our perspective is to create a GUI for easy handlmatch-ing of the graph: tracking lines, measuring distance between nodes/edges, updating interactively the features. In addition, other features such as branches orientation could be easily added to the data structure segment in order to monitor skeleton lines and add another optional threshold to the pruning.
Acknowledgments
This work is financed by ANR Voxelo TECS-0018.
References
1. Zhu, X. and Huang, D.: Hand Dorsal Vein Recognition Based on Hierarchically Structured Texture and Geometry Features. Biometric Recognition, 7701:157-164 (2012).
2. Zhao, F. and Tang, X.: Preprocessing and postprocessing for skeleton-based fin-gerprint minutiae extraction. Pattern Recognition, 40(4):1270-1281 (2007). 3. Chappard, C., Peyrin, F., Bonnassie, A., Lemineur, G., Brunet-Imbault, B.,
Lespes-sailles, E. and Benhamou, C.L.: Subchondral bone micro-architectural alterations in osteoarthritis: a synchrotron micro-computed tomography study. Osteoarthritis and Cartilage, 14(3):215-223 (2006).
4. Sevestre-Ghalila, S., Benazza Benyahia, A., Ricordeau, A., Mellouli, N. and Chap-pard, C.: Texture Image Analysis for Osteoporosis Detection with Morphological Tools. In: Medical Image Computing and Computer-Assisted Intervention MIC-CAI, 3216:87-94 (2004).
5. Tschirren, J., Pal`agyi, K., Reinhardt, J.M., Hoffman, E.A. and Sonka, M.: Shock Segmentation, Skeletonization, and Branchpoint Matching A Fully Automated Quantitative Evaluation of Human Intrathoracic Airway Trees. In: Medical Image Computing and Computer-Assisted Intervention MICCAI, 2489:12-19 (2002). 6. Wshah, S., Zhixin, S. and Govindaraju, V.: Segmentation of Arabic Handwriting
Based on both Contour and Skeleton Segmentation. In: 10th International Confer-ence on Document Analysis and Recognition -ICDAR, 793-797 (2009).
7. Siddiqi, K., Shokoufandeh, A., Dickenson, S.J. and Zucker, S.W.: Shock graphs and shape matching. In: 6th International Conference on Computer Vision, 222-229 (1998).
8. Xiang, B. and Latecki, L.J.: Path Similarity Skeleton Graph Matching. IEEE Transactions on Pattern Analysis and Machine Intelligence, 30(7):1282-1292 (2008).
9. Di Ruberto, C.: Recognition of shapes by attributed skeletal graphs. Pattern Recog-nition, 37(1):21-31 (2004).
10. Gross, J.L. and Yellen, J.: Graph Theory and Its Applications, Second Edition (Discrete Mathematics and Its Applications). Chapman & Hall/CRC (2005). 11. Youssef, R., Sevestre-Ghalila, S. and Ricordeau, A.: Statistical control of thinning
algorithm with implementation based on hierarchical queues. In: 6th International Conference of Soft Computing and Pattern Recognition -SoCPaR, 365-370 (2014). 12. Couprie, M., Bezerra, F.N. and Bertrand, G.: Grayscale image processing using

![Fig. 5. Results of gray skeletonization using methods published in [11] and in [12].](https://thumb-eu.123doks.com/thumbv2/123doknet/13012280.380708/7.892.263.666.558.918/fig-results-gray-skeletonization-using-methods-published.webp)