HAL Id: cea-02931634
https://hal-cea.archives-ouvertes.fr/cea-02931634
Submitted on 7 Sep 2020
HAL is a multi-disciplinary open access
archive for the deposit and dissemination of
sci-entific research documents, whether they are
pub-lished or not. The documents may come from
teaching and research institutions in France or
abroad, or from public or private research centers.
L’archive ouverte pluridisciplinaire HAL, est
destinée au dépôt et à la diffusion de documents
scientifiques de niveau recherche, publiés ou non,
émanant des établissements d’enseignement et de
recherche français ou étrangers, des laboratoires
publics ou privés.
Flash-induced ATP synthesis in pea chloroplasts in
relation to proton flux
Claire Lemaire, Guy Girault, J.M. Galmiche
To cite this version:
Claire Lemaire, Guy Girault, J.M. Galmiche. Flash-induced ATP synthesis in pea chloroplasts in
relation to proton flux. Biochimica biophysica acta (BBA) - Bioenergetics, Elsevier, 1985, 807 (3),
pp.285 - 292. �10.1016/0005-2728(85)90260-9�. �cea-02931634�
Elsevier
BBA 41750
Flash-induced A T P synthesis in pea chloroplasts in relation to proton flux
C. Lemaire, G. Girault and J.M. Galmiche *
Service de Biophysique, C.E.N. Saclay, 91191 Gif-sur- Yvette Cedex (France)
(Received November 5th, 1984)
Key words: ATP synthesis; ATP synthase; Proton flux; (Pea chloroplast)
Chloroplasts extracted from preilluminated pea seedling leaves have an active ATP synthase. Single turnover flashes induce ATP synthesis in these chloroplasts. This synthesis has been measured by the luminescence of the luciferin-luciferase assay system and the absorbance changes at 515 nm monitored to determine the concomitant proton flux through the ATP-synthase. Variations in the ratio H + / A T P are observed and can be explained by the way ATP synthase is operating. The newly synthesized ATP molecules remain bound to the enzyme, and have variable probabilities to be hydrolysed or released from the enzyme, dependent upon the energized state of the membranes. The lowest value found for the ratio, H + / A T P , is 1.90 + 0.55, which should be very close to the true value.
Introduction
ATP synthesis on the ATP synthase is reversi- bly coupled to an H + efflux across the thylakoid membranes, as has been proposed by Mitchell [1]. Thermodynamic considerations have suggested that a minimum of 2.5-3 protons must be trans- ferred, through the ATP synthase for each ATP molecule synthesized [2,3]. This H ÷ / A T P ratio has also been determined experimentally under different conditions: during post-illumination ATP synthesis a ratio of 2.5 was found [4]; in stationary photophosphorylation a ratio of 2 - 3 has been reported [5,6]; in flash-induced ATP synthesis a mean value of 3.2 was found [7], and external p H was shown to modulate this value [8]. A ratio of 3 was determined for the reverse reaction, ATP hy- drolysis [9]. The largest uncertainty in these mea- surements of the proton flux across the ATP syn- thase was the corrections for the proton basic
* To whom correspondence should be addressed. Abbreviation: Pi, inorganic phosphate.
conductance of the membrane, not linked to ATP synthesis. Further, actual ATP synthesis must be determined by taking into account the concom- itant ATP hydrolysis [9].
Chloroplasts prepared from preilluminated leaves have an active ATP synthase [10,11]. With these chloroplasts we followed, by monitoring the luminescence of the luciferin-luciferase system, the ATP synthesis on separate flashes or groups of flashes [11], given at a frequency of 0.1 Hz. This method offered the convenience of measuring the actual flash-induced ATP synthesis corrected for the dark hydrolysis of ATP. Moreover, the con- comitant proton efflux across the membrane could also be determined from the first derivative of the dark decay of the absorbance changes at 515 nm, AA515, as a function of time [7]. We already [11] reported variations in the yield of ATP synthesized per flash as a function of the external p H and of the dark period, tD, between two successive flashes of the flash group. The synthesis of ATP was generally independent on the number of flashes already fired. But with some preparations we ob- served a lower synthesis of ATP on the first flash 0005-2728/85/$03.30 © 1985 Elsevier Science Publishers B.V. (Biomedical Division)
286
a n d a progressive increase on the following flashes, until a limit was reached after the 5 t h - 1 0 t h flashes. In this report we have examined the question whether the ratio H + / A T P varies with the ob- served yield of A T P synthesized per flash.
We have found that variations of the ratio H + / A T P do occur following the way flashes are given. These variations are explained by the fate Of the A T P molecules b o u n d to the site where they just have been synthesized. These A T P molecules exhibit different probabilities either to be released (and detected by the luciferin-luciferase system in the external m e d i u m as A T P ) or to be hydrolysed into A D P and inorganic phosphate, P~. The lowest observed value of H + / A T P is 2 and should be very close to the true value.
Materials and Methods
Procedures were essentially the same as those reported in Ref. 11. T y p e B chloroplasts [12] with active A T P synthase were prepared from preil- luminated leaves of pea seedlings. Experiments were done in h y p o t o n i c medium. A b s o r b a n c e changes at 515 nm, atebrin fluorescence for A p H determinations and luminescence of the luciferin- luciferase system for A T P measurements were fol- lowed c o n c o m i t a n t l y in three different samples of the same chloroplasts suspension. The saturating flashes had a 2 ffs half-time.
T w o modifications were introduced. Firstly, c o n c e n t r a t i o n of atebrin in all experiments was 0.5 ffM, and not 2.5 ffM. At this concentration there was no inhibition of the A T P synthesis. Secondly, for all AAs15 measurements, except for those with groups of two flashes separated by different dark times, t o , the sample was exposed to the measur-
ing beam only during the time of the absorbance measurement at 515 nm, e.g., during 1 s in every 10 s. W h e n the measuring beam was switched off, the photomultiplier was illuminated by a photodi- ode to maintain the accuracy of its response.
Calibration of the luciferin-luciferase reaction was done by at least two subsequent additions of 200 picomol A T P from a solution m a d e from a s t a n d a r d kit LKB. Solutions were kept frozen and used only for 1 d a y experiment after thawing. A calibration by this m e t h o d allowed us to determine a nucleotide c o n c e n t r a t i o n in the A D P solutions
used in perfect a c c o r d a n c e with the determination m a d e from their a b s o r b a n c e at 260 nm.
With those chloroplasts where A T P a s e is active addition of A D P in the m i c r o m o l a r range, in the absence of inorganic phosphate, does not decrease the m e m b r a n e permeability, c o n t r a r y to what has been observed by P. G r a b e r et al. [13], but in- creases even slightly the AA515 dark decay. So we measured the basic charge flux through the mem- brane in experiments where A D P and Pi w e r e omitted. Calculation of the p r o t o n flux across the m e m b r a n e was done, as in Ref. 7, from the total charge flux measured in experiments in the pres- ence of A D P and Pi by subtracting the basic charge flux measured at the same AAs~ 5 extent in experiments in the absence Of A D P and P~.
F r o m the work of Telfer et al. [14] who used the same material, and by using the absorbance change at 820 nm ( A e = 6 5 0 0 M - 1 . c m 1) measured by Mathis and Setif [15] for P-700 oxidation we find
"!~1 ,l~. M . ; ~ . 2 0 0 0 t r 1000
I
I
0 1 sFig. 1. AAS15 induced by a group of six flashes, 3 ms apart. Upper curve corresponds to experiments in the absence of ADP and Pi, lower curve in the presence of ADP and Pi"
Tangents were drawn at points M and N. Their slopes allow to calculate the charge efflux rates. The curves are the mean values of ten signals (signals observed after the 3rd to the 7th flash group in two different experiments). Conditions were: 40 mM Tricine (pH 8), 10 mM MgCO 3, 20 mM KHCO 3, 5 p.M diadenosylpentaphosphate, 0.5/~ M atebrin and 2 mM K 2 HPO4 with 20 t~M ADP when present. Chloroplasts were equivalent to 40 ~g of chlorophyll in the 2 ml sample. Temperature was IO°C.
one P-700 is oxidized after one single saturating flash per 525 + 50 chlorophylls. In those pea chlo- roplasts there is always one P-700 per P-680. So we inferred that the AA515 induced by a single saturating flash corresponded to one electron or two protons transferred per 525 + 50 chlorophylls more especially as under conditions of our experi- ments there was no slow rise of the AA515.
By using this AA515 calibration the charge ef- flux through the membrane was determined from the first derivatives of the AAs] 5 dark decay. The first derivatives were calculated with the multisam- pier analyser IN 45 (Intertechnique) used to store the signals. In Fig. 1, the proton flux through the ATPase was cah'ulated from the first derivative at point M minus the one at point N. In experiments where the AA515 extent in the presence of ADP and Pi was lower than the last AA5~ 5 extent mea- sured in the absence of ADP and P~ (time above t s in Fig. 1), a null value was taken for the basic charge flux. The first derivative differences were plotted as a function of time, and integration was done graphically. The area was expressed in num- ber of protons excreted per 1000 chlorophylls.
Results and Discussion
On ADP addition in the dark we always ob- served, in the chloroplast suspension, an ATP synthesis which was followed by an ATP hydroly- sis. After 5 min equilibration in the dark, the ATP level was approx. 1-2% of the ADP concentration. On every flash or group of flashes ATP concentra- tion sharply increased, then decreased slowly dur- ing the 9 s dark period between the flashes or flash-groups (Fig 2a). Even at this low frequency (0.1 Hz) we measured an acidification of the inter- nal compartment of the thylakoids. The proton deposition increased with the number of flashes or flash-groups already fired until a constant level was reached (Fig. 2b). There was no significative difference between the ApH observed in the pres- ence or in the absence of ADP and inorganic phosphate (Table I).
Onset of photophosphorylation and H +/ A TP value
Fig. 3 shows the progressive increase in the yield of ATP synthesis by groups of two flashes, 10 ms apart, fired at 0.1 Hz frequency as a func-
Fig. 2. Flash-induced A T P synthesis and A p H changes. (a) A T P synthesis induced by single flashes (lower trace) or groups of six flashes, 3 ms apart (upper trace), given at the frequency of 0.1 Hz. (b) Concomitant A p H measurements reported by quenching of the atebrin fluorescence. I , groups of six flashes, 3 ms apart; O, single flashes. Conditions were as in Fig. 1. A T P concentrations and A p H measurements are plotted as a func- tion of the n u m b e r of single flash or flash-group already fired.
a , I - ,K
/
, /
el I-- 0.5 A * i I ~ i L 1 2 3 4 5 6 7 FLASH G R O U P N U M B E RFig. 3. ATP yield and H + / A T P ratio after a group of two flashes, 10 ms apart, as a function of the n u m b e r of the flash group. Groups of two flashes, 10 ms apart were given at the frequency of 0.1 Hz. II, A T P synthesized per 1000 chlorophylls and per flash group; O, concomitant H + / A T P ratio. Condi-
tions were as in Fig. 1. R e s u l t s w e r e the m e a n value of five
288
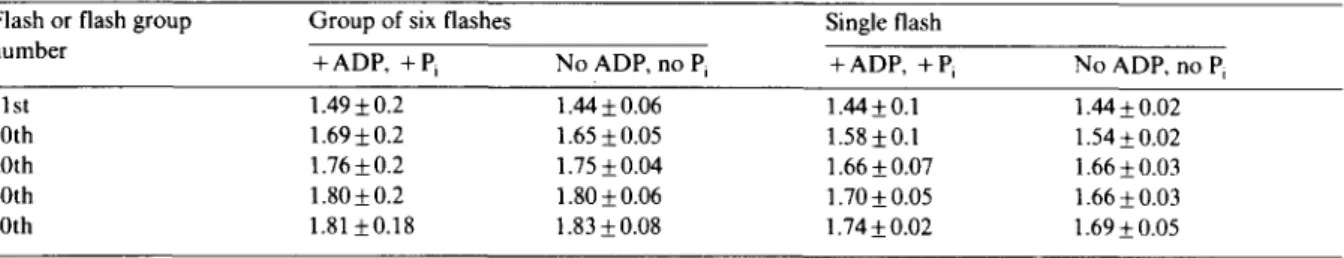
TABLE I
ApH OBSERVED AS A F U N C T I O N O F THE N U M B E R OF FLASHES OR FLASH G R O U P S ALREADY F I R E D
Conditions were as in Fig. 2. Measurements were done just before the given flash or flash group was fired. Results were the mean value of respectively 11, 4, 3 and 2 determinations (from the left to the right column).
Flash or flash group Group of six flashes Single flash
number
+ ADP, + Pi No ADP, no Pi + ADP, + Pi No ADP, no Pi
I st 1.49 + 0.2 1.44 +_ 0.06 1.44 _+ 0.1 1.44 + 0.02
10th 1.69:2 0.2 1.65 + 0.05 1.58 _+ 0.I 1.54 + 0.02
20th 1.76 + 0.2 1.75 + 0.04 1.66 + 0.07 1.66 + 0.03
30th 1.80 + 0.2 1.80 + 0.06 1.70 + 0.05 1.66 + 0.03
40th 1.81 + 0.18 1.83 + 0.08 1.74 + 0.02 1.69 + 0.05
tion of the number of the flash group. The yield of A T P synthesized per 1000 chlorophylls per flash- group increased from 0.22 for the first group, to a constant yield of 0.65 after the fifth group. There was no concomitant increase of the dark ATPase activity. The ratio of H + / A T P remained constant between 3.54 and 4.3.
The increase of the A T P yield cannot be ex- plained by a change in the number of activated A T P synthase molecules, as the dark A T P hy- drolysis remained constant. More likely a critical energy threshold for ATP synthesis is overcome by progressive deposition of protons inside the thylakoids, following the number of flash-groups already fired, as we have already shown [16].
H + / A T P value after a group of two flashes as a function of the dark time, t o , between the two flashes
We already reported [11] that A T P synthesis after a group of two flashes, t o ms apart, was more than twice that observed after a single flash when flashes and flash groups were fired at the same frequency, 0.1 Hz. That was particularly obvious at external p H 7. The A T P yield per flash group varied as a function of the dark time t o between the two flashes of the group, and was maximal for a t D value of 500 ms at p H 7 and 1000 ms at p H 8.
The ratio H + / A T P varied conversely to this A T P yield and was higher after a single flash than after a flash group, especially at external p H 7 (Fig. 4). At first sight the constant stoichiometry between H ÷ and ATP, predicted by the t h e m -
iosmotic theory, is not fulfilled, and the efficiency of the proton transfer through the ATP synthase seems variable. But we must notice that the A T P synthesized per flash corresponds to around 0.5 A T P per 1000 chlorophylls or 0.4 ATP per A T P s y n t h a s e m o l e c u l e [17]. B e s i d e s t h e luciferin-luciferase system detects only the A T P free in solution and not the newly synthesized A T P molecules which remain bound to the A T P
' 1 ' ' I ' ' I ' ' ' I ' ' I ' ' I ' ' ' pH 7 p H 8 j m . m m L ( i ¢ 1 / I 0.5 "., .. m s •
o,~ ..to
5 " ' l e J - o e l • 0 i i , i i , , I i i i i i n I I b I f , , 1 0 100 1000 10 100 1000 t o m sFig. 4. ATP yield and H + / A T P ratio after groups of two flashes, t D ms apart, as a function of t D. Groups of two flashes, t D ms apart, were fired at the frequency of 0.1 Hz. m, ATP synthesized per 10000 chlorophylls per flash group; o, Concomitant H + / A T P ratio. Conditions were as in Fig. 1. For t o = 0 the measurements were done after single flashes fired at the same frequency, 0.1 Hz.
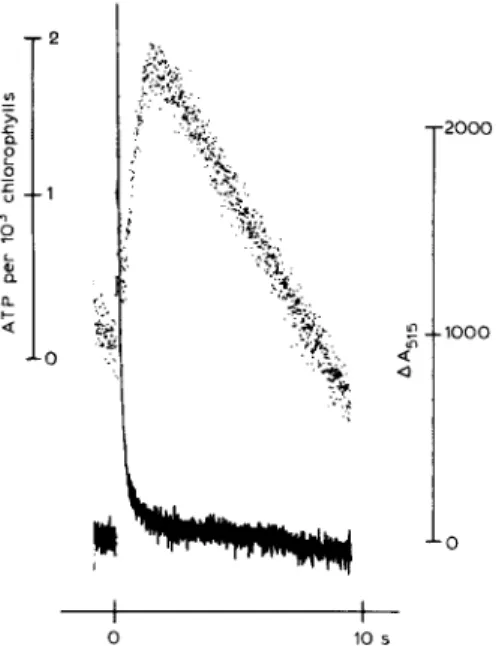
synthase. The response of the luciferin-luciferase system is so limited by A T P diffusion from the sites where it has been synthesized. Fig. 5 shows that after a flash group the luminescence change, measuring the subsequent ATP concentration in- crease, takes about 1.6 s to arrive to completion (response time at half saturation, around 0.8 s). This bound A T P can be either released in the medium, or hydrolysed during the dark time be- tween the flashes or the flash groups.
The A T P synthase is a multisite enzyme [18]. We propose that the synthesis of ATP on one site of the ATP synthase facilitates the release of the previously synthesized A T P bound to another site of the same enzyme molecule. We have some hints to predict such a flip-flop mechanism for ATP hydrolysis on the soluble part, CF 1, of the ATP synthase [19]. Thus the ATP synthesized after the first flash of the group is released when a new A T P is synthesized after the second flash and does not experience hydrolysis to A D P and Pi. In this way we can explain the lower ratio H + / A T P after
. 2 . . 0 I • "t4t~:
',.~:~.
.-:~-~ '~?~.:?~
-2000 - I 0 0 0 -O I I 0 10 sFig. 5. Absorbance changes at 515 nm and luminescence of the luciferin-luciferase system as a function of the time after a flash group. Groups of six flashes, 3 ms apart, were fired at frequency of 0.1 Hz. Conditions were as in Fig. 2, but chloroplast concentration was equivalent to 40 /tg of chlorophyll per ml. AA515, continuous line, was the mean value of ten consecutive determinations and luminescence, dotted line, the mean value of 40 determinations.
a flash group rather than a single flash.
When the dark time t D between the two flashes of the group increases beyond a certain value, the bound ATP has a high probability of being hydro- lyzed during this time, and the ATP released from the site after the second flash decreases. This ex- plains the increase of the H + / A T P for t D values higher than 500 ms at pH 7 or 1 - 2 s at pH 8.
For the shortest times, the efficiency of the second flash of the group is maximum only when it is fired after a certain delay, 500 ms at external p H 7 or 1000 ms at pH 8, after the first flash. That means that after the first flash either the ATPase takes a certain time to recover a conformation sensitive to the effect of the second flash, or the energy stored after the first flash needs a certain time to be available on the second flash. We favour the first explanation, as there is no changes in the redox state of components of the electron- transfer chain in the same time range.
Variability of the H +/ A TP ratio
This ratio was measured after groups of six flashes, 3 ms apart, given at a frequency of 0.1 Hz. In these conditions we observed the maximum extent of the absorbance changes at 515 nm, AA515. The measurements were done for the 3rd to the 7th flash group and for the 21st to the 40th flash group. In this way we did not take into account the variations in A T P synthesis sometimes ob- served after the 1st and 2nd flash group. For each experiment the two determinations were identical and their values are given in Table II.
Within the precision of the measurements, the ratio of H + / A T P was constant for the same chlo- roplast preparation, whatever was the number of flash group already fired. Table II shows that even under conditions where the yield of A T P synthe- sized is decreased by 'aging' of the chloroplasts or by the addition of nanomolar concentrations of nigericin, the ratio of H + / A T P remained con- stant.
In the presence of nigericin and potassium ions we found an increase of the membrane proton permeability, and so a general decrease of the transmembrane proton electrochemical potential difference, A/XH. In those conditions we expected a progressive increase of the A T P synthesized with the number of flash group already fired as in
290 TABLE I1
ATP YIELD AND H+/ATP RATIO AFTER GROUPS OF SIX FLASHES, 3 ms APART, AS A FUNCTION OF THE CHLOROPLAST PREPARATION AND OF THE TIME OF THEIR CONSERVATION
Conditions were as in Fig. 2. In experiment 2 we gave the mean value of two consecutive determinations. The experimental results, giving the ratio H+/ATP, correspond to: the first value (left) observed for the 3rd to the 7th flash group, the second value (right) observed for the 21st to the 40th flash group. Taking into account the dispersion of the mean values and the probable error on the number of charges transferred per single saturating flash, the ratio H+/ATP is: 3.40+0.8, 2.25+0.7, 3.90+0.8, 1.90+0.55 in experiments 1, 2, 3 and 4, respectively. The concomitant measurements made with single flashes, fired at the same frequency, gave: experiment 1: H÷/ATP = 3.23 for 0.47 ATP synthesized per flash and 1000 chlorophylls, experiment 2: H÷/ATP = 4.96 for 0.34 ATP per flash and 1000 chlorophylls.
Experiment Time that chloro- Nigericin H +/ATP ATP/flash group
number plasts were kept (nM) Experimental Mean 1000 chlorophylls
(min) results values
1 20 0 2.74-3.49 3.11 1.36 120 0 3.19-3.33 3.26 1.02 140 0 3.75-3.45 3.60 0.7 160 0 3.27-3.73 3.50 0.84 2 20-40 0 2.03-2.47 2.26 1.72 3 0 0 3.22 4.38 3.80 1.51 100 2.5 2.78 4.99 3.89 0.41 140 0.5 3.60 3.60 0.84 200 0.1 3.78-4.02 3.90 0.85 240 0 4.47-3.93 4.20 1.01 4 0 0 1.57-1.74 1.65 2.75 40 0 1.59-2.11 1.85 1.98 60 1 2.26 1.87 2.07 1.67 100 5 1.69-2.10 1.90 1.61 160 0 2.47-1.67 2.07 2.26
e x p e r i m e n t s reported in Fig. 3. But, in the range of the nigericin c o n c e n t r a t i o n used, A T P synthesis was already m a x i m u m after the first flash g r o u p a n d r e m a i n e d c o n s t a n t o n the following flash groups.
F o r the different chloroplast p r e p a r a t i o n s the m e a n value of H ÷ / A T P ranged from approx. 4 to 2. U n t i l n o w we have n o t b e e n able to correlate these different values with changes in the A p H m e a s u r e d or in the c o n c e n t r a t i o n of the free A T P . W e p r o p o s e that this variability is directly linked to the variable p r o b a b i l i t y of hydrolysis of the new synthesized A T P b o u n d to the A T P synthase in the different chloroplast p r e p a r a t i o n s . This pro- posal is s u p p o r t e d by the observed acceleration of the dark decay of the f l a s h - i n d u c e d a b s o r b a n c e changes at 515 n m in the presence of A T P , espe- cially when i n o r g a n i c p h o s p h a t e is p r e s e n t [10]. I n this latter case, the acceleration of AA515 dark
decay is caused b y the s u p p l e m e n t a r y p r o t o n ef- flux t h r o u g h the A T P s y n t h a s e linked to a flash- i n d u c e d A T P synthesis from the A D P formed by hydrolysis of the b o u n d A T P a n d r e m a i n i n g b o u n d to the enzyme. T h u s this a d d i t i o n a l p r o t o n efflux is n o t related to a true A T P synthesis, b u t to a n e q u i l i b r i u m b e t w e e n b o u n d A T P a n d b o u n d A D P plus i n o r g a n i c phosphate, that is to say to a n exchange b e t w e e n the ),-phosphoryl group of A T P with i n o r g a n i c p h o s p h a t e [9,20].
C o n c l u s i o n
O u r results emphasize the necessity of t a k i n g i n t o a c c o u n t hydrolysis of the newly synthesized A T P molecules to get correct values of the ratio H ÷ / A T P . F r o m the AAs~ 5 a n d A T P c o n c e n t r a - tion changes m e a s u r e d as a f u n c t i o n of the time we could expect to m e a s u r e the true value of this
ratio. But technical difficulties are encountered. First the response of the luciferin-luciferase assay system is limited by the diffusion of ATP from the A T P synthase and the luminescence changes ob- served after a flash or a flash-group is slow, t~/2 =
0.8 s (Fig. 5). A direct comparison, at each time, between the ATP concentration and AA515 changes is not possible. Proton efflu~ across the ATPase is too fast, and is completed within 0.5 s after the flash group. ATP hydrolysis in the dark time be- tween the flash groups should change the kinetics of the AA515 dark decay, and could be so related with a proton influx. But observation of the AA515 in between two flash groups is of no meaning as the reliability of the measurements is low because of the lack of stability of the base line in long- range-time spectroscopic measurements. On the other hand we measure only the ATP free in the suspension. So for these reasons we compare free A T P synthesized after a flash group by taking into account the concomitant-free A T P hydrolyzed (in- ferred from the rate of A T P hydrolysis in the dark time between the flash groups) with the calculated proton efflux through the ATPase (within around 0.5 s after the flash group). So we measure only an apparent H ÷ / A T P ratio which should be higher than the true one as we underestimate the amount of A T P synthesized, bound and free.
The last point to take into account is the relia- bility of the measurement of the proton flux through the ATP synthase. We have made the assumption that at the same value of the AAs~ 5 observed, in the presence and in the absence of A D P and Pi, corresponds a same value of the A/2H and consequently of the basal flux of charges across the membrane. We suppose that just before the flash is fired the two components of this A/2H, A p H and preflash membrane potential difference are identical in the two experimental conditions. In fact, even if the A p H increases, as a function of the number of flash groups already fired, we have shown (Table I) that it remains the same in the absence and in the presence of A D P and Pi- Slow membrane-potential changes can be recorded by absorbance changes of oxonol VI [21]. We have never seen, before or after A D P and
Pi
addition, any absorbance change of this dye, reversed by KSCN or valinomycin and potassium ions, in complete darkness or within the 50 s time periodfollowing series of flashes. The best justification of the method used is the constancy of the ratio H + / A T P observed at the different periods of the series of flash groups or after nigericin addition. In the last case the basic proton flux is considerably enhanced.
The apparent values of the ratio H + / A T P reported in Table II vary from approx. 2 to 4. We think those differences are not the result of inde- terminate errors and we are not allowed to calcu- late an average value. We remark that the higher the ratio of ATP synthesized after a flash group to this synthesized after a single flash, the lower the apparent H ÷ / A T P ratio that was found. The fas- ter the turnover of the flash-induced ATP synthe- sis, the lower the stay of ATP on the enzyme and the lower the ratio H ÷ / A T P . That means we found the lower the H ÷ / A T P ratio in conditions where newly synthesized ATP, bound to the en- zyme, has the lower the probability to be hydro- lyzed before its release in the medium. Such varia- tions of this ratio H ÷ / A T P have been reported for A T P synthesis on E s c h e r i c h i a coli membranes, photosynthetic bacteria chromatophores and mitochondria [22,23]. The lower apparent value we found, 2 H ÷ per ATP, must be taken into account and should be very close to the true value.
References
1 Mitchell, P. (1966) Biol. Rev. Cambridge Phil. Soc. 41, 445-502
2 Gr~ber, P. and Win, H.T. (1976) Biochim. Biophys. Acta 423, 141-161
3 Avron, M. (1978) FEBS Lett. 96, 225-232,
4 Izawa, K. (1970) Biochim. Biophys. Acta 223, 165-173 5 Schr6der, H., Muhle, H. and Rumberg, B. (1972) in Pro-
ceedings of the 2nd International Congress on Photosynthe- sis (Forti, G., Avron, M. and Melandri, A., eds.), Vol. II, pp. 919-930, Dr. W. Jung Publishers, Dordrecht, The Netherlands
6 Schwartz, M. (1968) Nature (Lond.) 219, 915-919 7 Junge, W., Rumberg, B. and SchrOder, H. (1970) Eur. J.
Biochem. 14, 575-581
8 Schloder, E., ROgner, M. and Witt, H.T. (1982) FEBS Lett. 138, 13-18
9 Davenport, J.W. and McCarty, R.E. (1981) J. Biol. Chem. 256, 8947-8954
10 Girault, G. and Galmiche, J.M. (1978) Biochim. Biophys. Acta 502, 430-444
11 Galmiche, J.M. and Girault, G. (1982) FEBS Lett. 146, 123-128
292
13 Gr~iber, P., Burmeister, M. and Hortsch, M. (1981) FEBS Lett. 136, 25-31
14 Telfer, A., Bottin, H., Barber, J. and Mathis, P. (1984) Biochim. Biophys. Acta 764, 324-330
15 Mathis, P. and Setif, P. (1981) Isr. J. Chem. 21,316-320 16 Galmiche, J.M. and Girault, G. (1984) in Advances in
Photosynthesis Research (Sybesma, C., ed.), Vol. I!, pp. 379-382, Martinus Nijhoff/Dr. W. Junk Publishers, Dordrecht, The Netherlands
17 Strotmann, H., Hess, H. and Edelman, K. (1974) Biochim. Biophys. Acta 314, 202-210
18 Strotmann, H. and Schumann, J. (1983) Physiol. Plant. 57, 375-382
19 Girault, G,, Galmiche, J.M., Lemaire, C. and Stulzaft, O. (1982) Eur. J. Biochem. 128, 405-411
20 Wimmer, M.J. and Rose, I.A. (1977) J. Biol. Chem. 252, 6769-6775
21 Galmiche, J.M. and Girault, G. (1980) FEBS Lett. 118, 72-76
22 Vink, R., Robin Bendall, M., Simpson, S.J. and Rogers, P.J. (1984) Biochemistry 23, 3667-3675
23 Baccarini-Melandri, A., Casadio, R. and Melandri, B. (1981) Curr. Top. Bioenerg. 12, 197-258